Abstract
The construction and operation of a novel viscometer/rheometer are described. The instrument is designed to measure the viscosity of a macromolecular solution while automatically varying both solute concentration and shear rate. Viscosity is calculated directly from Poiseuille's Law, given the measured difference in pressure between two ends of a capillary tube through which the solution is flowing at a known rate. The instrument requires as little as 0.75 ml of a solution to provide a full profile of viscosity as a function of concentration and shear rate, and can measure viscosities as high as 500 cP and as low as 1 cP, at shear rates between 10 and 2 × 10³ s-1. The results of control experiments are presented to document the accuracy and precision of measurement at both low and high concentration of synthetic polymers and proteins.
Keywords/key phrases: rheometer, automated dilution, intrinsic viscosity, protein hydrodynamics, Mooney equation, polyethylene glycol, hemoglobin
Introduction
Measurement of viscosity is a widely used technique for the characterization of macromolecules in solution 1. The dependence of viscosity upon solute concentration in the limit of low concentration is a function of the size, shape, and mass of the solute molecule 2. The dependence of viscosity upon shear rate at low concentration is a function of molecular shape and flexibility 1. The dependence of viscosity upon concentration at high solute concentrations is a function of solute-solute interactions 3.
Although viscometers of many types are available commercially, to the best of our knowledge none are capable of measuring solution viscosity over a broad range of solute concentration and shear rate without substantial manual labor, substantial amounts of solute, and instrumental alterations to accommodate different ranges of viscosity and shear rate. The instrument described here was designed to circumvent as many of these complications as possible while at the same time requiring a minimum investment in components and construction costs.
In the following section, the preparation of experimental samples is described. Next, the instrument, its operation, and calculation of final results from raw data are described. The results of measurements designed to validate the technique of automatic dilution and the accuracy and sensitivity of the pressure sensors utilized are then reported. Next we present the results of measurements of the viscosity of synthetic polymer solutions over a broad concentration range, which are compared to published data. The results of measurements of the concentration dependence of solutions of various proteins measured at low and high concentration are then presented and compared with published data. Finally, we discuss the advantages that the design of this instrument provides over those of other viscometers that can in principle perform similar measurements.
Materials
Protein samples for intrinsic viscosity measurements
Fibrinogen from bovine plasma (Sigma, F8630) was prepared by dissolving 80mg in 10ml saline solution (0.9% NaCl) at 37C followed by dialysis in a 10kD dialysis cassette against 40mM PBS at ionic strength of 0.45M. The solution was concentrated to 25 mg/ml with a 10kD ultrafiltration device (Amicon, Millipore). BSA (Sigma, A1900) was dissolved and dialyzed against 23mM Sodium Acetate buffer pH 5, 0.2M NaCl. Ovomucoid (Warthington, 3086) was dissolved and dialyzed against 150mM sodium acetate buffer, pH 4.65. Ovomucoid and BSA were also filtered with a 0.1 um syringe filter (Anotop, Whatman). All protein samples were centrifuged for 30 minutes at 50000G, 20°C to remove large aggregates and dissolved gases. Protein samples were measured without further purification.
Preparation of a Concentrated hemoglobin (Hb) solution
Whole blood was diluted with isotonic solution of 0.9% NaCl in a 1:2.5 w/w ratio, respectively. The solution was washed three times by pelleting the blood cells by centrifugation (15 min, 3000 × g) and resuspending with saline solution. Intracellular protein content was extracted by resuspension of the cell paste with ice-cold water under vigorous stirring for 45 minutes on ice. Cell debris was removed from the protein extract by centrifugation for 30 minutes at 12000g. The supernatant was removed and kept at 4°C. Size exclusion chromatography analysis was used to estimate protein solution purity. Hb protein molecules were converted to the cyanmet form as previously described 4, and protein concentration was determined by absorbance at 540nm.
Polyethylene Glycol (PEG)
PEG fractions of five different average sizes (200, 400, 600, 2000 from Sigma, 1000 from Fluka) were used in the concentration-dependent viscosity measurements, and PEG of 106 average MW (Sigma) was used for the shear rate-dependent viscosity measurement. Samples were prepared by dissolving a weighed amount of PEG in ultra pure water, followed by overnight rocking or stirring at room temperature to achieve complete dissolution. All samples were used without further purification.
Sucrose and Glycerol
Ultra pure Sucrose (Invitrogen, cat#: 15503-022) and Glycerol (Sigma, cat#: 15523) were used. A 90% w/w solution of Glycerol was prepared by mixing ultra pure water with glycerol, and a 70% Sucrose w/w solution was prepared as previously described 5. Sucrose and glycerol concentrations were determined via differential refractometry as previously published 6.
Description and operation of the Viscometer apparatus
The apparatus consists of several parts, each of which is designated by a numeral in Figure 1. A programmable single-syringe pump is connected to a 6-way distribution valve (Hamilton, PSD/8) which controls fluid flow and source/destination of fluid flow (1). The distribution valve ports are connected to a diluent reservoir containing solvent (2), a reservoir for collection and recovery of the sample removed at each dilution step (3), an inlet through which the syringe is loaded with solution from the solution vial (4), the pressure measurement capillary tubing (6) that leads back into the solution vial, and an optional reference solution (open valve port). The solution is mixed continously by an overhead stirrer fitted to the top of the cylindrical vial, equipped with a custom made metal paddle (Fig. S1). The solution vial is tilted to ensure that all contents may be extracted via the outlet tubing.
Figure 1.
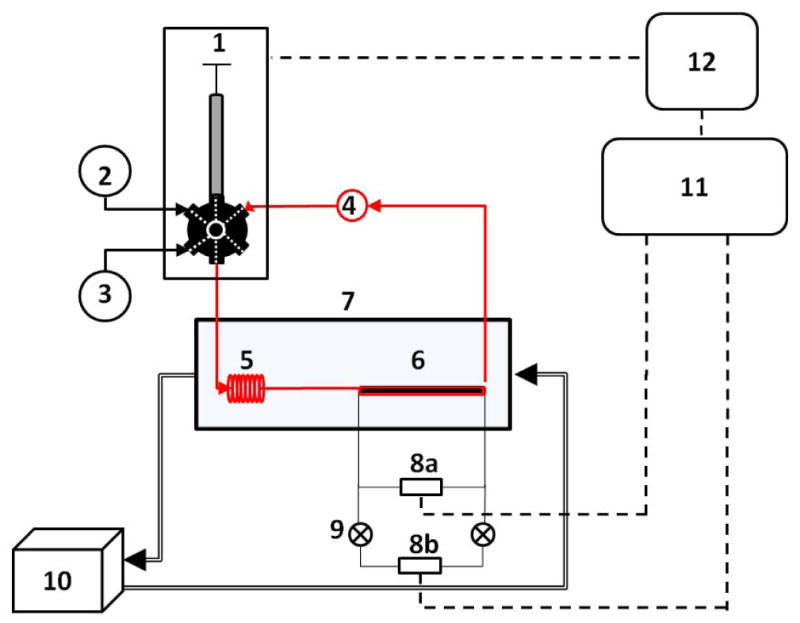
Schematic view of the viscometry system. (1) Programmable single-syringe pump connected to a 6-way distribution valve, (2) solvent reservoir, (3) waste container, (4) solution vial and top head stirrer, (5) stainless steel loop for temperature equilibration, (6) pressure tubing, (7) water bath, (8 a,b) differential pressure sensors, (9) low range pressure sensor protection valves, (10) Water pump, (11) Data acquisition Module, (12) personal computer.
During operation, solution flows from the syringe (1) through PEEK tubing into a sealed polycarbonate water bath (7) used to maintain temperature kept constant by a water pump (10). The solution then flows through a 100ul, 0.02” stainless steel tube (5) to ensure thermal equilibration with the water bath, and then through a capillary (6) constructed of PEEK tubing, subsequently referred to as the “pressure tubing”, which is connected at both ends through tee fittings (Upchurch) to two piezoelectric differential pressure sensors (Omega, PX-26 series) mounted in parallel (8a,8b). Two manual on/off valves (9) are positioned between the two sensors for sensor selection. After passing through the pressure tubing the solution returns to the solution vial (4). A model 6211 National Instruments data acquisition module (11) connected to a Windows PC (12) is used to collect analog data from the pressure sensors. The syringe pump and valve (1) are controlled directly by the PC through an RS232 serial interface.
A sample solution is diluted by removing an aliquot of the solution to the waste container followed by the addition of an equal volume of diluent to the sample vial. The volumes are precalculated by the software, given the total solution volume and the desired fractional extent of dilution per increment of dilution. This approach keeps the total solution volume constant in the absence of significant mixing non-additivity. An essential requirement for a successful dilution step is that the sample will be completely mixed in the tubing and sample vial. This is accomplished by means of continuous stirring of the sample with an overhead mixer and by washing the closed loop with the sample (vial to vial) which takes about three tubing volumes.
All operations of the apparatus, as well as data storage, processing, and analysis as described below, are controlled by user-written scripts and functions in MATLAB (R2006b, Mathworks).
Description of data processing and analysis
Measurement of viscosity and relative viscosity
The differential pressure between two ends of a cylindrical capillary of length l and radius r through which fluid of viscosity η is flowing at rate v is given by Poiseuille's law 1:
| [1] |
The differential pressure sensors used in the instrument described here produce a DC voltage, denoted by Sraw, given by
| [2] |
where denotes an offset voltage measured in the absence of a pressure differential and α is a proportionality constant. The value of α is calculated from the specifications of each sensor according to α = Smax/ΔPmax, where ΔPmax is the high end limit of the sensor range and Smax is the voltage produced at ΔPmax. The values of α and S0raw for a given sensor, and the accuracy of equation [2] are determined by measurement of Sraw as a function of flow rate v for a Newtonian fluid of known viscosity. The sensors utilized have been found to be accurate to within <0.5% of their full range. We may thus utilize the values of α and so determined to calculate the differential pressure according to
| [3] |
with known precision. In order to ensure that ΔP can be measured over a wide range of pressures with optimal accuracy and precision, the instrument is equipped with two pressure sensors in parallel whose sensitivities differ by a factor of usually 5 to 30. The default sensor is the low sensitivity sensor, which will not be damaged by differential pressures that might damage the high sensitivity sensor. However, when the differential pressure drops below a limit deemed safe for the high sensitivity sensor, the controlling program signals the user to open valves that activate the high sensitivity sensor, thus providing higher resolution pressure data at low pressures. Given an accurate measurement of ΔP, we can then calculate the absolute and relative viscosities according to
| [4] |
and the relative viscosity of a solution containing w/v concentration w of solute according to
| [5] |
where η0 and ΔP0 respectively denote the viscosity and differential pressure of solvent at the same flow rate.
Calculation of intrinsic viscosity
The intrinsic viscosity of a solute is defined as
| [6] |
Hence we may identify the intrinsic viscosity as the coefficient of the linear term in an expansion of either ηr or ln ηr in powers of w:
| [7] |
| [8] |
and may thus be evaluated by fitting a polynomial to the measured dependence of either ηr or ln ηr upon w at limiting low values of w.
Results
Validation of dilution protocol
In order to evaluate the accuracy of dilution at low viscosity, 1ml sample solutions of 40uM fluorescin in PBS pH 7, were diluted at 10%, 5% and 2% Volume steps. The volume removed at each dilution step was collected and the absorbance of each sample was measured at 430nm. The absorbances of all samples from a single gradient were normalized to the absorbance of the solution prior to dilution. The accuracy of dilution was evaluated by plotting the calculated relative concentration vs. the measured relative concentration by absorbance. The results shown in Figures S3 A-C indicate that the calculated dilution is accurate to within the precision of measurement. The accuracy of dilution of high viscosity solutions was also evaluated. A 1 ml sample of 70.6% w/w sucrose solution was diluted at 2% volume steps for 20 steps. The solution volume removed at each dilution step was collected and the refractive index was measured. Published data from tables of the refractive index dependence on sucrose concentration was fitted to a polynomial in order to calculate the concentration of the collected samples 6. The relative concentration calculated taking density effects into account is plotted against the measured relative concentration in Figure S3D. The results again show that the dilution is efficient and accurate for a solution, the initial viscosity of which is over 350cP at room temperature.
Verification of proportionality of sensor response, differential pressure and flow rate
In Figure S4, sensor output (mV) is plotted as a function of the flow rate of a 50% w/w glycerol solution. Sensor output depends linearly upon flow rate as predicted for a Newtonian fluid by equations [1] and [2].
Viscosity of concentrated glycerol and sucrose solutions
Measuring the viscosity of highly viscous solvents requires the complete mixing of all mixture components and the ability to measure over a broad range of pressure. To test the system under these conditions, concentrated solutions of 70% w/w Sucrose and 90% w/w glycerol were prepared, and the viscosity of these solutions was measured as a function of concentration by automated sequential volume dilutions of 2% and 5%. In Figure 2, The measured viscosities are plotted as a function of concentration (converted to w/w units) together with results taken from standard tables 6.
Figure 2.
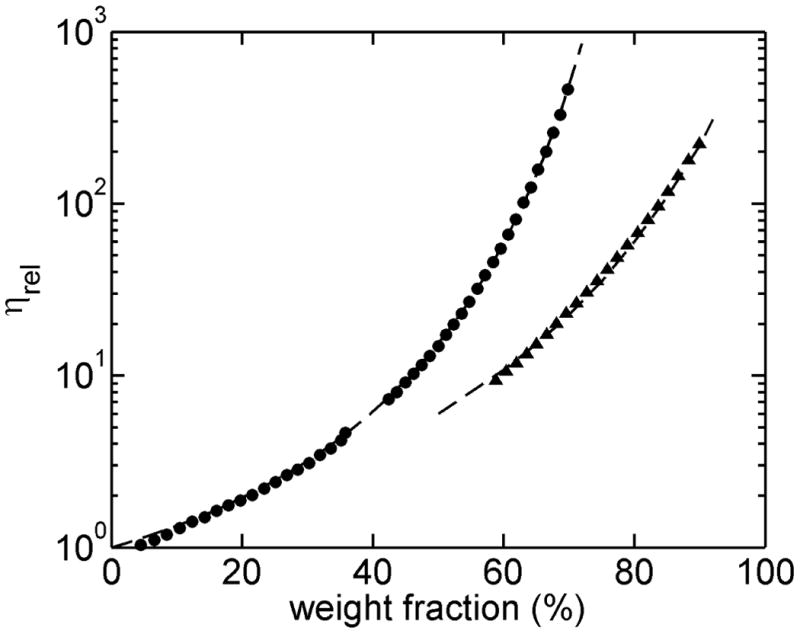
The relative viscosities of glycerol (▲) and sucrose (●) solutions at 20°C and the corresponding literature data (---) plotted as a function of w/w concentration.
Shear rate dependence of Viscosity for Newtonian and Non Newtonian solutions
The measured dependence of viscosity upon shear rate at 20°C is plotted in Figure 3 for a 25% w/w sucrose solution, exhibiting Newtonian behavior, and for a 1% w/w PEG solution (MW ∼ 106 D), exhibiting non-Newtonian shear thinning behavior in agreement with published results 7. In order to cover a wide range of shear rates the viscosity of each solution was measured with two different sizes of pressure tubing, described in the caption to Figure 3, at flow rates ranging from 10-0.5 ml/min. In the case of non-Newtonian behavior, the calculated values of shear rate and viscosity are apparent values, and may be corrected to true values by application of the Rabinowitsch equation 8.
Figure 3.
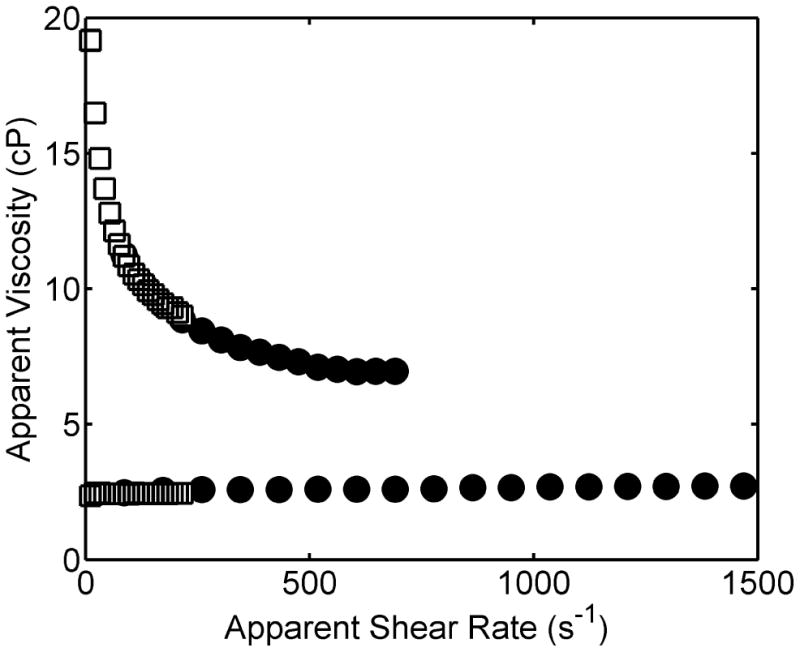
Dependence of apparent viscosity upon apparent shear rate for a 28% w/w sucrose solution (lower curve) and a 1% w/w high molecular weight PEG solution (upper curve), at 20°C. The shear rate was varied by changing flow rate and by replacement of pressure tubing, as described in the text. Results indicated by filled circles were measured using pressure tubing of 0.01” inner diameter and 4.4 cm length. Results indicated by open squares were measured using tubing of 0.02” inner diameter and 20 cm length.
Viscosity of polyethylene glycol (PEG) solutions
The viscosity of solutions of several different size fractions of PEG in water at 25°C was measured as a function of concentration in an automated series of dilutions from ∼30% w/v to ∼3% w/v. In Figure 4, the results of measurements in our apparatus are compared with those of previous measurements 9. The intrinsic viscosities were calculated with equation 8 and are in good agreement with published data (Fig. S5).
Figure 4.
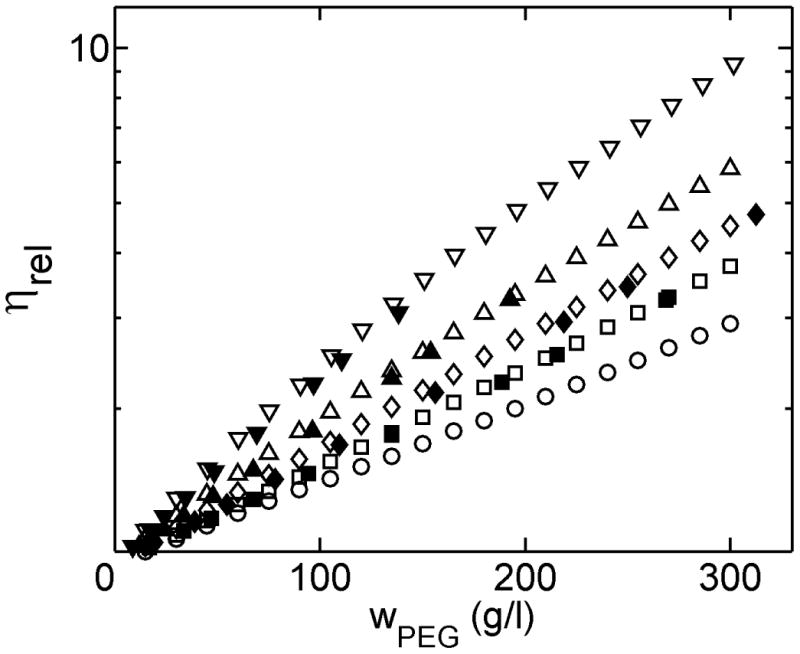
Log relative viscosity of PEG solutions as a function of w/v concentration. Open symbols are current results and filled symbols are literature data : ○ - PEG 200; □/■ - PEG 400; ◊/◆ - PEG 600; Δ/▲ - PEG 1000; ▽/▼ PEG 2000.
Intrinsic viscosity of proteins
The concentration dependence of the relative viscosity of solutions of ovomucoid, bovine serum albumin, and fibrinogen was measured via automated dilution in the low concentration regime. The results are plotted in Figure 5 together with the respective best-fits of equation [8], yielding the estimates of the intrinsic viscosity of each protein listed in Table 1. Literature values are also tabulated for comparison.
Figure 5.
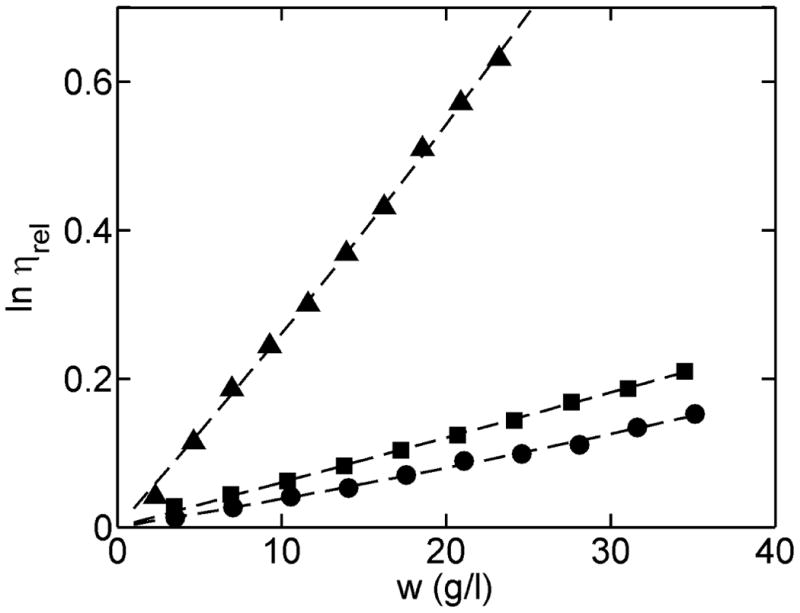
Log relative viscosity of three protein solutions as a function of concentration measured in the low concentration limit. ■-ovomucoid; ● - BSA; ▲- fibrinogen. The curves (---) were calculated using equation [8] with best-fit parameter values given in Table 1.
Table 1.
Estimates of intrinsic viscosity of three proteins measured at 25°C. Uncertainties indicated correspond to ± 1 standard error of estimate.
| Protein | [η] (cm3/g) | |
|---|---|---|
| Best fit of equation [8] to current data | Literature data | |
| Ovomucoid | 6 (5.9-6.2) | 5.4-5.6 15, 16 |
| BSA | 3.6 (3.5-3.7) | 3.6-3.8 17 |
| Fibrinogen | 25 (23.3-26.5) | 25-34 18 |
Viscosity of Hb over a broad range of concentration
The concentration dependence of the viscosity of purified Hb at 25°C was measured by automated dilution of a solution initially containing 325 g/l protein. The concentration dependence of the viscosity was modeled with the generalized Mooney equation 10.
| [9] |
Where w denotes w/v solute concentration and α a crowding factor. The results are plotted in Figure 6 and compared with data published previously. When all parameters are free, the best fit results are in very close to those previously reported, but with a relatively broad confidence limits. Fixing [η] to the literature value of 0.036 results in much narrower confidence limits for α = 0.43. Fitting the same equation to the concentration dependence of viscosity reported by Chien 11 gives the expected value of α, but only if both η0 and [η] are fixed, as done previously by Ross & Minton 10. A value of 0.43 for α was also obtained by Monkos 12.
Figure 6.
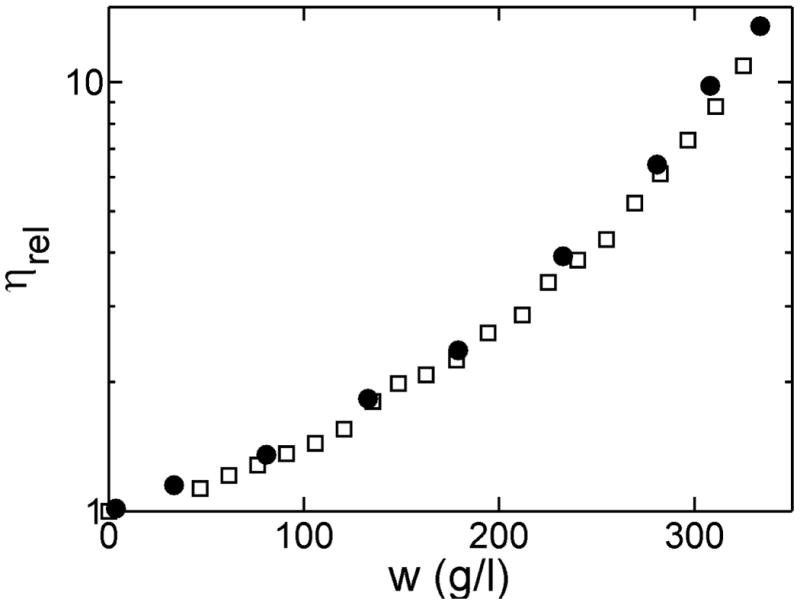
Log relative viscosity as a function of Hb concentration. Symbols: □ - Curren work, measured via automated dilution; ● - data of Chien11.
Discussion
Measurement of the rheological properties of concentrated protein solutions is a challenging task with implications for pharmaceutical formulations and delivery of concentrated therapeutics, as well as for characterization and understanding of the non-ideal behavior of these complex macromolecules. With this in mind, we designed a viscometer/rheometer with novel properties, capable of automatically measuring the concentration and shear dependence of viscosity of a small volume of solution over a broad range of viscosities and shear rates. The instrument was tested by measuring the viscosity of solutions over a broad range of concentrations ranging from nearly ideal to highly nonideal. As reported above, the results were compared to previously published data and found to be accurate in both the high and low viscosity regime.
A unique feature of this instrument is the automated dilution scheme, which to the best of our knowledge is not available in any of the commercially available viscometers/rheometers. The concentration gradient is created automatically by using a single syringe pump and a 6 way distribution valve, permitting faster and more accurate dilutions than can be performed manually. A complete concentration gradient experiment including 20 dilution steps with three shear rates at each concentration can be carried out in 1.5 hour. This design not only permits the dilution of a single solute species, but can be extended to variation of the composition of solutions containing multiple solute species, enabling, for example, a comprehensive study of the effect of varying a small solute on the viscosity of a solution of a macromolecule at constant concentration.
As of the date of writing, a total solution volume of as little as 0.75 ml has been found sufficient to perform a 20 step dilution gradient, which is equivalent to 37.5 ul of solution per dilution, with a recovery yield of >95%. Ongoing development is expected to further reduce sample volume. In contrast, many commercial viscometers/rheometers require sample volumes as large as 10 - 45 ml, and are hence not suitable for studies of concentrated solutions of proteins that are available only in small quantity. Commercial instruments that allow for small sample volume do not allow for automated dilution of the initial sample volume. As a consequence, in order to achieve a concentration gradient over the range reported here, a substantially larger total sample volume is required. The cyclic fluid flow design of our apparatus permits us to make numerous replicate measurements on a sample to obtain a more precise measurement without adding material.
The ability to measure the viscosity over a range of flow rates, and hence shear rates, provides rheometric capability. Cone and plate rheometers, usually limited to shear rates of greater than ∼1000 s-1, are prone to errors when measuring low viscosity protein solutions due to surface tension and evaporation of the sample 13. In contrast, the instrument described here allows for shear rates spanning more than two orders of magnitude even for a very dilute solution. Very low shear rates (< 1s-1) are not accessible in the current configuration due to the limiting pressure sensitivity available in the inexpensive commercial sensors employed.
In order to attain the full range of any viscometer or rheometer, interchangeable accessories are required, such as various size balls for the falling ball viscometer, differently angled cones for the cone/plate or sensor chips for the Rheosense VROC ™ apparatus. The main advantage of our instrument over these instruments is that the range and resolution of measurement can be varied broadly by simple variation of capillary length and inner diameter using inexpensive PEEK tubing and pressure sensors, the replacement of which is quick and simple.
By measuring the pressure drop across a cylindrical capillary rather than a rectangular channel as in the Rheosense VROC™, we can calculate viscosity in a straightforward fashion via Poiseuille's law rather than by recourse to non-analytical solutions of fluid flow that require extensive instrumental calibration to correct for nonlinear response. Calibration of the instrument described here is required only to ensure accurate dilution. An additional practical benefit deriving from use of the cylindrical capillary is that one can easily measure the pressure required to inject a particular pharmaceutical formulation through a hypodermic needle of any gauge and length 14.
The present instrument has been demonstrated to be capable of measuring viscosities with high precision over a viscosity range of 1 – 500 cP at shear rates ranging from 10 to 2000 s-1. This instrument utilizes a distribution valve that is rated to withstand a maximum pressure of 100 psi. The consequent restriction on allowable back pressure places an upper limit on flow rates and measurable viscosity. We estimate that by using commercially available distribution valves rated to withstand a maximum pressure of 1000 psi, the range of accessible shear rates and viscosities could be extended upward by a factor of five.
Supplementary Material
Acknowledgments
The authors thank Paul Smith (NIH) for helpful comments on a draft of this manuscript. This research is supported by the Intramural Research Program of the National Institute of Diabetes and Digestive and Kidney Diseases.
References
- 1.Tanford C. Physical Chemistry of Macromolecules. Wiley & Sons; New York: 1963. [Google Scholar]
- 2.Harding SE. Progress in Biophysics & Molecular Biology. 1997;68:207–262. doi: 10.1016/s0079-6107(97)00027-8. [DOI] [PubMed] [Google Scholar]
- 3.Saluja A, Kalonia DS. International Journal of Pharmaceutics. 2008;358:1–15. doi: 10.1016/j.ijpharm.2008.03.041. [DOI] [PubMed] [Google Scholar]
- 4.Crosby WH, Houchin DN. Blood. 1957;12:1132–1136. [PubMed] [Google Scholar]
- 5.Quintas M, Brandao TRS, Silva CLM, Cunha RL. Journal of Food Engineering. 2006;77:844–852. [Google Scholar]
- 6.Lide DR. CRC handbook of chemistry and physics: a ready-reference book of chemical and physical data. CRC Press; 2004. [Google Scholar]
- 7.Ebagninin KW, Benchabane A, Bekkour K. Journal of Colloid and Interface Science. 2009;336:360–367. doi: 10.1016/j.jcis.2009.03.014. [DOI] [PubMed] [Google Scholar]
- 8.Stratton RA. Journal of Colloid and Interface Science. 1966;22:517–530. [Google Scholar]
- 9.Kirincic S, Klofutar C. Fluid Phase Equilibria. 1999;155:311–325. [Google Scholar]
- 10.Ross PD, Minton AP. Biochemical and Biophysical Research Communications. 1977;76:971–976. doi: 10.1016/0006-291x(77)90950-0. [DOI] [PubMed] [Google Scholar]
- 11.Chien S, Usami S, Bertles JF. Journal of Clinical Investigation. 1970;49:623–634. doi: 10.1172/JCI106273. [DOI] [PMC free article] [PubMed] [Google Scholar]
- 12.Monkos K. International Journal of Biological Macromolecules. 1994;16:31–35. doi: 10.1016/0141-8130(94)90008-6. [DOI] [PubMed] [Google Scholar]
- 13.Sato J, Breedveld V. Applied Rheology. 2005;15:390–397. [Google Scholar]
- 14.Jezek J, Rides M, Derham B, Moore J, Cerasoli E, Simler R, Perez-Ramirez B. Adv Drug Deliv Rev. 2011;63:1107–1117. doi: 10.1016/j.addr.2011.09.008. [DOI] [PubMed] [Google Scholar]
- 15.Donovan JW. Biochemistry. 1967;6:3918–3927. doi: 10.1021/bi00864a038. [DOI] [PubMed] [Google Scholar]
- 16.Waheed A, Salahuddin A. Biochemical Journal. 1975;147:139–144. doi: 10.1042/bj1470139. [DOI] [PMC free article] [PubMed] [Google Scholar]
- 17.Buzzell JG, Tanford C. Journal of Physical Chemistry. 1956;60:1204–1207. [Google Scholar]
- 18.Shulman S. Journal of the American Chemical Society. 1953;75:5846–5852. [Google Scholar]
Associated Data
This section collects any data citations, data availability statements, or supplementary materials included in this article.


