

Abstract
The self-renewal capacity ascribed to embryonic stem cells (ESCs) is reminiscent of cancer cell proliferation, raising speculation that a common network of genes may regulate these traits. A search for general regulators of these traits yielded a set of microRNAs for which expression is highly enriched in hESCs and liver cancer cells (HCCs), but attenuated in differentiated quiescent hepatocytes. Here, we show that these microRNAs promote hESC self-renewal, as well as HCC proliferation, and when overexpressed in normally quiescent hepatocytes, induce proliferation and activate cancer signaling pathways. Proliferation in hepatocytes is mediated through translational repression of Pten, Tgfbr2, Klf11 and Cdkn1a, which collectively dysregulates the PI3K/AKT/mTOR and TGFβ tumor suppressor signaling pathways. Furthermore, aberrant expression of these miRNAs is observed in human liver tumor tissues, and induces epithelial-mesenchymal transition in hepatocytes. These findings suggest that microRNAs that are essential in normal development as promoters of ESC self-renewal are frequently up-regulated in human liver tumors, and harbor neoplastic transformation potential when they escape silencing in quiescent human hepatocytes.
Keywords: Human embryonic stem cells, microRNAs, hepatocellular carcinoma cells
Introduction
Human embryonic stem cells (hESCs) are derived from the inner cell mass of the blastocyst stage of development, characterized by a unique capacity for indefinite self-renewal, while maintaining an ability to differentiate into specialized cells (1). In early mammalian development, the transition from ESCs to various cell fate lineages is carefully orchestrated by the loss of molecular programs governing the maintenance of pluripotency and self-renewal, and activation of new programs specific for lineage determining cells. The switch from self-renewing to quiescent cellular status is particularly evident during liver morphogenesis when ESCs differentiate into quiescent hepatocytes (2). Because 70–80% of the cytoplasmic liver mass is composed of hepatocytes, much attention has been focused on directing the differentiation of hESCs into hepatocytes in vitro, in an effort to generate cells suitable for replacing damaged liver tissue in patients with acute liver failure or chronic end-stage liver disease. While the past decade has witnessed a growing body of literature having demonstrated a significant methodological progress for enriching hepatocyte-like derivatives from hESCs (3, 4), an efficient method for evaluating the safety of these derivatives for therapeutic applications remains largely unexplored.
The safety of hESCs and their derivatives is an important concern in regenerative medicine. Although the extensive self-renewal capacity ascribed to hESCs is a major asset as an abundant source of pluripotent cells for use in tissue replacement, their reminiscence to cancer cell proliferation has raised concerns regarding the tumorigenic risk of stem cells and their derivatives in transplanted tissues (5, 6). The apparent parallels between stem cell self-renewal and cancer cell proliferation have led to speculation that a common network of genes may regulate these traits, and that tight control of these genes during the lineage specification process of pluripotent stem cells into quiescent cellular lineages is critical for avoiding tumor formation (7–13). However, to date, it remains unclear whether genes that are essential in normal development as promoters of ESC self-renewal are pervasively up-regulated in cancer cells, and whether a failure to attenuate the expression of these genes in normal quiescent differentiated cell types may give rise to neoplastic transformation.
In this study, we examined whether microRNAs (miRNAs) that are highly expressed in hESCs, as well as liver cancer cells (HCCs) play an important role in normal development as promoters of ESC self-renewal, and whether a failure to attenuate the expression of these genes in quiescent human primary hepatocytes leads to the induction of proliferation and activation of cancer signaling pathways. miRNAs are noncoding endogenous regulatory RNAs that refine and limit the expression of mRNAs post transcription by suppressing translation, and influencing the ultimate proteome (14, 15). These RNAs are particularly useful for evaluating whether ESC self-renewal promoting genes may possess neoplastic transformation potential in differentiated quiescent cell types, because recent reports have demonstrated that miRNAs are essential promoters of ESC self-renewal (16). In contrast, although a plethora of literature has described the vital regulatory role of this family of RNAs in a wide array of cellular programming, including embryonic development and cancer initiation (17, 18), whether ESC self-renewal promoting miRNAs are up-regulated in HCCs, and whether they harbor neoplastic transformation potential in differentiated quiescent human hepatocytes remain unexplored.
Here we show that miRNAs commonly enriched in hESCs and HCCs promote self-renewal and proliferation, and that aberrant expression of these RNAs in normally quiescent human hepatocytes induces proliferation and activates cancer signaling pathways. We show that proliferation in hepatocytes is mediated through direct translational repression of Pten, Klf11, Tgfbr2 and Cdkn1a, which collectively dysregulates the PI3K/AKT/mTOR and TGFβ tumor suppressor signaling pathways. Moreover, our analysis show that these miRNAs induce epithelial-mesenchymal transition when aberrantly expressed in human primary hepatocytes. In human liver tumor tissues, these miRNAs are highly expressed. These findings suggest ESC self-renewal promoting miRNAs are frequently up-regulated in HCCs, and that they harbor neoplastic transformation potential when they escape silencing in human hepatocytes. For this reason, tracking the loss of miRNAs that promote ESC self-renewal during the in vitro differentiation process of hESCs into hepatocytes is highly important as one possible measure of safety and efficacy for therapeutic purposes.
Materials and Methods
Cell culture and differentiation
Human ES cells
The human H1 and H9 ES cell lines were obtained from the WiCell Research Institute (WA09), and maintained as a monolayer in 6-well (9.6cm2) plates on gamma irradiated MEF feeder layers in Dulbecco’s modified Eagle’s medium (DMEM)/Ham’s F-12 medium (Invitrogen) supplemented with 20% KnockOut Serum Replacement (Invitrogen), 4 ng/ml basic fibroblast growth factor (Invitrogen), 1mM nonessential amino acids (Invitrogen), 2mM L-Glutamine (Invitrogen), 100u/ml penicillin/streptomycin (Invitrogen), and 0.55 mM 2-mercaptoethanol (Invitrogen).
Human iPS Cells
Human iPS cells were generated from IMR90 cells following the method described by Takahashi et al.(19, 20).
Mouse ES Cells
Mouse v6.5 C57BL/6 and Dgcr8 null ES cells were obtained from Open Biosystems. The cells were maintained as a monolayer on 6-well (9.6cm2) plates on gamma irradiated MEF feeder layers in DMEM (Invitrogen) supplemented with 15% fetal bovine serum (Hyclone), 1000U/ml leukemia inhibitory factor (Millipore), 1mM nonessential amino acids (Invitrogen), 2mL L-Glutamine (Invitrogen) and 0.01 mM 2-mercaptoethanol (Invitrogen).
Human primary hepatocytes
hPHs were obtained from the Liver Tissue Procurement and Distribution System at the University of Pittsburgh. Upon receiving the cells, they were washed three times in PBS without calcium and magnesium, and maintained in the HCM Bullet Kit (Lonza).
Hepatocellular carcinoma cells
HepG2 and Hep3B cells (American Type Culture Collection) were cultured per the manufacturer’s instructions. Huh7 was a gift from Mark Feitelson at Thomas Jefferson University, and cultured in the same manner as HepG2 and Hep3B cells.
mRNA and miRNA expression microarrays
mRNA arrays
RNA samples were isolated using the Qiagen RNeasy Kit (Qiagen). Prior to array experiments, the quality of the RNA samples was assayed using the Agilent Systems Bioanalyzer 2100. The total RNA from each sample was biotinylated and amplified for hybridization to Illumina Sentrix Expression Beadchip HumanRef-8 v3.0. This array platform consists of eight parallel strips, each strip composed of 24,500 probes from the NCBI refseq database (Build 36.2, Release 22). Arrays were processed and scanned per the manufacture’s instruction, and analyzed using the BeadStudio Software v3.0. All signals were normalized, log2-transformed, and ranked according to the log2 values. For each gene, the criteria for enrichment was set at log2 value of 7.0 or higher. Hierarchical clustering was performed with average linkage and Pearson correlation. To generate the heatmap, values were centered and normalized to a mean of 0 and a standard deviation of 1.
miRNA arrays
miRNA samples were isolated using the Qiagen miRNeasy Mini Kit (Qiagen). The purified miRNA samples were labeled with Hy5™ flourophores using the miRCURY LNA microRNA Power Labeling Kit (Exiqon) and hybridized to miCURY LNA Array v.10 (Exiqon). The processed arrays were scanned at 10-um resolution using the GenePix 400B scanner (Axon Instruments). The raw data were normalized, log2-transformed, and ranked according to the log2 values.
DAVID analysis
Functional annotation clusterings were performed using the DAVID Bioinformatics Resources 2010. Gene sets that were common between HCCs and hESCs, and HCCs and hPHs, were subjected to separate clustering analyses. Each gene set was entered into DAVID’s functional annotation clustering tool, which generated clusters of genes based on the similarity of the functional terms assigned to each gene. The clusters were then ranked according to the EASE scores of each term, and the twelve (Figures 1F and 1G) highest ranked clusters were selected for analysis. Within each cluster, the Gene Ontology term with the lowest P value was selected as a representative functional term.
Figure 1. miRNAs regulate ESC self-renewal and HCC proliferation.
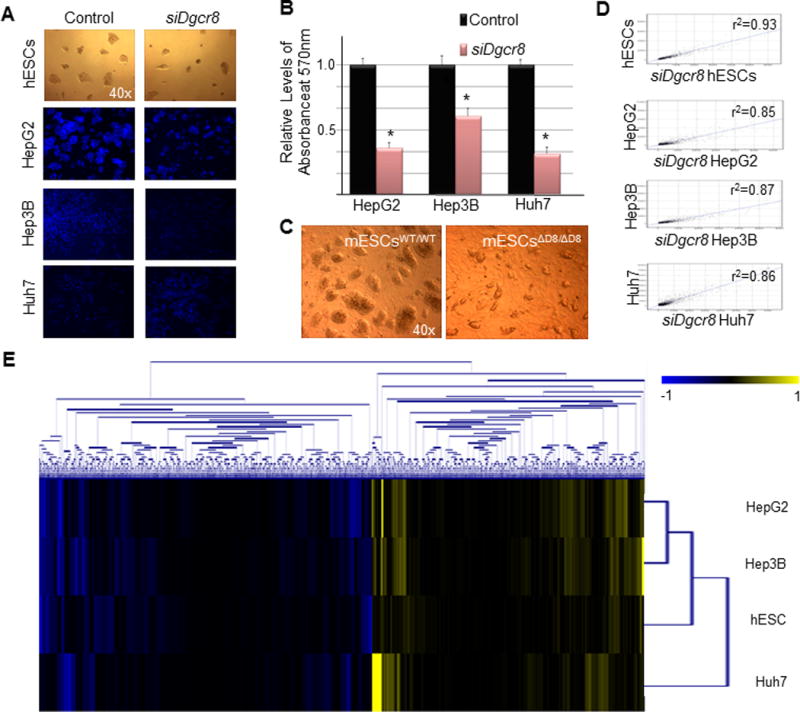
(A) Images of hESCs and HCCs 36 hours post siDgcr8 or mock siRNA transfection. HCCs are stained with hoeschst 33342. (B) hESCs and HCCs were evaluated for self-renewal and proliferation 36 hours post siDgcr8 or mock siRNA transfection using an MTT based assay. For all statistical analysis, n=3, error bars represent s.e.m., and Student’s t-test results are indicated by (*) P<0.05 relative to the control. (C) Images of wild-type mESCs (mESCsWT/WT) and Dgcr8 null mESCs (mESCsΔD8/ΔD8) two days after sub-culture. (D) The scatter plot diagrams show the results of Pearson correlation analyses of hESCs and HCCs transfected with siDgcr8 relative to the control. The control samples are plotted on the Y-axes against the Dgcr8 knock-down samples on the X-axis. The respective correlation coefficient values are reported on the scatter plots. (E) Hierarchical clustering analysis of gene sets that are either differentially up- or down-regulated in hESCs and HCCs 48 hours post siDgcr8 transfection. The differential scores were derived using Illumina’s custom differential expression algorithm for which Differential Score = (10sgn(Icond−Iref)log10(p)). Genes that scored a differential value of 1 or greater were categorized as differentially up-regulated, and genes that scored a value of −1 or less were categorized as differentially down-regulated. The scale bar across the top of the heatmap depicts standard deviation change from the mean.
Lentivirus vector constructs and virus production
The sense and antisense oligonucleotides of precursor miRNAs were annealed and cloned into the plasmid pLVTHM (Addgene #12247) between the MluI and ClaI restriction sites under the H1 promoter. A control vector pLVTHM was designed with a scrambled oligonucleotide sequence as described in Xu et al. (21). All vectors were verified by sequencing. Lentivirus production and tittering were carried out following protocols from Trono lab (http://tronolab.epfl.ch).
Quantitative RT-PCR
For mRNA RT-qPCR, total RNA was isolated using the Qiagen RNeasy Kit (Qiagen), and SuperScript III RT-qPCR Kit (Invitrogen) was used to synthesize cDNAs. For miRNA RT-qPCR, miRNAs were isolated using miRNeasy Mini Kit (Qiagen), and reverse transcribed into cDNAs using miRCURY LNA First Strand cDNA Kit (Exiqon). For both mRNAs and miRNAs, RT-qPCR mixture was prepared using either ABI TaqMan or Sybr Master Mix (ABI), and RT-qPCR were performed on the ABI PRISM 7700 Sequence Detection System (ABI). The comparative 2-(ΔΔCt) method was used to determine the relative quantitative levels of mRNAs using GAPDH for mRNA normalization and Exiqon’s Endogenous Control Primers (Exiqon) for miRNA normalization, and expressed in values as relative difference compared to the relevant controls.
Luciferase reporter construct and assay
The luciferase reporter was constructed by PCR amplifying the 3′UTR regions of human Cdkn1a, Pten, Klf11 and Tgfbr2 from the bacterial artificial clones (BACs) RP11-265F6, RP11-846G17, RP11-51D2 and RP11-179K2 (BAC/PAC Resources, http://bacpac.chori.org). The amplicons were cloned into the pMIR-REPORT firefly luciferase plasmid. All vectors were verified by sequencing. 20,000 Dgcr8 knock-out mESCs were cultured on 48-well plates for 48 hours, and co-transfected with firefly luciferase reporter plasmids with the 3′UTR inserts and renilla luciferase reporter plasmids as a normalization control, and either miRNA mimics (Qiagen) or mock molecules (Ambion) using Lipofectamine 2000 (Invitrogen). Cells were lysed 36 hours post transfection, and processed for luciferase assays using the Luciferase Dual Reporter Assay System (Promega).
Western Blots
72 hours after the hPHs were transduced with lentivirus, the cells were lysed using the RIPA Lysis and Extraction Buffer (Pierce Biotechnology). The protein concentration was estimated by the BCA Protein Assay Kit (Pierce Biotechnology), and the protein lysates were separated on a 10% gradient sodium dodecyl sulfate-polyacrylamide gene electrophoresis (SDS-PAGE). The separated proteins were transferred to a Protran membrane, and blocked with 5% milk-TBS-Tween buffer at 4°C. The antibodies used were CDKN1A (Cell Signal), PTEN (Cell Signal), KLF11 (Abcam), TGFBR2 (Abcam), E-Cadherin (Cell Signal), Claudin-1 (Cell Signal), ZO-1 (Cell Signal), N-Cadherin (Cell Signal), Snail (Cell Signal), Slug (Cell Signal), and TCF8/ZEB1 (Cell Signal). The primary antibodies were detected with HRP conjugated goat polyclonal secondary antibody to rabbit IgG (Abcam).
Cell proliferation assay
mESCsΔDgcr8/ΔDgct8
10,000 Dgcr8 null mESCs were grown on 48-well plates, and transfected with 50pmol of miRNA mimic molecules or mock precursor molecules (Qiagen) using Lipofectamine 2000 (Invitrogen) 24 hours after initial plating of the cells. Four days later, cell proliferation assay was measured using the Cell Titer Cell Proliferation Assay (Promega) at 570mn absorbance.
HCCs
10,000 HepG2, Hep3B and Huh7 cells were grown on 48-well plates, and transfected with 50pmol of siDgcr8 or siControl mock molecules (Ambion) using Lipofectamine 2000 (Invitrogen) 24 hours after initial plating of the cells. Cell proliferation was measured 48 hours later using the Cell Titer Cell Proliferation Assay (Promega) at 570nm absorbance.
Hoechst staining
100,000 HepG2, Hep3B and Huh7 cells were grown on 12-well plates, and transfected with 100pmol of siDgcr8 (Ambion) or mock molecules (Ambion) using Lipofectamine 2000 (Invitrogen) 24 hours after initial plating of the cells. Another 48 hours later, HCCs were stained with 5uM of Hoechst 33342.
Results
miRNAs Regulate hESC Self-Renewal and HCC Proliferation
As a starting point of our study, we sought to determine whether miRNAs are involved in regulating hESC self-renewal and HCC proliferation. To do this, an RNA binding protein, DGCR8, which is required for the biogenesis of all canonical miRNAs (22, 23), was transiently knocked-down in hESCs and HCC using an RNA interference strategy. Using this approach, we observed a significant decrease in self-renewal and proliferation in hESCs and HCCs (Figs. 1a–c). Pearson correlation analysis of global gene expression patterns between the control and the Dgcr8 knock-down conditions revealed a minor change in gene expression patterns subsequent to the depletion of miRNAs in these cells (Fig. 1d). In Supplementary Figure S1 we provide Pearson correlation analyses of all cell samples evaluated prior to the Dgcr8 knock-down. An evaluation of up- and down-regulated genes in hESCs and HCCs following the knock-down of Dgcr8 uncovered 2713 differentially down-regulated genes and 2220 differentially up-regulated genes (Fig. 1e). Gene Ontology (GO) analysis of differentially down-regulated genes revealed the enrichment of genes with functional descriptions associated with general cellular processes (Table 1), while a large fraction of genes that are differentially up-regulated possess GO functional terms describing cell cycle regulation (mitotic cell cycle, regulation of cell cycle process, and G1/S transition of mitotic cycle) (Table 2). These findings suggest that miRNAs may play a role as promoters of hESC self-renewal and HCC proliferation by suppressing a common network of genes that may function as negative regulators of cell cycle progression in these two classes of cells.
Table 1. GO annotations of mRNAs up-regulated post Dgcr8 knock-down.
Top 12 highest GO functional annotation clusters of mRNAs that are categorized as differentially up-regulated in hESCs and HCCs following Dgcr8 knock-down.
| Cluster | Enrichment Score | GO Term | P-Value |
|---|---|---|---|
| 1 | 7 817 | GO:0044238~primary metabolic process | 0.000 |
| 2 | 5.840 | GO:0044267~ceIlular protein metabolic process | 0.000 |
| 3 | 5.413 | GO:0046907~intracellular transport | 0.000 |
| 4 | 4.248 | GO:0016070~RNA metabolic process | 0.000 |
| 5 | 4.107 | GO:0006403~RNA localization | 0.000 |
| 6 | 4.076 | GO:0044248~cellular catabolic process | 0.000 |
| 7 | 3.494 | GO:0031328~regulation of cellular biosynthetic process | 0.000 |
| 8 | 3.369 | GO:0032869~cellular res ponse to insulin stimulus | 0.000 |
| 9 | 2.580 | GO:0006082~organic acid metabolic process | 0.001 |
| 10 | 2.520 | GO:0016192~vesicle-mediated transport | 0.001 |
| 11 | 2.352 | GO:0016265~death | 0.002 |
| 12 | 2.170 | GO:0070647~protein modification | 0.005 |
Table 2. GO annotations of mRNAs down-regulated post Dgcr8 knock-down.
Top 12 highest GO functional annotation clusters of mRNAs that are categorized as differentially down-regulated in hESCs and HCCs following Dgcr8 knock-down. Boxed in red are GO terms that are associated with functions involving cell cycle regulation.
| Cluster | Enrichment Score | GO Term | P-Value |
|---|---|---|---|
| 1 | 4.820 | GO:0043085~positive regulation of catalytic activity | 0.000 |
| 2 | 4.363 | GO:0031400~negative regulation of protein modification | 0.000 |
| 3 | 3.830 | GO:0016043~cellular component organization | 0.000 |
| 4 | 2.558 | GO:0000278~mitotic cell cycle | 0.000 |
| 5 | 2.446 | GO 0010564~regulation of cell cycle process | 0.000 |
| 6 | 2.363 | GO:0016070~RNA metabolic process | 0.000 |
| 7 | 2.337 | GO:0007155~cell adhesión | 0.002 |
| 8 | 2.135 | GO:0010563~negative regulation of phosphorus metabolism | 0.002 |
| 9 | 2.067 | GO:0006351~transcription, DNA-dependent | 0.006 |
| 10 | 1.919 | GO:0051179~localization | 0.004 |
| 11 | 1.862 | GO:0000082~G1/S transition of mitotic cell cycle | 0.003 |
| 12 | 1.777 | GO:0006874~cellular calcium ion homeostasis | 0.004 |
A Subset of miRNAs Commonly Enriched in hESCs and HCCs Promotes ESC Self-Renewal
Having shown that miRNAs may play a role as promoters of hESC self-renewal and HCC proliferation, we sought to determine whether miRNAs that are commonly enriched in these two classes of cells are involved in controlling these traits. To identify miRNAs that are highly enriched in hESCs and HCCs, but the expressions are either lost or severely attenuated in quiescent human primary hepatocytes (hPHs), global miRNA expression profiles were established for hESCs, HCCs and hPHs. Using this approach, we identified eight miRNAs (miRs -106a, -106b, -18a, -18b, -17, -93, -301a and -130b) that are highly expressed in both hESCs and HCCs at a level at least two-fold greater than hPHs (Figs. 2a–b). We then utilized a modified version of a previously reported screening strategy(16) for determining the self-renewal promoting capacity of miRNAs using mouse ESCs (mESCs) with a homozygous deletion of Dgcr8 (Figs. 2c–d). This approach allowed us to determine that six miRNAs (miRs -106a, -106b, -17. -19. -301a and -130b), among the eight miRNAs evaluated, were capable of rescuing the self-renewal deficiency in Dgcr8 null mESCs (Fig. 2e). For brevity, these six miRNAs will be referred to as embryonic and HCC miRNAs (EHCC miRNAs). The transient knock-down of the endogenous expressions of EHCC miRNAs in hESCs and HCCs using antagomirs decreased self-renewal and proliferation (Figs 2f). These observations show that miRNAs that play an important role in normal development as promoters of ESC self-renewal are co-opted by HCCs to facilitate proliferation. Interestingly, EHCC miRNAs were not capable of rescuing hepatic lineage specification during the directed differentiation process of Dgcr8 null mESCs along a hepatic lineage in vitro (Supplementary Figs. S2a–c and S3a). Taken together, these findings suggest that the primary function of EHCC miRNAs in normal development is to promote ESC self-renewal, and that in HCCs, the same set of miRNAs is highly expressed and function as facilitators of uncontrolled proliferation.
Figure 2. A subset of miRNAs commonly enriched in hESCs and HCCs is capable of rescuing the self-renewal deficiency in Dgcr8 null mESCs.
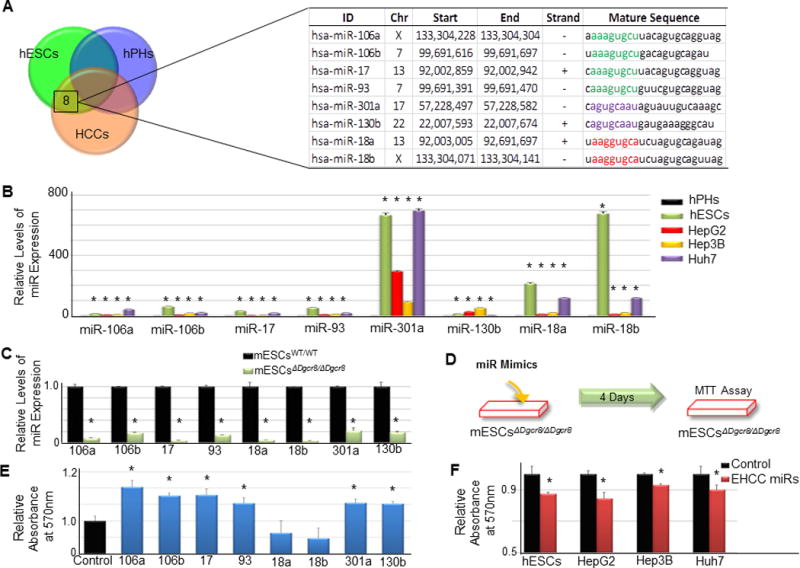
(A) The Venn diagram shows eight miRNAs that are expressed at a level least two-fold greater in hESCs and HCCs relative to hPHs. The three circles represent hESCs (green), hPHs (blue), and HCCs (orange). The identity of eight miRNAs, chromosome (Chr) and genomic locations, strand information, and mature sequences are listed in the table. Identical seed sequences are labeled with the same color. (B) RT-qPCR validates the enrichment pattern of the eight miRNAs in hESCs and HCCs relative to hPHs. (C) RT-qPCR confirms that the mature transcripts of the eight miRNAs are nearly undetectable in Dgcr8 null mESCs. (D) The schematic diagram outlines the procedure for evaluating the self-renewal promoting capacity of miRNAs using Dgcr8 null mESCs (mESC(ΔD8/ΔD8)). (E) MTT assay shows six out of eight miRNAs that were identified to be commonly enriched in hESCs and HCCs (Figure 2A) to possess a capacity to promote ESC self-renewal. (F) Transient knock-down of EHCC miRNAs in hESCs and HCC using antagomirs hinders self-renewal and proliferation. For all statistical analysis, n=3 (for Figure 2E, n=5), error bars represent s.e.m., Student’s t-test results are indicated by (*) P<0.05 relative to hESCs.
EHCC miRNAs Induce Proliferation in hPHs
We next sought to determine whether EHCC miRNAs are capable of inducing proliferation in normally quiescent hPHs. To do this, we utilized lentivirus to mediate the expression of EHCC miRNAs in hPHs (Fig 3a and Supplementary Fig. S4a). Three days post transduction, RT-qPCR validated the expression of EHCC miRNAs (Fig. 3b), and an MTT-based cellular proliferation assay was performed to evaluate the proliferation promoting capacity of these miRNAs. The MTT-based assay revealed a significant increase in hPHs in the EHCC miRNA expressing conditions relative to the control (Fig. 3c). Immunostaining with an antibody against a cell proliferation marker (KI67) showed that hPHs transduced with lentivirus expressing EHCC miRNAs possessed higher frequency of KI67 positive cells relative to the control (Fig. 3d). To exclude the possibility that the observed proliferation differences between the experimental and control conditions were caused by cell death, live/dead cell staining was performed to show that the number of dead cells in both conditions were similar (Fig. 3e). These findings indicate that stable expression of EHCC miRNAs in normally quiescent hPHs induces proliferation in vitro.
Figure 3. EHCC miRNAs induce proliferation in quiescent hPHs.
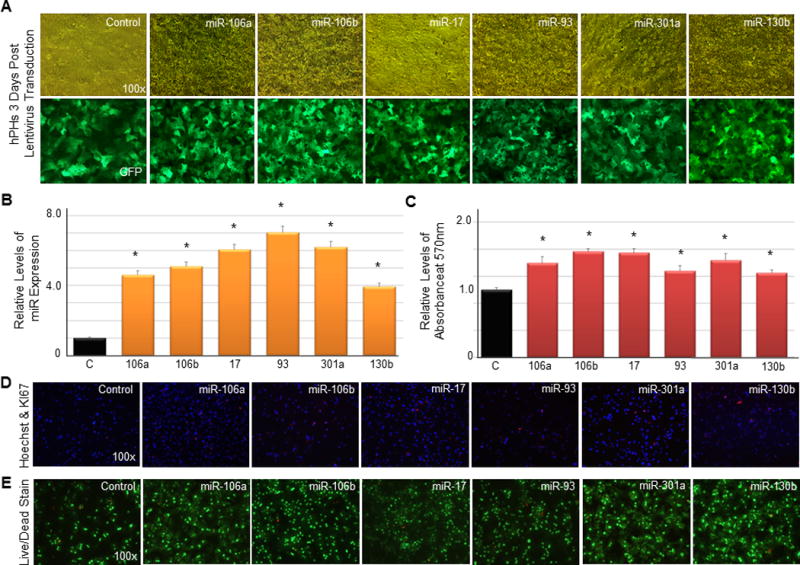
(A) Images of hPHs three days following the transduction of lentivirus mediating the expression of EHCC miRNAs. (B) RT-qPCR validates the expression of EHCC miRNAs in the lentivirus transduced hPHs. (C) MTT assay of hPHs transduced with lentivirus expressing EHCC miRNAs or mock control miRNA. MTT assays were performed one and three days post lentivirus transduction. The absorbance measure at day one was used as baseline. (D) KI67 (red) and Hoechst (blue) stained images of hPHs 7 days post lentivirus transduction. (E) Live/dead stained images of hPHs 7 days post lentivirus transduction. Live cells are visualized by FITC (green), and dead cells are visualized by rhodamine (red). For all statistical analysis, n=3, error bars represent s.e.m., Student’s t-test results are indicated by (*) P<0.05 relative to the control.
EHCC miRNAs Suppress the Translation of CDKN1A, PTEN, TGFBR2 and KLF11
In the proceeding sections (Figs. 1a–e, Tables 1 and 2), we have shown that depleting hESCs and HCCs of miRNAs through a transient knock-down of Dgcr8 leads to severe deficiency in self-renewal and proliferation. In addition, we have also shown that this deficiency is accompanied by the up-regulation of genes possessing GO functional terms describing cell cycle progression, suggesting that self-renewal and proliferation in hESCs and HCCs are promoted by miRNAs suppressing the expression of genes that negatively regulate cell cycle progression. These observations led us to speculate whether a similar mechanism is used by EHCC miRNAs to induce proliferation in hPHs. To determine whether EHCC miRNAs suppress the translation of genes that inhibit cell cycle progression in hPHs, we utilized a miRNA target prediction tool, Target Scan (www.targetscan.org (24)) to identify protein coding genes with 3′UTR containing complementary target sites to EHCC miRNA seed sequences (Fig. 2a). Through this method, we identified 989 genes with 3′UTR regions possessing complementary sites to miRs -106a, -106b, -17 and -93, and 723 genes with complementary sites to miRs -301a and -130b. These gene sets were analyzed for GO functional terms, and the clusters of genes that were categorized under the term describing “negative regulation of cell proliferation” were selected for further analysis (Fig. 4a). Among this list of gene set, seven (Pten, Timp2, Tgfbr2, Klf11, Cdkn1a, Ereg and Runx3) were identified to contain 3′UTR regions with putative target sites to all six EHCC miRNAs. Pten, Tgfbr2, Klf11 and Cdkn1a were then selected as potential targets of EHCC miRNAs, because they are highly expressed in hPHs (Fig. 4b).
Figure 4. EHCC miRNAs directly suppress the translation of Cdkn1a, Pten, Tgfbr2 and Klf11 in hPHs.
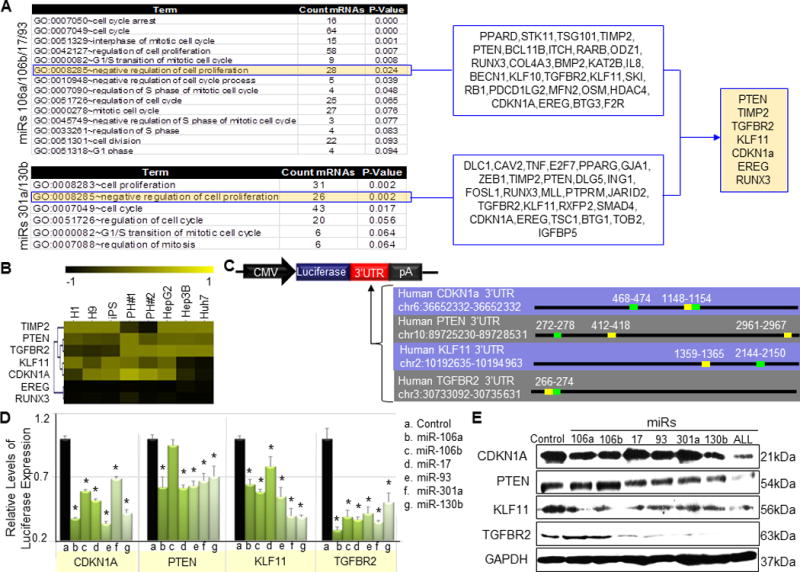
(A) A miRNA target prediction tool, Target Scan, was utilized to identify mRNAs with 3′UTR region predicted to be targeted by either of the two EHCC miRNA seed sequences (Figure 2A). These genes were analyzed for GO terms, and the terms associated with cell cycle regulation are listed in the first column. Among the list of GO terms associated with cell cycle regulation, “negative regulation of cell proliferation” is boxed in blue, and the identity of genes that make up this category are listed in the second column. The last column boxed in blue and filled in orange lists seven genes that are predicted to be targeted by all EHCC miRNAs. (B) The heatmap shows the expression pattern and hierarchical clustering of the seven genes in hESCs, HCCs and hPHs. Among this list of genes, Pten, Tgfbr2, Klf11 and Cdkn1a are highly expressed in hPHs. (C) A map of the luciferase reporter construct. The luciferase reporter construct shows that the 3′UTR (red) elements are inserted immediately downstream of the Firefly luciferase gene (blue), which is under the control of a constitutive CMV promoter (black). Downstream of the MRE (miRNA response element) insert is the polyadenylation signal (pA) (gray). The genomic positions of the 3′UTR regions of Pten, Tgfbr2, Klf11 and Cdkn1a are listed in the table. The table also shows the target sites of miRs -106a, -106b, -17 and -93 in green, and miRs -301a and -130b in yellow. (D) The luciferase reporter constructs with the 3′UTR inserts validate the interaction of the EHCC miRNAs with CDKN1A, TGFBR2 and KLF11. For PTEN, all EHCC miRNAs except miR-106b directly interact with the 3′UTR of this gene. Each luciferase construct was co-tranfected into mESCDgcr88/Dgcr8 with miR mimics or mock miR mimics, and Renilla luciferase construct as a normalization control. The luciferase activity was assayed 36 hours post transfection. For all statistical analyses, n=5, error bars represent s.e.m., Student’s t-test results are indicated by (*) P<0.05 relative to the control. (E) Western blot assay of hPHs that were transduced with lentivirus mediated expression of a mock control miRNA, individual EHCC miRNAs, or all EHCC miRNAs combined. The protein sizes are listed on the far right column.
To test the interaction potential of EHCC miRNAs and the 3′UTRs of Pten, Tgfbr2, Klf11 and Cdkn1a, luciferase reporter constructs were designed by fusing each of the 3′UTR elements immediately downstream of the luciferase reporter gene (Fig. 4c). With the exception of miR-106b and Pten, all EHCC miRNAs significantly reduced luciferase expression (Fig. 4d). Western blot assays of the total protein extracted from hPHs transduced with lentivirus expressing EHCC miRNAs validated the direct translational suppression of Pten, Tgfbr2, Klf11 and Cdkn1a by most of the EHCC miRNAs (Fig. 4e). As observed using the luciferase expression assay, the Western blot assay also showed that miR-106b does not appear to directly suppress PTEN. Unlike the luciferase expression assay however, the Western blot assay did not show a significant of protein expression in the Cdkn1a /miR-17, Cdkn1a /miR-301a, Tgfbr2/miR-106a and Tgfbr2/miR-106b gene/miR combinations compared to the control. This discrepancy between the two method of assay may be attributable to the qualitative nature of the Western blot assay, Not surprisingly, expression of all six EHCC miRNAs combined led to the greatest reduction of PTEN, TGFBR2, KLF11 and CDKN1A endogenous protein levels in hPHs. These findings suggest that one possible mechanism by which EHCC miRNAs induce proliferation in hPHs is by suppressing the translation of genes with GO functional descriptions involving negative regulation of cellular proliferation.
EHCC miRNAs Activate Cancer Signaling Pathways in hPHs
The literature describes PTEN, TGFBR2 and KLF11 as important tumor suppressors that are frequent dysregulated in cancer, and highly correlated with disease progression and prognosis in clinical hepatocellular carcinomas (25–27). We thus asked whether direct translational suppression of Cdkn1a, Pten, Tgfbr2 and Klf11 by EHCC miRNAs may alter the cellular programming to activate cancer signaling pathways. Global gene expression analysis following lentivirus mediated expression of EHCC miRNAs in hPHs revealed only a minor perturbance, with the lowest Pearson correlation coefficient value at r2=0.9440 (Figs S5a–g). Strikingly however, DAVID’s KEGG pathway analysis tool revealed that the functional properties of these small fraction of deregulated genes are frequently implicated in a multitude of cancer pathways(28–30), such as DNA replication, p53, mTOR, TGFβ, as well as various cancer malignancy (e.g., colorectal cancer, prostate cancer, acute myeloid leukemia, renal cell carcinoma, pancreatic cancer) (Tables 3–4 and Supplementary Table S1). Because Pten, Tgfbr2, Klf11 and Cdkn1a have been reported to play pivotal mediatory roles in PTEN/PIP3/PKB/AKT/mTOR and TGFβ tumor suppressor signaling pathways (29, 31), it is possible be that direct translational suppression of these genes by EHCC miRNAs may trigger the dysregulation of these signaling pathways (Fig. 5a). Unlike in hPHs, highly enriched genes in hESCs are not associated with KEGG cancer associated genes (Supplementary Table S2). Moreover, lentivirus mediated expression of EHCC miRNAs in hPHs do not increase the expression of hESC associated genes (e.g., Pou5f1, Nanog, Sox2) nor hepatic progenitor associated genes (e.g., Afp), suggesting that these miRNAs are not capable of reprogramming differentiated hPHs into pluri- or multi-potent stem cell-like state (Figs. 5b and Supplementary Fig. S6). These observations suggest the critical importance of monitoring the loss of EHCC miRNAs in hepatic derivatives of hESCs, because, while these miRNAs are beneficial to hESCs for maintaining “stemness,” their continued expression in hepatic derivatives may render the cells with neoplastic transformation potential.
Table 3. KEGG pathway categories of top 2000 most differentially up-regulated genes.
KEGG pathway categories show known pathways of top 2000 genes that are most differentially up-regulated in hPHs over-expressing EHCC miRNA, relative to the control. Differential values were calculated using the Genome Studio software implementing the Mann-Whitney error model. KEGG pathway descriptions are presented in the left column, and the P values (p) are listed in the right column.
| KEGG Categories | p |
|---|---|
| Lysine degradation | 0.00 |
| Spliceosome | 0.00 |
| Pyruvate metabolism | 0.00 |
| DNA replication | 0.01 |
| Glycolysis / Gluconeogenesis | 0.01 |
| PPAR signaling pathway | 0.01 |
| Fc epsilon RI signaling pathway | 0.02 |
| Mismatch repair | 0.02 |
| mTOR signaling pathway | 0.03 |
| hsa0492Adipocytokine signaling pathway | 0.03 |
| Colorectal cancer | 0.03 |
| Fatty acid metabolism | 0.04 |
| Prostate cancer | 0.05 |
| Acute myeloid leukemia | 0.05 |
| Nucleotide excision repair | 0.06 |
| Insulin signaling pathway | 0.07 |
| Ubiquitin mediated proteolysis | 0.07 |
| Renal cell carcinoma | 0.08 |
| Retinol metabolism | 0.08 |
| Non-small cell lung cancer | 0.08 |
| Pancreatic cancer | 0.09 |
Table 4. KEGG pathway categories of top 2000 most differentially down-regulated genes.
KEGG pathway categories show known pathways of top 2000 genes that are most differentially down-regulated in hPHs over-expressing EHCC miRNA, relative to the control. Differential values were calculated using the Genome Studio software implementing the Mann-Whitney error model. KEGG pathway descriptions are presented in the left column, and the P values (p) are listed in the right column.
| KEGG Categories | p |
|---|---|
| Focal adhesion | 0.00 |
| p53 signaling pathway | 0.00 |
| Ubiquitin mediated proteolysis | 0.00 |
| Endocytosis | 0.00 |
| Pancreatic cancer | 0.00 |
| Renal cell carcinoma | 0.00 |
| Adherens junction | 0.00 |
| Pathways in cancer | 0.00 |
| Oocyte meiosis | 0.00 |
| Insulin signaling pathway | 0.00 |
| Fc gamma R-mediated phagocytosis | 0.01 |
| Epithelial cell signaling in Helicobacter pylori infection | 0.01 |
| Small cell lung cancer | 0.01 |
| Steroid biosynthesis | 0.01 |
| Pathogenic Escherichia coli infection | 0.02 |
| Gap junction | 0.02 |
| Colorectal cancer | 0.02 |
| Non-small cell lung cancer | 0.03 |
| Adipocytokinesignaling pathway | 0.03 |
| Progesterone-mediated oocyte maturation | 0.03 |
| Chemokine signaling pathway | 0.03 |
| Regulation of actin cytoskeleton | 0.03 |
| mTOR signaling pathway | 0.05 |
| ECM-receptor interaction | 0.05 |
| Fatty acid metabolism | 0.05 |
| Cell cycle | 0.05 |
Figure 5. EHCC miRNAs activate cancer signaling pathways and induce EMT in hPHs.
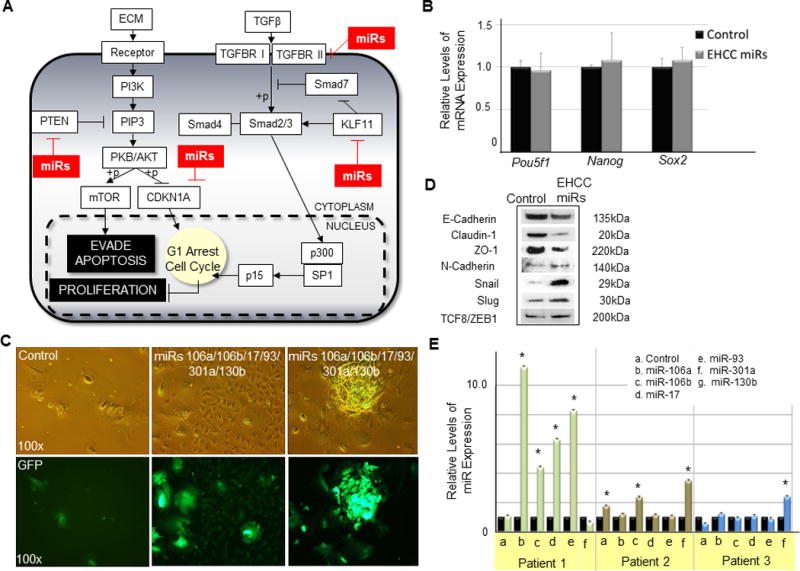
(A) The diagram shows the potential effect of EHCC miRNAs on PTEN and TGFβ signaling pathways. EHCC miRNAs are boxed in red. (B) RT-qPCR analysis of pluripotent ESC markers in hPHs transduced with lentivirus expressing EHCC miRNAs relative to control. (C) Images show hPHs that have been transduced with lentivirus constitutively expressing EHCC miRNAs (miRs 106a/106b/17/93/301a/130b) or a mock control miRNA (control) 17 days after the cells were isolated from the liver. The first column shows hPHs transduced with control miRNAs. The second and third columns show hPHs have been transduced with lentivirus expressing EHCC miRNAs. (D) Western blot assay of hPHs transduced with lentivirus mediated expression of a mock control miRNA, individual EHCC miRNAs, or all EHCC miRNAs combined. The total protein was extracted from hPHs three days after the cells were transduced with lentivirus expressing EHCC miRNAs (Figure S3). Antibodies used for protein detection are reported to be associated with EMT. Protein sizes are listed in the far right column. (E) RT-qPCR analysis of EHCC miRNA expression in human liver tumor samples relative to their normal tissue counterparts. For all statistical analysis, RT-qPCR was performed in triplicates, error bars represent s.e.m., and the Student’s t-test results are indicated by (*) P<0.05 relative to the control.
EHCC miRNAs Induce Epithelial-Mesenchymal Transition in hPHs
To examine the long term effect of EHCC miRNAs on hPHs, the cells were cultured for 15 days following the transduction of lentivirus mediated expression of these miRNAs. At this time point, we observed a significant morphological difference between hPHs that were transduced with lentivirus expressing EHCC miRNAs and mock control miRNAs. Consistent with the literature(2), most hPHs transduced with mock control miRNAs died within several days after the isolation procedure from the liver (Fig. 5c first column). In contrast, the culture condition in which hPHs have been transduced with lentivirus expressing EHCC miRNAs appeared to contain higher number of hepatocytes relative to the control, and a large fraction of these cells appeared to have de-differentiated into fibroblast-like cells having lost cell adhesion and undergoing rapid proliferation (Fig. 5c middle column). In addition, a fraction of these hPHs were observed to have mobilized into clusters of tumor-like spheroids (Fig. 5c last column). Both loss of cell adhesion and increased cell mobility have been described as characteristic features of epithelial-mesenchymal transition (EMT)(32). While EMT has been described as an essential mechanism during numerous developmental processes, induction of EMT has also been implicated in the onset and progression of metastatic cancer cells. In recent years, reports have postulated a link between the activation of PI3K/AKT signaling pathway and the induction of EMT during carcinogenesis(33). Having shown that EHCC miRNAs activate the PI3K/PKB/Akt/mTOR signaling pathway through direct translational suppression of Pten, we sought to examine whether loss of cell adhesion and gain of proliferation and mobilization functions in hPHs expressing EHCC miRNAs may, at least partially, be caused by the induction of EMT. To examine this possibility, we performed western blot analysis on hPHs three days following the transduction of lentivirus mediating the expression of EHCC miRNAs using antibodies to detect EMT. We found that endogenous levels of epithelial cell associated proteins such as E-Cadherin, Claudin-1 and ZO-1 to be generally down-regulated in hPHs expressing EHCC miRNAs relative to control, and up-regulation of several proteins that have been reported to be associated with mesenchymal cells (Fig. 5d). These findings suggest that aberrant expression of EHCC miRNAs in hPHs in vitro may initiate the onset of features described in EMT.
EHCC miRNAs are Up-Regulated in Human Liver Tumor Tissues
Because established cell lines cannot fully infer clinical malignancy, we utilized RT-qPCR to assay for the expression levels of EHCC miRNAs in human liver tumor tissues. In these tissue samples, we found that various combinations of EHCC miRNAs are elevated, relative to their normal tissue counterparts (Fig. 5e). These observations indicate miRNAs that possess a capacity to promote ESC self-renewal are frequently up-regulated in liver cancer, and that proper attenuation of their expression in differentiated hepatocytes may be critical for avoiding harmful consequences for the cell.
Discussion
In this study, we have provided evidence to show that a common network of miRNAs regulates ESC self-renewal, as well as HCC proliferation, and that re-expression of these miRNAs in normally quiescent human primary hepatocytes induces proliferation and activates genes involved in cancer signaling pathways. These findings suggest that miRNAs that play a critical role in normal development as promoters of ESC self-renewal possess neoplastic transformation potential when they escape silencing in hepatic derivatives of hESCs. An examination of perturbed gene expression patterns following the introduction of these miRNAs in hPHs uncovered their involvement as potent inhibitors of tumor suppressors that mediate the repression of the PI3K/PKB/Akt/mTOR and stimulation of the TGFβ signaling pathways. In a multitude of cancer cells, aberrant activation of the PI3K/PKB/Akt/mTOR pathway has been implicated in uncontrolled growth and cell death evasion, while the loss of TGFβ signaling has been observed in cancer cells having lost the ability to initiate cell cycle arrest (29). Furthermore, we showed that aberrant expression of these miRNAs in hPHs leads to EMT, suggesting the potential of these miRNAs to transform normal hepatocytes into neoplastic cells. Taken together, our findings highlight the critical importance of monitoring the silencing of miRNAs that function as promoters of ESC self-renewal in hepatic derivatives of hESCs.
In the model we propose (Fig. 5a), EHCC miRNAs espouse an oncogene-like function in differentiated human primary hepatocytes by directly suppressing the translation of tumor suppressors that regulate cellular proliferation. By suppressing the translation of Tgfbr2 and Klf11, EHCC miRNAs repress the TGFβ signaling pathway. Studies have shown that TGFβ is a multifunctional cytokine which controls a plethora of cellular events, including proliferation, because of its ability to inhibit G1-S phase cell cycle transition through the activation a cell cycle regulating kinases (30) and co-activators (34). Because both TGFBR2 and KLF11 function as positive mediators of the TGFβ signaling pathway, suppressing the translation of these proteins by EHCC miRNAs may lead to the inhibition of TGFβ induced cell cycle arrest (35, 36). In addition to the suppression of the TGFβ signaling pathway, we showed that EHCC miRNAs may control the activation of proliferation in hPHs by activating the PI3K/PKB/Akt/mTOR pathway through direct translational suppression of Pten and Cdkn1a. In many solid tumors, including hepatocellular carcinomas, stimulation of the PI3K/PKB/Akt/mTOR pathway has been described as a major determinant of growth and survival, because of its pivotal role as an enhancer of proliferation and apoptotic resistance (28, 29, 37, 38). Because the PI3K/PKB/Akt/mTOR pathway is negatively regulated by PTEN in normal tissues (39), translational suppression of Pten by EHCC miRNAs may lead to the activation of this signaling pathway in hPHs. Hence, by suppressing key mediators of the TGFβ and the PI3K/PKB/Akt/mTOR signaling pathways, EHCC miRNAs effectively dysregulate these signaling pathways that have been frequently described in the literature to be implicated in cancer (29).
Because EHCC miRNAs directly suppress key tumor suppressor genes in cellular signaling pathways that have been reported in the literature to be implicated in many different types of carcinogenesis, we examined an exemplary sample of published reports to evaluate whether these miRNAs are up-regulated in cancer cell lines and tumor tissues other than HCCs. We found that miR-106a and miR-17 are frequently up-regulated in hematology, colon and melanoma cancer cell lines (40), as well as various types of solid tumors from breast, colon, lung, pancrease and prostate tissues (41). Likewise, miR-106b has been implicated in gastric and prostate carcinoma proliferation (42, 43), miR-301a has been reported as an activator of NF-kB leading to pancreatic tumor growth (44), miR-130b has been identified as an active promoter of liver tumor growth (45), and miR-17-92 cluster has been shown to be overexpressed in various cancer types (46). In view of these reports, perhaps it is not surprising that these miRNAs are highly up-regulated in HCCs, and play an active role as facilitators of proliferation. However, it is striking that not a single report to date has shown that these six miRNAs are also critical for normal development as promoters of hESC self-renewal. Our study has thus shown for the first time that miRNAs that hold an essential for one of the hallmark traits of hESCs are up-regulated in HCCs, and that a failure to silence their expression in normal differentiated quiescent cell type such as hepatocytes may potentially lead to neoplastic transformation.
In summary, our study has shown that tracking the loss of EHCC miRNA expression in hepatic derivatives of hESCs in vitro is critical for assessing the translational potential of hESCs for therapeutic applications. It is likely that miRNAs in addition to the ones described in this study are involved in promoting ESCs self-renewal, while also possessing a capacity for activating cancer signaling pathways in normal hepatocytes. For example, it would be important to examine whether hESC-specific miRNAs such as the miR-302-367 cluster, that we did not find up-regulated in HCC, may also be involved in activating cancer pathways in normal hPHs when they escape silencing. By focusing on miRNAs that are commonly enriched in hESCs and HCCs, we present a rationale and a practical approach, as an example, for determining whether miRNAs that play an essential in normal development as promoters of ESC self-renewal are pervasively up-regulated in liver cancer cells, and whether these miRNAs harbor neoplastic transformation potential when they escape silencing in normally quiescent hepatocytes.
Further studies are needed to examine whether EHCC miRNAs are silenced in hepatic derivatives of hESCs in an in vitro culture system, and also, the tumor forming potential of these cells needs to be evaluated in vivo. These are relevant concerns because markers for fetal rather than mature hepatocytes, such as AFP, that are also highly expressed in HCCs, are persistently expressed in hepatocytes derived from hESCs in an in vitro culture system (4). An in-depth analyses are hampered at present by the lack of experimental strategy for isolating and culturing hepatic derivatives from differentiated hESCs in in vitro culture (2). An efficient method to stably introduce reporter genes in hESCs, and targeted knock-out of individual miRNAs in hESCs would greatly facilitate this endeavor. An enhanced understanding of molecular mechanisms underlying the regulation of ESC self-renewal, as well as cancer cell proliferation, is critical if hESCs are to be used in regenerative medicine. In this study, we have taken a small step in this direction by describing the neoplastic transformation potential of miRNAs that are essential for hESC self-renewal when they escape proper attenuation in quiescent hepatocytes.
Supplementary Material
Acknowledgments
We extend our gratitude to Drs. Janine M. LaSalle, Alice F. Tarantal and Hsien-Jian Kung for their support and mentorship to CJJ. We also thank Kathryn Ivey at the Gladstone institute for reviewing the manuscript, the members of the Farnham and LaSalle laboratories for helpful discussions, and the Liver Tissue Procurement and Distribution System at the University of Pittsburgh for providing hPHs. This work was supported in part by California Institute for Regenerative Medicine (CIRM) Training Grant (TG-00006, CJJ) and a CIRM Comprehensive Research Grant (RC1-00359-1, MAZ).
Footnotes
We do not have any financial, personal, or professional interests that could be construed to have influenced this manuscript.
References
- 1.Thomson JA, Itskovitz-Eldor J, Shapiro SS, Waknitz MA, Swiergiel JJ, Marshall VS, et al. Embryonic stem cell lines derived from human blastocysts. Science. 1998;282:1145–7. doi: 10.1126/science.282.5391.1145. [DOI] [PubMed] [Google Scholar]
- 2.Zaret KS, Grompe M. Generation and regeneration of cells of the liver and pancreas. Science. 2008;322:1490–4. doi: 10.1126/science.1161431. [DOI] [PMC free article] [PubMed] [Google Scholar]
- 3.Hay DC, Zhao D, Fletcher J, Hewitt ZA, McLean D, Urruticoechea-Uriguen A, et al. Efficient differentiation of hepatocytes from human embryonic stem cells exhibiting markers recapitulating liver development in vivo. Stem Cells. 2008;26:894–902. doi: 10.1634/stemcells.2007-0718. [DOI] [PubMed] [Google Scholar]
- 4.Agarwal S, Holton KL, Lanza R. Efficient differentiation of functional hepatocytes from human embryonic stem cells. Stem Cells. 2008;26:1117–27. doi: 10.1634/stemcells.2007-1102. [DOI] [PubMed] [Google Scholar]
- 5.Carson CT, Aigner S, Gage FH. Stem cells: the good, bad and barely in control. Nat Med. 2006;12:1237–8. doi: 10.1038/nm1106-1237. [DOI] [PubMed] [Google Scholar]
- 6.Hochedlinger K, Rideout WM, Kyba M, Daley GQ, Blelloch R, Jaenisch R. Nuclear transplantation, embryonic stem cells and the potential for cell therapy. Hematol J. 2004;5(Suppl 3):S114–7. doi: 10.1038/sj.thj.6200435. [DOI] [PubMed] [Google Scholar]
- 7.Wong DJ, Liu H, Ridky TW, Cassarino D, Segal E, Chang HY. Module map of stem cell genes guides creation of epithelial cancer stem cells. Cell Stem Cell. 2008;2:333–44. doi: 10.1016/j.stem.2008.02.009. [DOI] [PMC free article] [PubMed] [Google Scholar]
- 8.Beachy PA, Karhadkar SS, Berman DM. Tissue repair and stem cell renewal in carcinogenesis. Nature. 2004;432:324–31. doi: 10.1038/nature03100. [DOI] [PubMed] [Google Scholar]
- 9.Clarke MF, Fuller M. Stem cells and cancer: two faces of eve. Cell. 2006;124:1111–5. doi: 10.1016/j.cell.2006.03.011. [DOI] [PubMed] [Google Scholar]
- 10.Reya T, Morrison SJ, Clarke MF, Weissman IL. Stem cells, cancer, and cancer stem cells. Nature. 2001;414:105–11. doi: 10.1038/35102167. [DOI] [PubMed] [Google Scholar]
- 11.Ben-Porath I, Thomson MW, Carey VJ, Ge R, Bell GW, Regev A, et al. An embryonic stem cell-like gene expression signature in poorly differentiated aggressive human tumors. Nat Genet. 2008;40:499–507. doi: 10.1038/ng.127. [DOI] [PMC free article] [PubMed] [Google Scholar]
- 12.Pardal R, Clarke MF, Morrison SJ. Applying the principles of stem-cell biology to cancer. Nat Rev Cancer. 2003;3:895–902. doi: 10.1038/nrc1232. [DOI] [PubMed] [Google Scholar]
- 13.He S, Nakada D, Morrison SJ. Mechanisms of stem cell self-renewal. Annu Rev Cell Dev Biol. 2009;25:377–406. doi: 10.1146/annurev.cellbio.042308.113248. [DOI] [PubMed] [Google Scholar]
- 14.Ambros V. Control of developmental timing in Caenorhabditis elegans. Curr Opin Genet Dev. 2000;10:428–33. doi: 10.1016/s0959-437x(00)00108-8. [DOI] [PubMed] [Google Scholar]
- 15.Reinhart BJ, Slack FJ, Basson M, Pasquinelli AE, Bettinger JC, Rougvie AE, et al. The 21-nucleotide let-7 RNA regulates developmental timing in Caenorhabditis elegans. Nature. 2000;403:901–6. doi: 10.1038/35002607. [DOI] [PubMed] [Google Scholar]
- 16.Wang Y, Baskerville S, Shenoy A, Babiarz JE, Baehner L, Blelloch R. Embryonic stem cell-specific microRNAs regulate the G1-S transition and promote rapid proliferation. Nat Genet. 2008;40:1478–83. doi: 10.1038/ng.250. [DOI] [PMC free article] [PubMed] [Google Scholar]
- 17.Ivey KN, Srivastava D. MicroRNAs as regulators of differentiation and cell fate decisions. Cell Stem Cell. 2010;7:36–41. doi: 10.1016/j.stem.2010.06.012. [DOI] [PubMed] [Google Scholar]
- 18.Garofalo M, Croce CM. microRNAs: Master Regulators as Potential Therapeutics in Cancer. Annu Rev Pharmacol Toxicol. 2010 doi: 10.1146/annurev-pharmtox-010510-100517. [DOI] [PubMed] [Google Scholar]
- 19.Takahashi K, Yamanaka S. Induction of pluripotent stem cells from mouse embryonic and adult fibroblast cultures by defined factors. Cell. 2006;126:663–76. doi: 10.1016/j.cell.2006.07.024. [DOI] [PubMed] [Google Scholar]
- 20.Takahashi K, Okita K, Nakagawa M, Yamanaka S. Induction of pluripotent stem cells from fibroblast cultures. Nat Protoc. 2007;2:3081–9. doi: 10.1038/nprot.2007.418. [DOI] [PubMed] [Google Scholar]
- 21.Xu N, Papagiannakopoulos T, Pan G, Thomson JA, Kosik KS. MicroRNA-145 regulates OCT4, SOX2, and KLF4 and represses pluripotency in human embryonic stem cells. Cell. 2009;137:647–58. doi: 10.1016/j.cell.2009.02.038. [DOI] [PubMed] [Google Scholar]
- 22.Gregory RI, Yan KP, Amuthan G, Chendrimada T, Doratotaj B, Cooch N, et al. The Microprocessor complex mediates the genesis of microRNAs. Nature. 2004;432:235–40. doi: 10.1038/nature03120. [DOI] [PubMed] [Google Scholar]
- 23.Han J, Lee Y, Yeom KH, Kim YK, Jin H, Kim VN. The Drosha-DGCR8 complex in primary microRNA processing. Genes Dev. 2004;18:3016–27. doi: 10.1101/gad.1262504. [DOI] [PMC free article] [PubMed] [Google Scholar]
- 24.Lewis BP, Burge CB, Bartel DP. Conserved seed pairing, often flanked by adenosines, indicates that thousands of human genes are microRNA targets. Cell. 2005;120:15–20. doi: 10.1016/j.cell.2004.12.035. [DOI] [PubMed] [Google Scholar]
- 25.Jia HL, Ye QH, Qin LX, Budhu A, Forgues M, Chen Y, et al. Gene expression profiling reveals potential biomarkers of human hepatocellular carcinoma. Clin Cancer Res. 2007;13:1133–9. doi: 10.1158/1078-0432.CCR-06-1025. [DOI] [PubMed] [Google Scholar]
- 26.Lee JS, Heo J, Libbrecht L, Chu IS, Kaposi-Novak P, Calvisi DF, et al. A novel prognostic subtype of human hepatocellular carcinoma derived from hepatic progenitor cells. Nat Med. 2006;12:410–6. doi: 10.1038/nm1377. [DOI] [PubMed] [Google Scholar]
- 27.Hoshida Y, Villanueva A, Kobayashi M, Peix J, Chiang DY, Camargo A, et al. Gene expression in fixed tissues and outcome in hepatocellular carcinoma. N Engl J Med. 2008;359:1995–2004. doi: 10.1056/NEJMoa0804525. [DOI] [PMC free article] [PubMed] [Google Scholar]
- 28.Sarbassov DD, Ali SM, Sabatini DM. Growing roles for the mTOR pathway. Curr Opin Cell Biol. 2005;17:596–603. doi: 10.1016/j.ceb.2005.09.009. [DOI] [PubMed] [Google Scholar]
- 29.Whittaker S, Marais R, Zhu AX. The role of signaling pathways in the development and treatment of hepatocellular carcinoma. Oncogene. 2009;29:4989–5005. doi: 10.1038/onc.2010.236. [DOI] [PubMed] [Google Scholar]
- 30.Massague J, Blain SW, Lo RS. TGFbeta signaling in growth control, cancer, and heritable disorders. Cell. 2000;103:295–309. doi: 10.1016/s0092-8674(00)00121-5. [DOI] [PubMed] [Google Scholar]
- 31.Ellenrieder V, Buck A, Harth A, Jungert K, Buchholz M, Adler G, et al. KLF11 mediates a critical mechanism in TGF-beta signaling that is inactivated by Erk-MAPK in pancreatic cancer cells. Gastroenterology. 2004;127:607–20. doi: 10.1053/j.gastro.2004.05.018. [DOI] [PubMed] [Google Scholar]
- 32.Kalluri R, Weinberg RA. The basics of epithelial-mesenchymal transition. J Clin Invest. 2009;119:1420–8. doi: 10.1172/JCI39104. [DOI] [PMC free article] [PubMed] [Google Scholar]
- 33.Larue L, Bellacosa A. Epithelial-mesenchymal transition in development and cancer: role of phosphatidylinositol 3′ kinase/AKT pathways. Oncogene. 2005;24:7443–54. doi: 10.1038/sj.onc.1209091. [DOI] [PubMed] [Google Scholar]
- 34.Shen X, Hu PP, Liberati NT, Datto MB, Frederick JP, Wang XF. TGF-beta-induced phosphorylation of Smad3 regulates its interaction with coactivator p300/CREB-binding protein. Mol Biol Cell. 1998;9:3309–19. doi: 10.1091/mbc.9.12.3309. [DOI] [PMC free article] [PubMed] [Google Scholar]
- 35.Markowitz S, Wang J, Myeroff L, Parsons R, Sun L, Lutterbaugh J, et al. Inactivation of the type II TGF-beta receptor in colon cancer cells with microsatellite instability. Science. 1995;268:1336–8. doi: 10.1126/science.7761852. [DOI] [PubMed] [Google Scholar]
- 36.Fernandez-Zapico ME, Mladek A, Ellenrieder V, Folch-Puy E, Miller L, Urrutia R. An mSin3A interaction domain links the transcriptional activity of KLF11 with its role in growth regulation. EMBO J. 2003;22:4748–58. doi: 10.1093/emboj/cdg470. [DOI] [PMC free article] [PubMed] [Google Scholar]
- 37.Wendel HG, De Stanchina E, Fridman JS, Malina A, Ray S, Kogan S, et al. Survival signalling by Akt and eIF4E in oncogenesis and cancer therapy. Nature. 2004;428:332–7. doi: 10.1038/nature02369. [DOI] [PubMed] [Google Scholar]
- 38.Franke TF, Kaplan DR, Cantley LC, Toker A. Direct regulation of the Akt proto-oncogene product by phosphatidylinositol-3,4-bisphosphate. Science. 1997;275:665–8. doi: 10.1126/science.275.5300.665. [DOI] [PubMed] [Google Scholar]
- 39.Salmena L, Carracedo A, Pandolfi PP. Tenets of PTEN tumor suppression. Cell. 2008;133:403–14. doi: 10.1016/j.cell.2008.04.013. [DOI] [PubMed] [Google Scholar]
- 40.Gaur A, Jewell DA, Liang Y, Ridzon D, Moore JH, Chen C, et al. Characterization of microRNA expression levels and their biological correlates in human cancer cell lines. Cancer Res. 2007;67:2456–68. doi: 10.1158/0008-5472.CAN-06-2698. [DOI] [PubMed] [Google Scholar]
- 41.Volinia S, Calin GA, Liu CG, Ambs S, Cimmino A, Petrocca F, et al. A microRNA expression signature of human solid tumors defines cancer gene targets. Proc Natl Acad Sci U S A. 2006;103:2257–61. doi: 10.1073/pnas.0510565103. [DOI] [PMC free article] [PubMed] [Google Scholar]
- 42.Cai K, Wang Y, Bao X. MiR-106b promotes cell proliferation via targeting RB in laryngeal carcinoma. J Exp Clin Cancer Res. 2011;30:73. doi: 10.1186/1756-9966-30-73. [DOI] [PMC free article] [PubMed] [Google Scholar]
- 43.Poliseno L, Salmena L, Riccardi L, Fornari A, Song MS, Hobbs RM, et al. Identification of the miR-106b~25 microRNA cluster as a proto-oncogenic PTEN-targeting intron that cooperates with its host gene MCM7 in transformation. Sci Signal. 2010;3:ra29. doi: 10.1126/scisignal.2000594. [DOI] [PMC free article] [PubMed] [Google Scholar]
- 44.Lu Z, Li Y, Takwi A, Li B, Zhang J, Conklin DJ, et al. miR-301a as an NF-kappaB activator in pancreatic cancer cells. EMBO J. 2011;30:57–67. doi: 10.1038/emboj.2010.296. [DOI] [PMC free article] [PubMed] [Google Scholar]
- 45.Ma S, Tang KH, Chan YP, Lee TK, Kwan PS, Castilho A, et al. miR-130b Promotes CD133(+) liver tumor-initiating cell growth and self-renewal via tumor protein 53-induced nuclear protein 1. Cell Stem Cell. 2010;7:694–707. doi: 10.1016/j.stem.2010.11.010. [DOI] [PubMed] [Google Scholar]
- 46.Hayashita Y, Osada H, Tatematsu Y, Yamada H, Yanagisawa K, Tomida S, et al. A polycistronic microRNA cluster, miR-17-92, is overexpressed in human lung cancers and enhances cell proliferation. Cancer Res. 2005;65:9628–32. doi: 10.1158/0008-5472.CAN-05-2352. [DOI] [PubMed] [Google Scholar]
Associated Data
This section collects any data citations, data availability statements, or supplementary materials included in this article.