

Abstract
Dopamine D1-like receptors (D1R and D5R) stimulate adenylyl cyclase (AC) activity, whereas the D2-like receptors (D2, D3 and D4) inhibit AC activity. D1R, but not the D5R, has been reported to regulate AC activity in lipid rafts (LRs). We tested the hypothesis that D1R and D5R differentially regulate AC activity in LRs using human embryonic kidney (HEK) 293 cells heterologously expressing human D1 or D5 receptor (HEK-hD1R or HEK-hD5R) and human renal proximal tubule (hRPT) cells that endogenously express D1R and D5R. Of the AC isoforms expressed in HEK and hRPT cells (AC3, AC5, AC6, AC7, and AC9), AC5/6 was distributed to a greater extent in LRs than non-LRs in HEK-hD1R (84.5±2.3% of total), HEK-hD5R (68.9±3.1% of total), and hRPT cells (66.6±2.2 % of total) (P<0.05, n=4/group). In HEK-hD1R cells, the D1-like receptor agonist fenoldopam (1μM/15 min) increased AC5/6 protein (+17.2±3.9 % of control) in LRs but decreased it in non-LRs (-47.3±5.3 % of control) (P<0.05, vs. control, n=4/group). By contrast, in HEK-hD5R cells, fenoldopam increased AC5/6 protein in non-LRs (+67.1±5.3% of control, P<0.006, vs. control, n=4) but had no effect in LRs. In hRPT cells, fenoldopam increased AC5/6 in LRs but had little effect in non-LRs. Disruption of LRs with methyl-β-cyclodextrin decreased basal AC activity in HEK-D1R (-94.5±2.0 % of control) and HEK-D5R cells (-87.1±4.6 % of control) but increased it in hRPT cells (6.8±0.5-fold). AC6 activity was stimulated to a greater extent by D1R than D5R, in agreement with the greater colocalization of AC5/6 with D1R than D5R in LRs. We conclude that LRs are essential not only for the proper membrane distribution and maintenance of AC5/6 activity but also the regulation of D1R- and D5R-mediated AC signaling.
Keywords: Adenylyl cyclase, dopamine receptor, lipid rafts, signal transduction
1. Introduction
Adenylyl cyclases (ACs) catalyze the conversion of intracellular ATP to adenosine 3, 5-cyclic monophosphate (cAMP) which mediates the actions of many hormones and neurotransmitters (1-4). To date, 10 mammalian ACs have been cloned and characterized (3, 5). They are grouped into 4 major subfamilies: group 1 is comprised of Ca2+-stimulated AC1, AC3, and AC8; group 2 is comprised of Gβγ-stimulated AC2, AC4, and AC7; group 3 is comprised of Ca2+ -inhibited AC5 and AC6; and group 4 has one member, forskolin-insensitive AC9 (3-5). All of these nine ACs are stimulated by the GTP-bound α subunit of G protein (3, 5). G protein-coupled receptors (GPCRs) regulate AC activity through G protein subunits (6-9). However, the tenth AC, a splice variant in the testis (sAC), lacks a membrane spanning domain and is stimulated by calcium but not by G proteins (3, 5). Each AC isoform has a specific pattern of tissue/organ distribution and a specific pattern of regulation by G proteins, calcium/calmodulin, and protein kinases (1-5).
Dopamine receptors are classically divided into two groups: D1- and D2-like receptors, based on their interaction with AC (6-8). The D1-like receptors comprised of the D1R and D5R receptor subtypes stimulate AC through Gαs whereas the D2-like receptors comprised of the D2, D3, and D4 receptor subtypes inhibit AC (7, 8). We have reported that all AC mRNAs and proteins are found in the rat kidney except AC1 and AC8. AC isoforms 2, 3, 6, 7, and 9 are expressed in rat renal proximal tubules (9). These AC isoforms plus AC4 and AC5 are also expressed in the mouse and rat renal collecting duct (10, 11).
The human D1R (hD1R), as with other GPCRs and ACs, are regulated by lipid rafts and caveolae (12-24). Lipid rafts are dynamic structures, rich in cholesterol and sphingolipids that are important in organizing signal transduction cascades. Caveolae are a subset of lipid rafts characterized by their invaginated morphology, formed by the crosslinking of their characteristic marker protein, caveolin-1 (Cav-1) (3, 13, 14). Ca2+-sensitive ACs (AC1, AC3, AC5, AC6, and AC8) are found in lipid rafts, while Ca2+-insensitive ACs (AC2, AC4, and AC7) are found in non-lipid rafts (4, 14). The association of GPCRs with specific AC isoforms has been reported. AC5 and AC6 are associated with: β2 adrenergic receptors (β2AR) in lipid rafts in cardiac, vascular, and bronchial smooth muscle cells (16-18); nicotinic acetylcholine receptor (nAChR) in lipid rafts in pheochromocytoma cells (PC12 cells) (19, 20); and μ- but not δ-opioid receptor in lipid rafts in human embryonic (HEK) cells (23). Toll-like receptor 4 is associated with AC6 in lipid rafts in a murine macrophage cell line (24), while stomatin-related olfactory protein and AC3 are found in lipid rafts in olfactory cilia (22). By contrast, AC2 and E prostanoid type 2 receptors are found in non-lipid rafts in mouse bronchial smooth muscle cells (21).
The association of D1R and AC5/6 in several cells, including HEK-293 cells, has been reported (12, 25). However, the AC isoform associated with D5R has not been established. In the current study, we investigated whether or not specific AC isoforms are differentially regulated by hD1R and hD5R in lipid rafts in HEK-293 cells heterologously expressing either hD1R (HEK- hD1R) or hD5R (HEK- hD5R) and in human renal proximal tubule (hRPT) cells endogenously expressing D1R and D5R. Our data indicated that AC 5/6 was differentially distributed in lipid rafts in these renal epithelial cells and their integration in membrane microdomains is important in maintaining basal AC activity and dopamine receptor-mediated signaling.
2. Methods
2.1 Cell treatment
Well-characterized HEK-hD1R, HEK-hD5R, and hRPT cells were used (12, 26-30). The cells, pre-starved in serum-free αMEM medium (SFM) for 1hr, were grown in 100 cm dishes to 90% confluence. The cells were treated for 15 min at 37°C with vehicle, D1-like receptor agonist fenoldopam (1.0 μmol/L), D1-like receptor antagonist SCH23390 (5.0 μmol/L) alone, or combination of fenoldopam and SCH23390 (SCH23390 added to the cells 5 min prior to the addition of fenoldopam). To disrupt the lipid rafts, the cholesterol depleting reagent methyl-β-cyclodextrin (βCD) was used. The cells were washed once with SFM and then incubated with vehicle or βCD (2%/ 1 h) at 37°C in SFM (27). Cholesterol repletion was performed by incubating the cells in a pre-mixed solution containing cholesterol (stock solution in 100% ethanol at 50 mg/ml), 100 μg/ml, and βCD (2%). The cells were also treated with drug combinations: βCD+fenoldopam (βCD added to the cells 1 h prior to the addition of fenoldopam); βCD+cholesterol (mixture added to cells 1 h prior to addition of fenoldopam); and βCD+cholesterol+fenoldopam (βCD+cholesterol mixture added 1 h prior to addition of fenoldopam).
2.2 Cell transfection
HEK-hD1R, HEK-hD5R, and hRPT cells were transfected with vehiclethat contained only the transfection reagent and served as control (Con), non-silencingmock-siRNA that consisted of a scrambled sequence and served as another negativecontrol, or siRNA that was specific for a particular AC isoform (AC isoform-siRNA), as described previously (27). The cells were seeded in 6-wellplates at a density of 5×10⁵/well at day 1 and then transfected with mock-siRNA, or AC isoform-specific-siRNA at day 2. AC protein and AC activity were determined at day 4. To measure AC activity, the cells were seeded in 12-well plates at a density of 2×10⁵/well at day 1, followed by transfection with AC isoform-specific-siRNA at day 2; cAMP concentration was measured at day 4 using a cAMP direct immunoassay kit.
2.3 Subcellular fractionation
To prepare lipid and non-lipid rafts, the cells, pre-treated with vehicle (control), fenoldopam (1 μmol/L, 15 min), or βCD 2% at 37°C, were subjected to sucrose density gradient centrifugation, using a detergent-free protocol, as described previously (12, 27).
2.4 Measurement of cAMP accumulation
To measure cAMP accumulation the samples were prepared as described previously (12, 28). HEK-hD1R, HEK-hD5R, or hRPT cells were seeded into 12-well plates (2×10⁵ cells/well) in complete culture medium. When the cells had grown to 90% confluence, they were incubated for 20 min at 37°C with (0.2 ml/well) MHI medium [αMEM serum-free medium, HEPES (10 mmol/L), isobutylmethylxanthine (IBMX, 1mmol/L), and ascorbic acid (100 μmol/L)]. The cells were then treated with vehicle (MHI medium) or fenoldopam (1 μmol/L) and other drugs diluted in MHI medium (vehicle or drug volume=50μl/well) for 10 min at 37°C. The reactions were stopped by adding 0.25 ml of 0.2N HCl to each well. The cells, collected by scrapping, were transferred into labeled microcentrifuge tubes and centrifuged at 2000 x g for 5 min. The supernatants were obtained and cAMP was measured using a cAMP immunoassay kit, and expressed as pmol/mg protein/min which was later converted to % change of control.
2.5 Co-immunoprecipitation and immunoblotting
To determine the association of D1R or D5R with specific AC isoforms, co-immunoprecipitation experiments were performed, as described previously (12). HEK-hD1R and HEK-hD5R cells were treated with vehicle, fenoldopam (1 μmol/L), SCH23990 (5 μmol/L, added 5 min prior to the addition of fenoldopam), or the combination of fenoldopam and SCH23390 for 10 min. The cells were lysed in MBST buffer and equal amounts of cell lysate proteins (500 μg) were mixed with a polyclonal anti-AC5/6 antibody and incubated at 4 °C overnight. Protein A/G beads (30 μl) were added to each sample with rocking for 2 h at 4°C on the next day. The immune complexes were washed 3X with cold PBS. The bound proteins were eluted by the addition of Laemmli buffer (20 μl) and boiled for 5 min. The samples were subjected to immunoblotting with mouse monoclonal anti-Myc (for hD1R) or anti-V5 (for hD5R) antibodies, as indicated. Normal rabbit IgG was used as a negative control. The immunoreactive bands were semi-quantified by densitometry (12, 27).
2.6 Statistical analysis
Data are expressed as Mean ± standard error (SEM). Significant differences between two groups were determined by Student's t-test Significant differences among more than 2 groups were determined by one-way factorial ANOVA, followed by Tukey post-hoc test; P<0.05 was considered significant.
3. Results
3.1 AC isoform mRNA profile in human kidney cells
The first aim of our studies was to determine the endogenous mRNA expression of AC isoforms in untransfected HEK-293 and hRPT cells using the primers listed in Table S1. We found that AC3, AC5, AC6, AC7 and AC9 mRNA were expressed in HEK-293 and hRPT cells (Figure 1). The endogenous expression of AC2, AC4, AC5/6, and AC9 has been reported in some but not all HEK-293 cell lines (31, 32). Sequencing of the mRNA products confirmed the identity of these AC isoforms (Table S2), except for AC2 and AC4. Band B under AC2 mRNA (Figure 1) was chromodomain helicase DNA binding protein 8. The apparent expression of AC4 mRNA in HEK-293 cells was not confirmed by sequencing because it was not expressed in hRPT cells. AC8 mRNAs was not found in either human kidney cell line (HEK293 and hRPT). The AC mRNA profile in hRPT cells differed from rat RPT cells, which expressed AC2 in addition to AC3, AC6, AC7, and AC9; AC5 was found in hRPT but not rat RPT cells (9, 33), indicating species specificity; AC8 mRNA was not found in either human or rat RPT cells but may be minimally expressed in HEK cells. AC1 gene expression was not studied in human renal epithelial cells because this gene is expressed mainly in brain (4).
Figure 1. mRNA profiles of adenylyl cyclase (AC) isoforms in human kidney cells.

mRNA was extracted from untransfected HEK-293 and hRPT cells from normotensive subjects using the RNeasy RNA Extraction Kit (Qiagen). RT-PCR was performed, as described previously (9). The sets of primers (A and B) used for human AC isoform mRNA detection are shown in Table S1, supplementary file.
3.2 Distribution of AC isoforms in lipid and non-lipid raft microdomains
HEK-hD1R, HEK-hD5R, and hRPT cells have been characterized in ourprevious reports (12, 26-30). We now report the distribution of AC isoform proteins in lipid and non-lipid rafts, using sucrose gradient fractionation samples from these cells. Among the AC isoforms only AC5/6 protein (using an antibody that recognizes both AC5 and AC6) was expressed mainly in lipid rafts in these kidney cells, in agreement with previous reports (13, 14, 16, 17, 23) (Figures 2A and 2B, upper panels). In the basal state, more AC5/6 was distributed in lipid rafts than in non-lipid rafts and to a greater extent in HEK-hD1R cells (84.5±2.3 % of total density units, DU) than HEK-hD5R cells (69±3.1 % total DU) (P<0.05, n=4, ANOVA) (Figure 2A). In HEK-hD1R cells, AC5/6 was concentrated in lipid raft fraction 4 but, in HEK-hD5R cells, AC5/6 was distributed in fractions 3-6 in lipid rafts and fractions 7 and 8 in non-lipid rafts, indicating that the concomitant expression of a specific receptor may alter AC localization in membrane microdomains. In hRPT cells, basal AC5/6 protein profile was similar to that observed in HEK-hD1R cells, in which AC5/6 was mainly concentrated in lipid raft fraction 4 (66.6±2.2 % total DU) (Figure 2B). In HEK-hD1R cells, fenoldopam increased AC5/6 in lipid raft fractions 3 and 4 (+17.2±3.9 % change from control) and decreased AC5/6 in non-lipid rafts (-47.3±5.3 % change from control) (P<0.05, n=4, ANOVA) (Figure 2A). By contrast, in HEK-hD5R cells, fenoldopam had little effect on AC5/6 in lipid rafts (-6.3±1.7 % change from control) but increased the expression of AC5/6 in non-lipid raft fractions 8 and 9 (+67.1±20.5 % from control, P<0.05, n=4) (Figure 2A). In hRPT cells, fenoldopam increased AC5/6 protein in lipid rafts in fractions 4 and 5 (*P<0.05, n=5, ANOVA) but had little effect on AC5/6 expression in non-lipid rafts (+14.9±13.5 % of control) (Figure 2B), which seems to be the algebraic sum of that found in HEK-hD1R and HEK-hD5R cells.
Figure 2. Distribution of adenylyl cyclase (AC) isoforms in lipid (LRs) and non-lipid rafts (non-LRs).
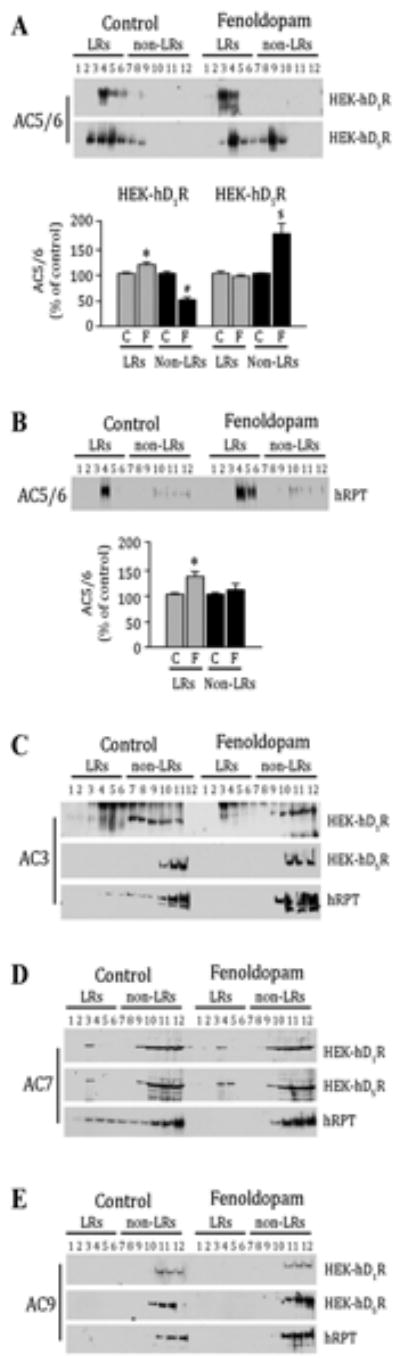
A-B. HEK-hD1R, HEK-hD5R, and hRPT cells were treated with vehicle (Control, C) or fenoldopam (F, 1 μmol/L) for 15 min. The cell lysates were then subjected to sucrose gradient centrifugation. Proteins (20 μl/lane) from sucrose gradient fractions (from 2 to 12 fractions) were immunoblotted with the antibodies against AC5/6. The immunoblot from one of 4-5 separate experiments is shown (upper panel). The immunoreactive bands for AC5/6 were semi-quantified as described previously (12, 27). The results are expressed as % of control for HEK-D1R and HEK-D5R cells in Figure 2A (lower panel) and for hRPT cells in Figure 2B (lower panel). Values are Mean ± SEM (n=4-5/group).
A: *P<0.01 and #P<0.001 vs. others in HEK-hD1R cells, $P<0.006 vs. others in HEK-hD5R cells, n4=/group, one-way factorial ANOVA, Tukey post-hoc test.
B: *P<0.05, vs others, n=5, one-way factorial ANOVA, Tukey post-hoc test.
C-E. Proteins (20 μl/lane) from sucrose gradient fractions (from 2 to 12 fractions) were immunoblotted with the antibodies against AC3 (Figure 2C), AC7 (Figure 2D), and AC9 (Figure 2E)
AC3 protein was also present in lipid and non-lipid rafts in HEK-hD1R, in agreement with previous reports (13, 14, 23), and hRPT cells, but present only non-lipid rafts in HEK-hD5R cells, supporting the aforementioned notion that the concomitant expression of a specific receptor may alter AC localization in membrane microdomains. Fenoldopam decreased AC3 protein in lipid rafts in HEK-hD1R and hRPT cells but had no effect in HEK-hD5R cells (Figure 2C).
AC7 protein was expressed mainly in non-lipid rafts and minimally expressed in lipid rafts in both HEK- hD1R (12.1± 0.8 %) and HEK-hD5R cells (13.3±4.1% of total DU) but was diffusely distributed in lipid rafts (fractions 3-6) (29.4±5.4 % total DU) and non-lipid rafts (fractions 7-12) in hRPT cells (Figure 2D). Fenoldopam had little or no effect on AC7 protein in HEK-hD1R and HEK- hD5R cells but shifted all of AC7 in lipid rafts to non-lipid rafts in hRPT cells.
AC9 was found mainly in non-lipid rafts and its membrane distribution was not affected by fenoldopam in HEK-hD1R, HEKhD5R, and hRPT cells (Figure 2E). The finding that the AC7 and AC9 distributions in lipid and non-lipid rafts and response to fenoldopam are similar in both HEK-hD1R and HEK-hD5R cells, unlike that found for AC3 and AC5/6, indicate that the concomitant expression and response to agonist stimulation of a specific GPCR, D1R and D5R in this instance, is isoform-specific.
3.3 Effect of βCD on AC5/6 distribution
βCD, a cholesterol-depleting reagent, has been used to determine the effect of disruption of lipid rafts on the distribution of proteins in cell membranes (16-20, 23). The cells were treated with βCD (2%) at 37°C for 1hr, and the lysates were subjected to sucrose gradient centrifugation as in previous experiments (12, 27) (Figure 3A). Similar to those shown in Figure 2B, in the basal state, AC5/6 was distributed to a greater extent in lipid than non-lipid rafts in HEK-hD1R and hRPT cells, while in HEK-hD5R cells AC5/6 was distributed in fractions 3-6 in lipid rafts and fractions 7-9 in non-lipid rafts (Figure 3A). In HEK-hD1R and HEK-hD5R cells, βCD did not alter the membrane distribution of AC5/6 but decreased the molecular size of AC5/6 in lipid rafts in HEK-hD1R cells, indicating that the presence of a particular protein in the more buoyant sucrose gradient fractions does not necessarily indicate presence in lipid rafts. By contrast, βCD shifted all AC5/6 to non-lipid rafts in hRPT cells.
Figure 3. Effect of methyl-β-cyclodextrin (βCD) on the distribution of AC5/6.
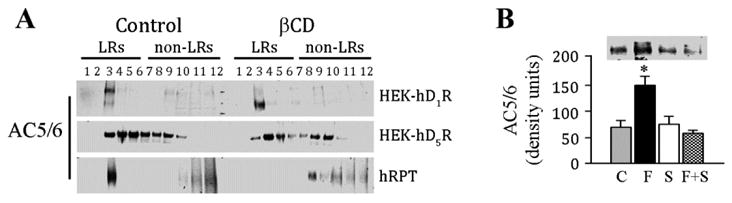
A. Cells from HEK-hD1R, HEK-hD5R, and hRPT were treated with vehicle (Control) or βCD (27%) for 1hr at 37°C. The cell lysates were then subjected to sucrose gradient centrifugation and the proteins (20µl/lane) from the sucrose gradient fractions (form 2 to 12 fractions) were immunoblotted with AC5/6 antibody. The distribution of AC5/6 in lipid rafts (LRs) and nonlipid rafts (non-LRs) is shown. n=3/group
B. The lipid raft marker caveolin 1 (Cav-1) co-immunoprecipitates with AC5/6 in hRPT cells
hRPT cells were grown to 90% confluence and then treated with vehicle (Control, C), fenoldopam (F, 1μmol/L), or SCH23390 (S) (5 μmol/L), or a combination of fenoldopam and SCH23390 (F+S). The cell lysates were immunoprecipitated with a polyclonal anti-Cav-1 antibody. Proteins from immunocomplexes were probed with a polyclonal anti-AC5/6 antibody. The immunoreactive bands were semi-quantified. Values are Mean ± SEM (n=4/group).
*P<0.05, vs. all others, one-way factorial ANOVA, Tukey post-hoc test. One immunoblot is shown.
To determine if the change in molecular size of AC5/6 in HEK-hD1R cells caused by βCD was related to deglycosylation, the cell lysates were incubated with N (PNG-F)-glycanase, O-glycanase, or sialidase and then probed with specific polyclonal anti-AC5/6 antibodies. The molecular size of AC5/6 in vehicle-treated cells was 160 kDa and was not affected by PNG-F alone but decreased to 120 kDa following treatment with the combination of PNG-F, O-glycanase, and sialidase A (Figure S1). Therefore, disruption of lipid rafts with βCD may cause AC5/6 deglycosylation in HEK-hD1R cells.
We also studied the association of Cav-1, a lipid raft marker protein, with AC5/6 in hRPT cells; similar studies in HEK cells were not performed because Cav-1 is not expressed in some HEK-293 cells, including ours (12, 16, 34, 35), although it may be present in other HEK-293 cell lines (33), albeit minimally (36). In hRPT cells, the D1-like receptor agonist fenoldopam increased the association of AC5/6 protein with Cav-1 (147.5±17.2 DU vs. control 70.3±12.6 DU) (P<0.05, n=4, ANOVA) (Figure 3B), supporting the finding that fenoldopam increased AC5/6 protein in lipid rafts (Figure 2A). Cav-1 has been reported in hRPT cells (27, 29) which can form caveolar membranes (14, 17). The stimulatory effect of fenoldopam was blocked by the D1-like receptor antagonist Sch23390, indicating specific effect on D1-like receptors.
3.4 Association of AC isoforms with specific dopamine receptor subtypes
The GPCR coupling to specific AC isoforms has been reported (16-24). We, therefore, determined if D1R and D5R colocalize with AC5/6 (Figure 4A). Fenoldopam promoted the co-localization of hD1R with AC5/6 and stimulated cAMP accumulation in HEK-hD1R cells at 15 min that became markedly attenuated at 60 min. Fenoldopam also promoted the co-localization of D5R with AC5/6 and cAMP production in HEK-hD5R cells but to a lesser degree than that observed for hD1R in HEK-hD1R cells.
Figure 4. D1R and D5R association with AC isoforms.
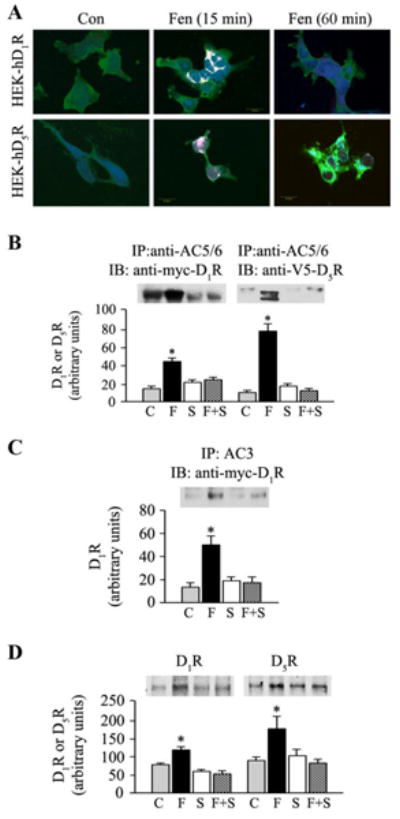
A. Co-localization of hD1R or hD5R with AC5/6 and cAMP in HEK-hD1R and HEK-D5R cells. HEK-hD1R and HEK-hD5R cells, grown on coverslips, were treated with vehicle (Control) or fenoldopam (Fen, 1μmol/L) for 15 or 60 min. The cells were then washed, fixed, and triple immunofluorescence staining was performed. Fluorescence images were obtained using laser confocal scanning microscopy (Olympus Fluoview FV600) at excitation and emission wavelengths of 495/519, 579/603 and 632/648 nm. Myc-tagged D1R or V5-tagged D5R, green; AC5/6, blue; cAMP, red; Scale bar=20 μm.
B-C. The interaction of D1R and D5R with AC5/6 or with AC3
HEK-hD1R and HEK-hD5R cells were treated for 15 min at 37°C with vehicle (Control, C), fenoldopam (Fen, 1μmol/L), SCH23390 (S) (5 μmol/L), or combination of Fen and SCH23390 (F+S). Cell lysates were immunoprecipitated with specific polyclonal anti-AC5/6 antibody (Figure 4B) or anti-AC3 antibody (Figure 4C). Proteins were eluted from the immunocomplexes and probed with anti-Myc- (D1R) (Figures 4B and 4C) or anti-V5- (D5R) (Figure 4B) tagged antibodies. The immunoreactive bands were semi-quantified. Values are Mean ± SEM (n=4-6/group: *P<0.006 vs. all others, one-way factorial ANOVA, Tukey post-hoc test. One immunoblot is shown.
D. The interaction of D1R or D5R with AC5/6 in hRPT cells. hRPT cells were treated for 15 min at 37°C with vehicle (Control, C), fenoldopam (F, 1μmol/L), SCH23390 (S) (5umol/L), or combination (F+S) as in Figures 4B and 4C. Cell lysates were immunoprecipitated with polyclonal anti-AC5/6 antibody and proteins from immunocomplexes were probed with polyclonal rabbit anti-D1R and -D5R antibodies. The immunoreactive bands were semi-quantified. Values are Mean+SEM (n=6/group). *P<0.05, vs. all others, in AC5/6-D1R or AC5/6-D5R, one-way factorial ANOVA, Tukey post-hoc test. One immunoblot for D1R or D5R is shown.
The D1-like receptor agonist fenoldopam promoted the interaction of75-kDa-D1R with AC5/6 (41.9 ± 4.1 vs. control 15.1 ± 3.5 DU)(P<0.006, n=4, ANOVA) in HEK-hD1R cells (Figure 4B, left graph), while the 45-kDa- but not the 60-kDa-D5R interacted with AC5/6 (76.2 ± 9.7 DU vs. control 12.0±2.1 DU) (P<0.005, n=4, ANOVA) in HEK-hD5R cells (Figure 4B, right graph). In addition, D1R interacted with AC3 (Figure 4C); D5R did not interact with AC3 in HEK-D5R cells (Figure S2, supplementary file), in agreement with the inability of fenoldopam to alter the non-lipid raft distribution of AC3 in HEK-hD5R cells. The interaction of hD1R and hD5R with AC5/6 and interaction of D1R with AC3 were prevented by the D1-like receptor antagonist SCH23990, indicating that the interaction was specific to D1R and D5R (Figures 4B and 4C). There was interaction between AC4 and D1R and AC4 and D5R (Figure S3, supplementary file). However, the association of D5R but not D1R with AC4 was reversed by the D1-like receptor antagonist SCH23990. We also found that D1R interacted with AC9 (Figure S4, supplementary file), but the interaction was not specific to D1R because the D1R-AC9 interaction was not prevented by the D1-like receptor antagonist SCH23990 (data not shown). Neither D1R nor D5R interacted with AC7 (Figure S4, supplementary file), in agreement with the inability of fenoldopam to alter the lipid and non-lipid raft distribution of AC7.
hRPT cells endogenously express D1R and D5R (27-30). Therefore, co-immunoprecipitation studies were also performed in hRPT cells to determine whether or not AC5/6 protein could associate with endogenously expressed D1R and D5R. In agreement with studies in heterologously expressed D1R (HEK-hD1R) and D5R (HEK-hD5R), fenoldopam promoted the co-immunoprecipitation of endogenous AC5/6 with endogenous D1R (110.1±9.9 DU vs. control 77.2±4.2 DU) and D5R (182.4±31.4 DU vs. control 96.7±3.6 DU) (P<0.05, n=5-6, one-way ANOVA) (Figure 4D); control D5R was designated as the control for all the experiments in Figure 4.
3.5 Differential effects of βCD on AC activity in kidney cells
cAMP accumulation was measured in whole cell lysates following drug treatment. Basal cAMP accumulation was greater in HEK-hD5R cells (120±11 pmol/mg protein/min) than HEK-hD1R cells (71±4 pmol/mg protein/min) (P<0.003, n=4, ANOVA). Fenoldopam markedly increased cAMP accumulation in both cell lines (Figure 5A and Table 1). However, the percent (not absolute) response to fenoldopam was greater in D1R (183±22 % of control=100±4.0) than D5R (140±4.8 % of control=100±3.0). Disruption of lipid rafts with βCD decreased basal and fenoldopam-stimulated AC activity by 90 % in both cell lines (4±1.6 pmol/mg protein/min in HEK-hD1R cells and to 15±4.6 pmol/mg protein/min in HEK-hD5R cells), indicating that lipid rafts keep the AC enzyme in an active state in HEK-293 cells. Cholesterol repletion partially restored AC activity but at levels that were still below control levels (32.4±7.0 pmol/mg protein/min, HEK-hD1R and 39.1±7.7 pmol/mg protein/min, HEK-hD5R cells, vs. βCD treatment and control) (P<0.05, ANOVA). AC accumulation was also measured in lipid and, non-lipid rafts following drug treatment and sucrose gradient centrifugation. Fenoldopam markedly increased AC activity in lipid rafts in HEK-hD1R (Figure 5B) and HEK-hD5R (Figure 5C). The increase in AC activity occurred mainly in lipid rafts in HEK-hD1R cells similar to our previous report (12). AC activity in response to fenoldopam was greater in HEK-hD1R (512±47 pmol/mg/min) than HEK-hD5R cells (132±9.1 pmol/mg/min). However, AC activity was greater in non-lipid rafts in HEK-hD5R than HEK-hD1R cells.
Figure 5. Effect of fenoldopam and methyl-β-cyclodextrin (βCD) on cAMP accumulation.
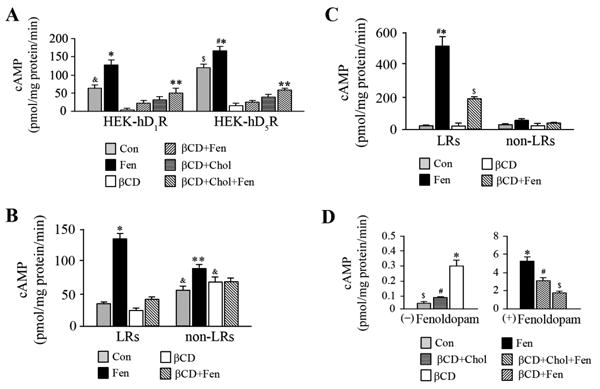
A. Effect of fenoldopam and βCD on cAMP accumulation in whole cells
HEK-hD1R and HEK-hD5R cells were seeded in 12-well plates at5×105cells/well. The cells, pretreated for 1 h at 37°C with vehicle (control, Con), βCD (2%), or cholesterol (Chol, 100 μg/ml) plus βCD (βCD+Chol), were treated for 10 min at 37°C with vehicle (Con) or fenoldopam (Fen, 1μmol/L) or in combination (βCD+Fen, βCD+Chol+Fen). The cells were lysed in 0.1N HCL as described in “Methods”. cAMP accumulation was measured in each well using a cAMP assay kit and expressed as pmol/mg protein/min. Values are Mean ± SEM (n = 4/group). *P<0.001 vs. all others in HEK-hD1R or HEK-hD5R, respectively, #P<0.05 vs. Fen-D1R, &P<0.05 vs. βCD, βCD+Fen, and βCD+Chol in HEK-hD1R cells, $P<0.003 vs. Con-HEK-hD5R and βCD, βCD+Fen, βCD+Chol, and βCD+Chol+Fen in HEK-hD5R cells, **P<0.05, vs. βCD in HEK-hD1R or HEK-hD5R, n=4/group, one-way factorial ANOVA, Tukey post-hoc test.
B-C. Effect of fenoldopam and methyl- β-cyclodextrin (βCD) on cAMP accumulation in LRs and non-LRs
HEK-hD1R (B) and HEK-hD5R (C) cells, grown in 150-mm dishes, pre-treated with vehicle (Control) or βCD (2%) for 45 min at 37°C, were then treated with vehicle or fenoldopam (Fen, 1 μmol/L), or βCD +Fen for 15 min (total 1h). The cell lysates were then subjected to sucrose gradient centrifugation as described in “Methods” (12, 27). Cell fractions 2-6 and 7-12 were combined as LR (fractions 2-6) and non-LR (fractions 7-12) fractions and cAMP accumulation was measured using a cAMP assay kit and expressed as pmol/mg protein/min. Values are Mean ± SEM (n = 4/group). *P< 0.001, vs. others in HEK-hD1R or HEK-hD5R cells, #P<0.001, vs. Fen, HEK-hD1R (B), $P<0.001, vs. Con, βCD, non-LRs-HEK-hD1R and -HEK-hD5R,**P<0.05, vs. Con, , βCD-LRs,, non-LRs-HEK-hD5R, one-way factorial ANOVA, Tukey post-hoc test, &P<0.006, vs. Fen-non-LRs HEK-hD1R, t-test
C. Effect of fenoldopam and βCD on cAMP accumulation in hRPT cells. hRPT cells were treated with βCD and fenoldopam as described in Figure 5A. cAMP accumulation was measured in each well using a cAMP assay kit and expressed as pmol/mg protein/min. Values are Mean±SEM (n=4/group). *,#P<0.001 vs. all others, untreated and fenoldopam-treated cells, $P<0.002, vs. all others, untreated and fenoldopam-treated cells, one-way factorial ANOVA, Tukey post-hoc test.
Table 1. Effect of methyl- β-cyclodextrin (βCD) on cAMP accumulation.
| Drugs treatment |
cAMP accumulation (pmol/mg protein/min) |
|
|---|---|---|
| HEK-hDjR | HEK-hD5R | |
| Control | 70.9±4.3 | 119.8±11.3$ |
| Fenodolpam | 128.8±13.3* | 166.6±14.2* |
| βCD | 4.0±1.6 | 15.4±4.6 |
| βCD+Fen | 23.0±7.2# | 27.8±3.2$ |
| βCD+Cho | 32.4±7.0 | 39.1±7.7 |
| βCD+Cho+Fen | 49.5±13.6# | 59.3±8.5$ |
HEK-hD1R or HEK-hD5R cells were seeded in 12-well plate at 5×10⁵cells/well. Cells, pretreated for 1hr at 37°C with vehicle or βCD (2%) or βCD plus cholesterol (βCD+Cho), were treated for 10min at 37°C with vehicle (Control, Con) or fenoldopam (Fen, 1μmol/L) or in combination (βCD+Fen, βCD+Cho+Fen). Cells were lyzed in 0.1N HCL as described in “Methods”. The amount of cAMP in each well was measured using cAMP assay kit. cAMP accumulation was calculated and corrected for total protein (mg/ml) and expressed as pmol/mg protein/min. Values are Mean ± SEM (n = 4/group).
P<0.001 vs. others,
P<0.05, vs. Fen-HEK-hD1R,
P<0.003, vs. Con-D1R, and βCD, βCD+Fen, βCD+Cho and βCD+Cho+Fen in HEK-hD5R, n=4, one-way factorial ANOVA, Tukey post-hoc test.
In hRPT cells, basal cAMP accumulation was very low (0.04±0.003 pmol/mg protein/min), relative to HEK-hD1R and HEK-hD5R cells. βCD treatment increased cAMP accumulation 6.8±0.5-fold (0.29±0.05 pmol/mg protein/min) (P<0.001, n=4, ANOVA) (Figure 5D), the opposite of the response observed in HEK-hD1R and HEK-hD5R cells. Cholesterol repletion restored the cAMP accumulation close to basal levels. Fenoldopam markedly increased cAMP accumulation (120±0.6-fold) that was decreased by βCD treatment and partially restored by the addition of cholesterol. Therefore, caution is needed in translating studies in embryonic kidney cells (HEK) to adult RPT cells.
3.6 Effect of siRNA-mediated silencing of specific AC isoforms on AC activity
siRNAs against specific AC isoforms were used to determine which AC isoform contributed to hD1R or hD5R signaling. Silencing the gene expression of AC3, AC5/6, AC7, and AC9 decreased the AC isoform protein expression: 70% for AC3, 50% for AC5/6, 80% for AC7, and 80% for AC9 in HEK-hD1R cells (Figure 6A). Silencing of a single AC isoform gene with an AC isoform-specific siRNA (AC3, AC5/6, AC7, and AC9) partially decreased the fenoldopam-induced increase in AC activity to similar degrees in HEK-hD1R cells and HEK-hD5R cells (Figure 6B). These studies show that the failure of fenoldopam to alter the lipid and non-lipid raft distribution of AC7 and AC9 or their co-immunoprecipitation with D1R or D5R did not preclude their involvement in cell signaling. Indeed, silencing multiple AC isoform genes with AC3- AC5/6-, and/or AC7-specific siRNA augmented their ability to decrease the fenoldopam-mediated increase in AC activity (60±2.8 % of mock-siRNA +Fen) relative to the silencing C5/6 gene (73.4±2.1 % of mock-siRNA) in HEK-hD1R cells (P<0.001, n=4, ANOVA) (Figure 6C).
Figure 6. Effect of silencing AC isoform genes on AC isoform protein and cAMP accumulation.
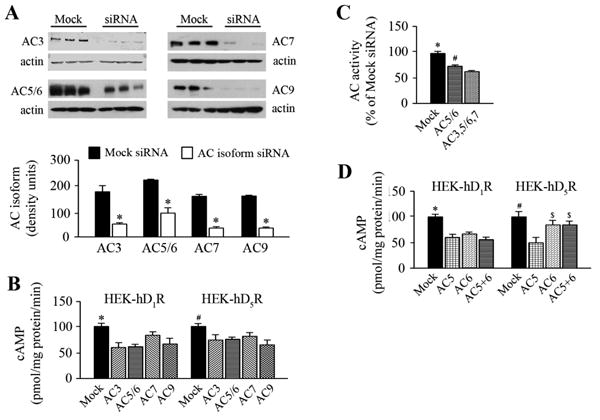
A. Effect of silencing AC isoforms genes on AC isoform protein
HEK-hD1R and HEKhD5R cells were seeded in 6-well plates at the cell density 5×10⁵/well. The cells were transfected with scrambled sequence (mock-siRNA) that served as a negative control, or AC isoformspecific siRNA (AC-siRNA) for 48 h. The cell lysates were immunoblotted with polyclonal antibodies against specific AC isoforms (upper panels). The immunoreactive bands were semiquantified and corrected for actin (lower panel). Values are Mean ± SEM (n=3/group). *,#P<0.001 vs. mock-siRNA, t-test.
B. Effect of silencing a specific AC isoform gene on cAMP accumulation
HEK-hD1R and HEK-hD5R cells were transfected with mock-siRNA or siRNA against theAC3, AC5/6, AC7, and AC9 genes. The cells were then treated with vehicle (Con) or fenoldopam (1 μmol/L) for 10 min. The cells were lysed in HCl solution at a final concentration of 0.1N. cAMP accumulation was measured in each well using a cAMP assay kit and expressed as pmol/mg protein/min. Values are Mean ± SEM (n=7/group). *P<0.05 vs. others in HEK-hD1R; #P<0.05 vs. others, in HEK-hD5R, one-way factorial ANOVA, Tukey post-hoc test.
C. Effect of silencing multiple AC genes on cAMP accumulation in HEK-hD1R cells. HEK-hD1R cells were transfected with mock-siRNA, AC5/6-specific siRNA, or a combination of siRNAs against AC3, AC5/6, and AC7 for 48 h. The cAMP accumulation in the cell lysate was measured as above. Values are Mean ± SEM (n=6/group). *,#P<0.001 vs. others, one-way factorial ANOVA, Tukey post-hoc test.
D. Effect of silencing AC5, AC6, or both on fenoldopam-stimulated cAMP accumulation
HEK- hD1R and HEK-hD5R cells were transfected with mock-siRNA or siRNA against AC5, AC6, or combination of AC5+AC6 for 48 h as described above. cAMP accumulation was measured in the cell lysates as above. Values are Mean ± SEM (n=3-6/group). *P<0.001, vs. all others in HEK-D1R (Figure 6D, left graph) and #P<0.003 vs. all others in HEK-hD5R and $P<0.05 vs. AC5-siRNA in HEK-hD5R (Figure 6D, right graph), one-way factorial ANOVA, Tukey post-hoc test.
To further confirm the effect of AC5-specific siRNA and AC6-specific siRNA on AC activity, the effects of only AC5-specific siRNA, only AC6-specific siRNA, or their combination were studied. Silencing AC5, AC6, or both had no effect on basal AC activity compared with mock-siRNA in either HEK-hD1R or HEK-hD5R cells, but the basal level of AC activity was greater in HEK-hD5R than HEK-hD1R cells (Figure S5, supplementary file), in agreement with previous reports (37, 38). Silencing the AC5 gene reduced the fenoldopam-stimulated AC activity to almost the same extent in HEK-hD1R and HEK-hD5R cells (Figure 6D), in agreement with previous reports (37, 38). In contrast, silencing the AC6 gene impaired the ability of fenoldopam to increase AC activity to a greater extent in HEK-hD1R than HEK-hD5R cells (P<0.05, ANOVA). Silencing both AC5 and AC6 genes did not decrease further the effect of either AC5 or AC6 depletion on fenoldopam-mediated increase in AC activity in HEK-hD1R cells; however, silencing both AC5 and AC6 caused a lesser impairment in the ability of fenoldopam to increase AC activity, similar to that caused by AC6-specific siRNA alone, in HEK-hD5R cells (P<0.05, vs. siAC5+6-D1R, ANOVA) (Figure 6D). These results could be taken to indicate that AC5 is important in the agonist response of both D1R and D5R while AC6, independent of AC5, is also involved in the positive agonist response of D1R. AC6 may be needed with AC5 to abet the positive agonist response of D5R, in agreement with the colocalization of these AC isoforms in lipid rafts.
4. Discussion
Several lines of evidence have shown that some AC isoforms are distributed in lipid rafts and coupled to different GPCRs and downstream effectors endogenously expressed in tissues and cells (16-22, 24, 37) or in over-expression systems (23, 24, 37). However, the regulation of endogenous AC enzymes in human kidney cells has not been reported. We now report the endogenous AC gene expression profiles in HEK-293 and hRPT cells. There are differences among HEK-293, hRPT, and rat RPT cells in the expression of AC isoforms: 1) AC8 is not expressed in rat RPT and hRPT cells, but minimally expressed in HEK-293 cells; 2) AC5 is expressed in HEK-293 and hRPT cells but not in rat RPT cells; and 3) AC2 is expressed in rat RPT cells but not in HEK-293 or hRPT cells (9, 33).
There are other novel findings in the current studies. First, the distribution of endogenous AC5/6 in lipid and non-lipid rafts in HEK-293 cells is affected by the heterologous expression of D1R and D5R. Second, the D1-like receptor agonist fenoldopam increases AC5/6 protein in lipid rafts and decreases it in non-lipid rafts in HEK-hD1R cells, increases AC5/6 in non-lipid rafts only in HEK-hD5R, and increases AC5/6 in lipid rafts only and its association with Cav-1 in hRPT cells. Third, endogenous AC5/6 and AC3 are linked to 75-kDa-D1R in HEK-hD1R cells, while AC5/6 is linked to 45-kDa-D5R in HEK-hD5R cells. Fourth, gene silencing experiments demonstrated that of all AC isoforms endogenously expressed in HEK-293 cells, only AC3, AC5/6, AC7, and AC9 can mediate D1R and D5R signaling. AC5 is important in the agonist response of both D1R and D5R, while AC6, independent of AC5, is also involved in the positive agonist response of D1R. AC6 may be needed by AC5 for the agonist response of D5R.
Lipid rafts are dynamic cholesterol- and sphingolipid-enriched structures that play an important role in organizing signal transduction cascades (13, 14, 38). The extent by which a given GPCR regulates an AC isoform may depend on its plasma membrane localization (14, 37). For example, the β2 adrenergic receptor and AC6 are localized with caveolae in cardiac myocytes, which allow the preferential stimulation of AC6, whereas the prostanoid EP2 receptor, which is distributed outside the caveolae, is coupled to AC6 with far less efficiency (21, 38). The μ-opioid receptor (μ-OPR), but not δ-OPR, is localized in lipid rafts and is more sensitive than δ-OPR to cholesterol depletion (23). In the current studies, we found that endogenous AC5/6 protein is concentrated in lipid raft fraction 4 in HEK-hD1R while AC5/6 protein is diffusely expressed in lipid raft fractions 3-6 in in HEK-hD5R cells. The localization of AC5/6 in lipid rafts may have contributed to differences in basal activity (D5R>D1R) and percent responses to agonist stimulation (D1R>D5R). Disruption of lipid rafts with βCD promoted the de-glycosylation of AC5/6 in HEK-hD1R cells, and shifted all AC5/6 protein to non-lipid rafts in hRPT cells. The decrease in basal AC activity in HEK-293 cells with disrupted lipid rafts suggests that the complex composed of the GPCR, G protein, and AC is in an active state in HEK-293 cells. It is possible that the diffuse localization of AC5/6 in the lipid raft fractions may be responsible for the greater basal AC activity in D5R than D1R (39-42). Although the potency of agonist stimulation of cAMP production is greater for D5R than D1R (37-42), the percent response to maximum AC stimulation with fenoldopam is greater in D1R than D5R in the current study. It is possible that the increased expression of AC5/6 in lipid raft fraction 4 in HEK-D1R cells is responsible for the greater percent maximum effect of agonist stimulation in HEK-D1R than HEK-D5R cells. There may be greater coupling of D1R in HEK-D1R cells because signaling molecules such as Gαs, Gβγ, PKA subunits are also concentrated in the same lipid raft fraction in HEK-hD1R cells (12). Indeed, the maximum fenoldopam-stimulated AC activity is greater in HEK-hD1R than HEK-hD5R, in agreement with a previous report (42).
βCD is widely used to disrupt lipid rafts (15-22). Disruption of lipid rafts with βCD in HEK-293 cells did not alter the lipid raft fraction 4 localization of AC5/6 but shifted its expression to a lower molecular size from 160kDa to 120kDa in HEK-hD1R cells, indicating that AC5/6 protein is not sensitive to cholesterol extraction in HEK-293 cells but was sensitive to cholesterol extraction in hRPT cells, as indicated above. The decreased molecular size of AC5/6 may be due to deglycosylation, in agreement with the report that AC6 is a glycosylated protein (32). However, we do not know why βCD treatment would have caused AC5/6 de-glycosylation in HEK-hD1R cells but not in HEK-hD5R and hRPT cells.
Both D1R and D5R are coupled to Gαs while D5R but not D1R is also coupled to Gα12/13 (7, 44). The complex of D1R-Gαs-AC5/6 may be less stable than the complexes of D5R-Gsα/Gα 12/13-AC5/6 in HEK-hD1R and HEK-hD5R, and D1R/D5R/G-proteins/Cav-1 in hRPT cells. Although AC5/6 distribution pattern is similar in HEK-hD1R and hRPT cells, there is a major difference in that AC5/6 protein completely moved out of lipid rafts in hRPT cells but not in HEK-hD1R and HEK-hD5R cells, following disruption of lipid rafts, indicating that AC5/6 is sensitive to cholesterol extraction in hRPT cells, in agreement with previous reports (16, 17). The difference in AC5/6 properties between embryonic (HEK-293) and terminally differentiated (hRPT) cells is another example of cell specificity. It may be because of the presence of Cav-1, which is responsible for the formation of caveolae (10, 17), in hRPT cells but minimally present or even absent in HEK-293 cells (12, 16, 34, 35). These data could be taken to suggest that different signaling systems are localized in a specialized subdomain of the plasma membrane to optimize the efficiency of signal transduction (10, 45, 46).
βCD treatment has been reported to stimulate or inhibit AC activity (15-22). Cholesterol depletion with βCD augmented isoproterenol-, zinterol-, and forskolin-stimulated accumulation of cAMP in rat ventricular cardiomyocytes (16). βCD treatment or Cav-1 knockdown in C6 glioma cells also increased isoproterenol- or thyrotropin-stimulated cAMP accumulation (15). However, the inhibition by nicotine of the forskolin-stimulated AC activity in a pheochromocytoma cell line (19), and basal and α7 nicotinic receptor-stimulated AC activity in airway epithelial cells were prevented by βCD (20). βCD treatment increased basal forskolin-stimulated cAMP accumulation in HEK-293 cells transfected with δ-and μ-opioid receptors but blocked μ- but not δ-opioid agonist-induced sensitization of AC activity (23). In the current studies, we found that disruption of lipid rafts decreases the basal and agonist-stimulated AC activity in HEK-293 cells but increases it in hRPT cells, indicating cell specificity or cell differentiation, as indicated earlier. Thus, lipid rafts keep AC in a less active state in hRPT cells and in a more active state in HEK-293 cells.
Knockdown of a single AC isoform gene with siRNA partially reduces the fenoldopam-stimulated AC activity in HEK-D1R and HEK-D5R cells, while the knockdown of combination of ACs genes with several AC-siRNAs (AC3, AC5/6, and AC7) further reduces the fenoldopam-stimulated AC activity in HEK-D1R cells. This may suggest that maximal activation of AC requires the formation of multi-AC isoform complex for full agonist stimulation (35, 47). The silencing experiments with siRNA can determine the specific AC isoform effect. We found that AC5 is important in the agonist response of both D1R and D5R but AC6, independent of AC5, is also involved in the positive agonist response of D1R. In contrast, in the case of D5R, AC6 may be needed with AC5 to abet the positive agonist response, in agreement with the colocalization of these AC isoforms in lipid rafts. AC3 may also be associated with hD1R.
5. Conclusions
Our results emphasize the key role of lipid rafts in the regulation of D1R and D5R-GαsAC signaling in human RPT cells. The integrated membrane microdomain localization of GPCRs and AC isoforms is important in maintaining basal and dopamine receptor-mediated signaling transduction. These findings also suggest that AC isoform-selective signaling complexes likely contribute to various functional consequences of cAMP elevation in human kidney cells.
Table 2. Effect of fenoldopam and βCD on cAMP accumulation in LR and non-LR fractions.
| Treatment | cAMP acculmulation (pmol/mg protein/min) |
|
|---|---|---|
| HEK-hDjR | HEK-hD5R | |
| Con-LRs | 30.5±2.1 | 35.3 ±2.9 |
| Fen-LRs | 512.5 ±47.4*# | 131.9±9.1* |
| βCD-LRs | 19.7±1.0 | 23.4 ±3.4 |
| βCD+Fen-LRs | 185.3 ±9.8$ | 40.3 ±3.6 |
| Con-non-LRs | 29.6 ±3.3 | 54.9 ±5.0& |
| Fen-non-LRs | 50.0±5.1 | 88.7 ± 5.8** |
| βCD-non-LRs | 25.4 ±2.0 | 67.1 ±8.3& |
| βCD+Fen-non-LRs | 48.2 ±3.4 | 68.9 ± 5.3 |
Cell sucrose gradient fractions 2-6 and 7-12 were combined as LR (2-6) and non-LR (7-12) fractions. The amount of cAMP in each well was measured using cAMP assay kit. cAMP accumulation was calculated and corrected for total protein (mg/ml) and expressed as pmol/mg protein/min. Values are Mean ± SEM (n = 4/group).
P<0.001, vs. all others in HEK-hD1R and HEK-hD5R cells, respectively,
P<0.001, vs. HEK-hD5R,
P<0.001, vs. others HEK-hD1R, and βCD+Fen-LRs HEK-hD5R cells,
P<0.05, vs. all others except βCD+Fen-LRs HEK-hD5R cells, ANOVA, Tukey test,
P<0.006, vs. Con-non-LRs and βCD-non-LRs, HEK-hD1R, t-test.
Highlights.
The distribution of endogenous AC5/6 in lipid and non-lipid rafts in HEK-293 cells is affected by the heterologous expression of hD1R and hD5R.
The D1-like receptor agonist fenoldopam differentially affects AC5/6 protein: a) increased in lipid rafts and decreased in non-lipid rafts in HEK-hD1R cells; b) increased in non-lipid rafts but no effect in lipid rafts in HEK-hD5R; and c) increased in lipid rafts but no effect in non-lipid rafts in hRPT cells.
Endogenous AC5/6 and AC3 interact with 75-kDa-D1R in HEK-hD1R cells, while AC5/6 interacts with 45-kDa-D5R in HEK-hD5R cells.
Gene silencing experiments demonstrated that in HEK-293 cells, AC3, AC5/6, AC7, and AC9 could mediate D1R and D5R function. However, AC5 is important in the agonist response of both D1R and D5R, while AC6, independent of AC5, is also involved in the positive agonist response of D5R.
Acknowledgments
This work was funded, in part, by grants from the National Institutes of Health, R37HL023081, R01DK039308, P01HL074940, P01HL068686, R01HL092196, R01DK090918, R01DK055881, and Department of Veterans Affairs Research Service. We also acknowledge the help of Dr. John E. Jones in the determination of the DNA sequences of the different AC isoforms.
Abbreviations
- AC
Adenylyl cyclase
- DA
dopamine receptor
- LRs
lipid rafts
- hRPT
human renal proximal tubule
- βCD
methyl- β-cyclodextrin
Footnotes
Disclosure: None
Publisher's Disclaimer: This is a PDF file of an unedited manuscript that has been ac cepted for publication. As a service to our customers we are providing this early version of the manuscript. The manuscript will undergo copyediting, typesetting, and review of the resulting proof before it is published in its final citable form. Please note that during the production process errors may be discovered which could affect the content, and all legal disclaimers that apply to the journal pertain.
References
- 1.Taussig R, Gilman AG. Mammalian membrane-bound adenylyl cyclases. J Biol Chem. 1995;27:1–4. doi: 10.1074/jbc.270.1.1. [DOI] [PubMed] [Google Scholar]
- 2.Tang WJ, Hurley JH. Catalytic mechanism and regulation of mammalian adenylyl cyclases. Mol Pharmacol. 1998;54:231–240. doi: 10.1124/mol.54.2.231. [DOI] [PubMed] [Google Scholar]
- 3.Willoughby D, Cooper DM. Organization and Ca2+ regulation of adenylyl cyclases in cAMP microdomains. Physiol Rev. 2007;87:965–1010. doi: 10.1152/physrev.00049.2006. [DOI] [PubMed] [Google Scholar]
- 4.Sadana R, Dessauer CW. Physiological roles for G protein-regulated adenylyl cyclase isoforms: insights from knockout and overexpression studies. Neurosignals. 2009;17:5–22. doi: 10.1159/000166277. [DOI] [PMC free article] [PubMed] [Google Scholar]
- 5.Patel TB, Du Z, Pierre S, Cartin L, Scholich K. Molecular biological approaches to unravel adenylyl cyclase signaling and function. Gene. 2001;269:13–25. doi: 10.1016/s0378-1119(01)00448-6. [DOI] [PubMed] [Google Scholar]
- 6.Monsma FJ, Jr, Mahan LC, McVittie LD, Gerfenf CR, Sibley DR. Molecular cloning and expression of a D1 dopamine receptor linked to adenylyl cyclase activation. Proc Natl Acad Sci USA. 1990;87:6723–6727. doi: 10.1073/pnas.87.17.6723. [DOI] [PMC free article] [PubMed] [Google Scholar]
- 7.Jose PA, Eisner GM, Felder RA. Renal dopamine receptors in health and hypertension. Pharmacol Ther. 1998;80:149–182. doi: 10.1016/s0163-7258(98)00027-8. [DOI] [PubMed] [Google Scholar]
- 8.Hussain T, Lokhandwala MF. Renal dopamine receptors and hypertension. Exp Biol Med (Maywood) 2003;228:134–142. doi: 10.1177/153537020322800202. [DOI] [PubMed] [Google Scholar]
- 9.Bek MJ, Zheng S, Xu J, Yamaguchi I, Asico ID, Sun XG, Jose PA. Differential expression of adenylyl cyclases in the rat nephron. Kidney Int. 2001;60:890–899. doi: 10.1046/j.1523-1755.2001.060003890.x. [DOI] [PubMed] [Google Scholar]
- 10.Strait KA, Stricklett PK, Chapman M, Kohan DE. Characterization of vasopressinresponsive collecting duct adenylyl cyclases in the mouse. Am J Physiol Renal Physiol. 2010;298:F859–F867. doi: 10.1152/ajprenal.00109.2009. [DOI] [PMC free article] [PubMed] [Google Scholar]
- 11.Hoffert JD, Chou CL, Fenton RA, Knepper MA. Calmodulin is required for vasopressin-stimulated increase in cyclic AMP production in inner medullary collecting duct. J Biol Chem. 2005;280:13624–13630. doi: 10.1074/jbc.M500040200. [DOI] [PMC free article] [PubMed] [Google Scholar]
- 12.Yu P, Yang Z, Jones JE, Wang Z, Owens SA, Mueller SC, Felder RA, Jose PA. D1 Dopamine receptor signaling involves caveolin-2 in HEK-293 cells. Kidney Int. 2004;66:2167–2180. doi: 10.1111/j.1523-1755.2004.66007.x. [DOI] [PubMed] [Google Scholar]
- 13.Schwencke C, Yamamoto M, Okumura S, Toya Y, Kim SJ, Ishikawa Y. Compartmentation of cyclic adenosine 3′,5′-monophosphate signaling in caveolae. Mol Endocrinol. 1999;13:1061–1070. doi: 10.1210/mend.13.7.0304. [DOI] [PubMed] [Google Scholar]
- 14.Cooper DM, Crossthwaite AJ. Higher-order organization and regulation of adenylyl cyclases. Trends Pharmacol Sci. 2006;27:426–431. doi: 10.1016/j.tips.2006.06.002. [DOI] [PubMed] [Google Scholar]
- 15.Allen JA, Yu JZ, Dave RH, Bhatnagar A, Roth BL, Rasenick MM. Caveolin-1 and lipid microdomains regulate Gs trafficking and attenuate Gs/adenylyl cyclase signaling. Mol Pharmacol. 2009;76:1082–1093. doi: 10.1124/mol.109.060160. [DOI] [PMC free article] [PubMed] [Google Scholar]
- 16.Rybin VO, Xu X, Lisanti MP, Steinberg SF. Differential targeting of β-adrenergic receptor subtypes and adenylyl cyclase to cardiomyocyte caveolae A mechanism to functionally regulate the cAMP signaling pathway. J Biol Chem. 2000;275:41447–41457. doi: 10.1074/jbc.M006951200. [DOI] [PubMed] [Google Scholar]
- 17.Ostrom RS, Violin JD, Coleman S, Insel PA. Selective enhancement of β-adrenergic receptor signaling by overexpression of adenylyl cyclase type 6: colocalization of receptor and adenylyl cyclase in caveolae of cardiac myocytes. Mol Pharmacol. 2000;57:1075–1079. [PubMed] [Google Scholar]
- 18.Stark JC, Haydock SF, Foo R, Brown MJ, Harding SE. Effect of overexpressed adenylyl cyclase VI on β1- and β2-adrenoceptor responses in adult rat ventricular myocytes. Br J Pharmacol. 2004;143:465–476. doi: 10.1038/sj.bjp.0705976. [DOI] [PMC free article] [PubMed] [Google Scholar]
- 19.Oshikawa J, Toya Y, Fujita T, Egawa M, Kawabe J, Umemura S, Ishikawa Y. Nicotinic acetylcholine receptor alpha 7 regulates cAMP signal within lipid rafts. Am J Physiol Cell Physiol. 2003;285:C567–C574. doi: 10.1152/ajpcell.00422.2002. [DOI] [PubMed] [Google Scholar]
- 20.Maouche K, Medjber K, Zahm JM, Delavoie F, Terryn C, Coraux C, Pons S, Cloez-Tayarani I, Maskos U, Birembaut P, Tournier JM. Contribution of α7 nicotinic receptor to airway epithelium dysfunction under nicotine exposure. Proc Natl Acad Sci USA. 2013;110:4099–4104. doi: 10.1073/pnas.1216939110. [DOI] [PMC free article] [PubMed] [Google Scholar]
- 21.Bogard AS, Adris P, Ostrom R. Adenylyl cyclase 2 (AC2) selectively couples to EP2 receptors while adenylyl cyclase 3 (AC3) is not receptor regulated in airway smooth muscle. J Pharmacol Exp Ther. 2012;342:586–595. doi: 10.1124/jpet.112.193425. [DOI] [PMC free article] [PubMed] [Google Scholar]
- 22.Kobayakawa K, Hayashi R, Morita K, Miyamichi K, Oka Y, Tsuboi A, Sakano H. Stomatin-related olfactory protein, SRO, specifically expressed in the murine olfactory sensory neurons. J Neurosci. 2002;22:5931–5937. doi: 10.1523/JNEUROSCI.22-14-05931.2002. [DOI] [PMC free article] [PubMed] [Google Scholar]
- 23.Levitt EB, Clark MI, Jenkins PM, Martens JR, Traynor JR. Differential effect of membrane cholesterol removal on μ- and δ-opioid receptors: a parallel comparison of acute and chronic signaling to adenylyl cyclase. J Biol Chem. 2009;284:22108–22122. doi: 10.1074/jbc.M109.030411. [DOI] [PMC free article] [PubMed] [Google Scholar]
- 24.Cai W, Du AL, Feng K, Zhao XN, Qian L, Ostrom RS, Xu CF. Adenylyl cyclase 6 activation negatively regulates TLR4 signaling through lipid raft-mediated endocytosis. J Immunology. 2013;191:6093–6100. doi: 10.4049/jimmunol.1301912. [DOI] [PubMed] [Google Scholar]
- 25.Ehrlich AT, Furuyashiki T, Kitaoka S, Kakizuka A, Narumiya S. Prostaglandin E receptor EP1 forms a complex with dopamine D1 receptor and directs D1-induced cAMP production to adenylyl cyclase 7 through mobilizing Gβγ subunits in human embryonic kidney 293T cells. Mol Pharmacol. 2013;84:476–486. doi: 10.1124/mol.113.087288. [DOI] [PubMed] [Google Scholar]
- 26.Yang Z, Asico LD, Yu P, Wang Z, Jones JE, Escano CS, Wang X, Quinn MT, Sibley DR, Romero GG, Felder RA, Jose PA. D5 dopamine receptor regulation of reactive oxygen species production, NADPH oxidase, and blood pressure. Am J Physiol Regul Integr Comp Physiol. 2006;290:R96–R104. doi: 10.1152/ajpregu.00434.2005. [DOI] [PubMed] [Google Scholar]
- 27.Han W, Li H, Villar VAM, Pascua AM, Dajani MI, Wang X, Natarajan A, Quinn MT, Felder RA, Jose PA. Lipid rafts keep NADPH oxidase in the inactive state in human renal proximal tubule cells. Hypertension. 2008;51:481–487. doi: 10.1161/HYPERTENSIONAHA.107.103275. part 2. [DOI] [PubMed] [Google Scholar]
- 28.Sanada H, Jose PA, Hazen-Martin D, Yu PY, Xu J, Bruns DE, Phipps J, Carey RM, Felder RA. Dopamine-1 receptor coupling defect in renal proximal tubule cells in hypertension. Hypertension. 1999;33:1036–1042. doi: 10.1161/01.hyp.33.4.1036. [DOI] [PubMed] [Google Scholar]
- 29.Gildea JJ, Israel JA, Johnson AK, Zhang J, Jose PA, Felder RA. Caveolin-1 and dopamine-mediated internalization of NaKATPase in human renal proximal tubule cells. Hypertension. 2009;54:1070–1076. doi: 10.1161/HYPERTENSIONAHA.109.134338. [DOI] [PMC free article] [PubMed] [Google Scholar]
- 30.Gildea JJ, Wang X, Jose PA, Felder RA. Differential D1 and D5 receptor regulation and degradation of the angiotensin type 1 receptor. Hypertension. 2008;51:360–366. doi: 10.1161/HYPERTENSIONAHA.107.100099. [DOI] [PubMed] [Google Scholar]
- 31.Ostrom RS, Insel PA. The evolving role of lipid rafts and caveolae in G protein-coupled receptor signaling: implications for molecular pharmacology. Br J Pharmacol. 2004;143:235–245. doi: 10.1038/sj.bjp.0705930. [DOI] [PMC free article] [PubMed] [Google Scholar]
- 32.Wu GC, Lai HL, Lin YW, Chu YT, Chern Y. N-glycosylation and residues Asn805 and Asn890 are involved in the functional properties of type VI adenylyl cyclase. J Biol Chem. 2001;276:35450–35457. doi: 10.1074/jbc.M009704200. [DOI] [PubMed] [Google Scholar]
- 33.Chabardes D, Firsov D, Aarab L, Clabecq A, Bellanger AC, Siaume-Perez S, Elalouf JM. Localization of mRNAs encoding Ca2+-inhibitable ACs along the renal tubule Functional consequences for regulation of the cAMP content. J Biol Chem. 1996;271:19264–19271. doi: 10.1074/jbc.271.32.19264. [DOI] [PubMed] [Google Scholar]
- 34.Scherer PE, Lewis RY, Volonte D, Engelman JA, Galbiati F, Couet J, Kohtz DS, van Donselaar E, Peters P, Lisanti MP. Cell-type and tissue-specific expression of caveolin-2. Caveolins 1 and 2 co-localize and form a stable hetero-oligomeric complex in vivo. J Biol Chem. 1997;272:29337–29346. doi: 10.1074/jbc.272.46.29337. [DOI] [PubMed] [Google Scholar]
- 35.Kong MM, Hasbi A, Mattocks M, Fan T, O'Dowd BF, George SR. Regulation of D1 dopamine receptor trafficking and signaling by caveolin-1. Mol Pharmacol. 2007;72:1157–1170. doi: 10.1124/mol.107.034769. [DOI] [PubMed] [Google Scholar]
- 36.Feng X, Gaeta ML, Madge LA, Yang JH, Bradley JR, Pober JS. Caveolin-1 associates with TRAF2 to form a complex that is recruited to tumor necrosis factor receptors. J Biol Chem. 2001;276:8341–8349. doi: 10.1074/jbc.M007116200. [DOI] [PubMed] [Google Scholar]
- 37.Ostrom RS, Bogard AS, Gros R, Feldman RD. Choreographing the adenylyl cyclase signalosome: sorting out the partners and the steps. Naunyn Schmiedebergs Arch Pharmacol. 2012;385:5–12. doi: 10.1007/s00210-011-0696-9. [DOI] [PubMed] [Google Scholar]
- 38.Ostrom RS, Gregorian C, Drenan RM, Xiang Y, Regan JW, Insel PA. Receptor number and caveolar co-localization determine receptor coupling efficiency to adenylyl cyclase. J Biol Chem. 2001;276:42063–42069. doi: 10.1074/jbc.M105348200. [DOI] [PubMed] [Google Scholar]
- 39.Dearry A, Gingrich JA, Falardeau P, Fremeau RT, Jr, Bates MD, Caron MG. Molecular cloning and expression of the gene for a human D1 dopamine receptor. Nature. 1990;347:72–76. doi: 10.1038/347072a0. [DOI] [PubMed] [Google Scholar]
- 40.Sunahara PK, Guan HC, O'Dowd BF, Seeman P, Laurier LG, Ng G, George SR, Torchia J, Van Tol HH, Niznik HB. Cloning of the gene for a human dopamine D5 receptor with higher affinity for dopamine than D1. Nature. 1991;350:614–619. doi: 10.1038/350614a0. [DOI] [PubMed] [Google Scholar]
- 42.Tiberi M, Caron MG. High agonist-independent activity is a distinguishing feature of the dopamine D1B receptor subtype. J Biol Chem. 1994;269:27925–27931. [PubMed] [Google Scholar]
- 43.Li W, Takahashi M, Shibukawa Y, Yokoe S, Gu J, Miyoshi E, Honke K, Ikeda Y, Taniguchi N. Introduction of bisecting GlcNAc in N-glycans of adenylyl cyclase III enhances its activity. Glycobiology. 2007;17:655–662. doi: 10.1093/glycob/cwm022. [DOI] [PubMed] [Google Scholar]
- 44.Zheng S, Yu P, Zeng C, Wang Z, Yang Z, Andrews PM, Felder RA, Jose PA. Galpha12 and Galpha13 protein subunit linkage of D5 dopamine receptors in the nephron. Hypertension. 2003;41:604–610. doi: 10.1161/01.HYP.0000057422.75590.D7. [DOI] [PubMed] [Google Scholar]
- 45.Huang C, Hepler JR, Chen LT, Gilman AG, Anderson RG, Mumby SM. Organization of G proteins and adenylyl cyclase at the plasma membrane. Mol Biol Cell. 1997;8:2365–2378. doi: 10.1091/mbc.8.12.2365. [DOI] [PMC free article] [PubMed] [Google Scholar]
- 46.Razani B, Woodman SE, Lisanti MP. Caveolae: from cell biology to animal physiology. Pharmacol Rev. 2002;54:431–467. doi: 10.1124/pr.54.3.431. [DOI] [PubMed] [Google Scholar]
- 47.Gales C, Van Durm JJ, Schaak S S, Pontier S, Percherancier Y, Audet M, Paris H, Bouvier M. Probing the activation-promoted structural rearrangements in preassembled receptor-G protein complexes. Nat Struct Mol Biol. 2006;13:778–786. doi: 10.1038/nsmb1134. [DOI] [PubMed] [Google Scholar]