Abstract
Haplotype-based scans to detect natural selection are useful to identify recent or ongoing positive selection in genomes. As both real and simulated genomic data sets grow larger, spanning thousands of samples and millions of markers, there is a need for a fast and efficient implementation of these scans for general use. Here, we present selscan, an efficient multithreaded application that implements Extended Haplotype Homozygosity (EHH), Integrated Haplotype Score (iHS), and Cross-population EHH (XPEHH). selscan accepts phased genotypes in multiple formats, including TPED, and performs extremely well on both simulated and real data and over an order of magnitude faster than existing available implementations. It calculates iHS on chromosome 22 (22,147 loci) across 204 CEU haplotypes in 353 s on one thread (33 s on 16 threads) and calculates XPEHH for the same data relative to 210 YRI haplotypes in 578 s on one thread (52 s on 16 threads). Source code and binaries (Windows, OSX, and Linux) are available at https://github.com/szpiech/selscan.
Introduction
Extended Haplotype Homozygosity (EHH) (Sabeti et al. 2002), Integrated Haplotype Score (iHS) (Voight et al. 2006), and Cross-population Extended Haplotype Homozygosity (XPEHH) (Sabeti et al. 2007) are statistics designed to use phased genotypes to identify putative regions of recent or ongoing positive selection in genomes. They are all based on the model of a hard selective sweep, where a de novo adaptive mutation arises on a haplotype that quickly sweeps toward fixation, reducing diversity around the locus. If selection is strong enough, this occurs faster than recombination or mutation can act to break up the haplotype, and thus a signal of high haplotype homozygosity can be observed extending from an adaptive locus.
As genetics data sets grow larger both in number of individuals and number of loci, there is a need for a fast and efficient publicly available implementation of these statistics. Below, we introduce these statistics and provide concise definitions for their calculations. We then evaluate the performance of our implementation, selscan.
Extended Haplotype Homozygosity
In a sample of n chromosomes, let denote the set of all possible distinct haplotypes at a locus of interest (named x0), and let denote the set of all possible distinct haplotypes extending from the locus x0 to the i-th marker either upstream or downstream from x0. For example, if the locus of interest x0 is a biallelic single nucleotide polymorphism (SNP) where 0 represents the ancestral allele and 1 represents the derived allele, then . If x1 is an immediately adjacent marker, then the set of all possible haplotypes is .
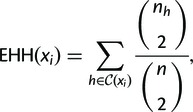
EHH of the entire sample, extending from the locus x0 out to marker xi, is calculated as
 |
(1) |
where nh is the number of observed haplotypes of type .
In some cases, we may want to calculate the haplotype homozygosity of a subsample of chromosomes all carrying a “core” haplotype at locus x0. Let be a partition of containing all distinct haplotypes carrying the core haplotype, , at x0 and extending to marker xi. Note that
| (2) |
Following the example above, if the derived allele (1) is chosen as the core haplotype, then . Similarly, if the ancestral allele is the core haplotype, then .
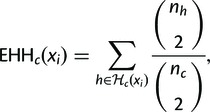
We calculate the EHH of the chromosomes carrying the core haplotype c to marker xi as
 |
(3) |
where nh is the number of observed haplotypes of type and nc is the number of observed haplotypes carrying the core haplotype ().
Integrated Haplotype Score
iHS is calculated by using equation (3) to track the decay of haplotype homozygosity for both the ancestral and derived haplotypes extending from a query site. To calculate iHS at a site, we first calculate the integrated haplotype homozygosity (iHH) for the ancestral (0) and derived (1) haplotypes () via trapezoidal quadrature.
| (4) |
where is the set of markers downstream from the current locus such that denotes the i-th closest downstream marker from the locus of interest (x0). and are defined similarly for upstream markers. gives the genetic distance between two markers. The (unstandardized) iHS is then calculated as
| (5) |
Note that this definition differs slightly from that in Voight et al. (2006), where unstandardized iHS is defined with iHH1 and iHH0 swapped.
Finally, the unstandardized scores are normalized in frequency bins across the entire genome.
| (6) |
where and are the expectation and standard deviation in frequency bin p.
In practice, the summations in equation (4) are truncated once . Additionally with low density SNP data, if the physical distance b (in kbp) between two markers is >20, then is scaled by a factor of 20/b in order to reduce possible spurious signals induced by lengthy gaps. During computation if the start/end of a chromosome arm is reached before or if a gap of b > 200 is encountered, the iHS calculation is aborted for that locus. iHS is not reported at core sites with minor allele frequency (MAF) < 0.05. In selscan, the EHH truncation value, gap scaling factor, and core site MAF cutoff value are all flexible parameters definable on the command line.
Cross-population Extended Haplotype Homozygosity
To calculate XPEHH between populations A and B at a marker x0, we first calculate iHH for each population separately, integrating the EHH of the entire sample in the population (eq. 1).
| (7) |
If iHHA and iHHB are the iHHs for populations A and B, then the (unstandardized) XPEHH is
| (8) |
and after genome-wide normalization we have
| (9) |
In practice, the sums in each of iHHA and iHHB (eq. 7) are truncated at xi—the marker at which the EHH of the haplotypes pooled across populations is . Scaling of and handling of gaps is done as for iHS, and these parameters are definable on the selscan command line.
Performance
Here, we evaluate the performance of selscan (https://github.com/szpiech/selscan, last accessed July 16, 2014) for computing the iHS and XPEHH statistics. In addition, we compare performance on these statistics with the programs rehh (Gautier and Vitalis 2012, http://cran.r-project.org/package=rehh, last accessed July 16, 2014), ihs (Voight et al. 2006), and xpehh (Pickrell et al. 2009). Both ihs and xpehh are available for download at http://hgdp.uchicago.edu/Software/ (last accessed July 16, 2014). All computations were run on a MacPro running OSX 10.8.5 with two 2.4 GHz 6–core Intel Xeon processors with hyperthreading enabled.
Integrated Haplotype Score
For runtime evaluation of iHS calculations, we simulated a 4 Mbp region of DNA with the program ms (Hudson 2002) and generated four independent data sets with varying numbers of sampled haplotypes ( and ). We sampled 250 haplotypes (9,625 SNP loci), 500 haplotypes (10,646 SNP loci), 1,000 haplotypes (11,655 SNP loci), and 2,000 haplotypes (12,724 SNP loci). We name these data sets IHS250, IHS500, IHS1000, and IHS2000, respectively. These data sets represent a densely typed region similar to next-generation sequencing data. Although these data sets are generated via strictly neutral processes, they serve the purpose of runtime evaulation perfectly well. We also use data from The 1000 Genomes Project (1000 Genomes Project Consortium 2012) Omni genotypes, calculating iHS scores at 22,147 SNP loci on chromosome 22 across 102 CEU individuals (204 haplotypes). We name this data set CEU22.
Table 1 summarizes the runtimes of ihs, rehh, and selscan. We note that rehh integrates haplotype homozygosity over a physical map, whereas ihs and selscan integrate over a genetic map by default. This does not affect runtimes (data not shown), which are measured using genetic maps for ihs and selscan. Even operating on a single thread, selscan calculates iHS scores at least an order of magnitude faster than ihs and up to 1.8 × faster than rehh for large data sets.
Table 1.
Runtime Performance (in seconds) of ihs, rehh, and selscan for Calculating Unstandardized iHS for Various Data Sets.
| Data Set | ihs | rehha |
selscan |
||||
|---|---|---|---|---|---|---|---|
| Threads | 2 | 4 | 8 | 16 | |||
| IHS250 | 19,275 | 563 | 618 | 306 | 162 | 84 | 58 |
| IHS500 | 45,547 | 1,652 | 1,554 | 782 | 399 | 220 | 150 |
| IHS1000 | 4,834 | 4,018 | 2,019 | 1,040 | 566 | 380 | |
| IHS2000 | 12,652 | 7,054 | 3,633 | 1,869 | 1,046 | 752 | |
| CEU22 | 19,434 | 588 | 353 | 182 | 93 | 50 | 33 |
Note.—Calculations running over 100,000 s were aborted.
arehh integrates over a physical map instead of a genetic map. Using a physical map does not affect selscan’s runtime (data not shown).
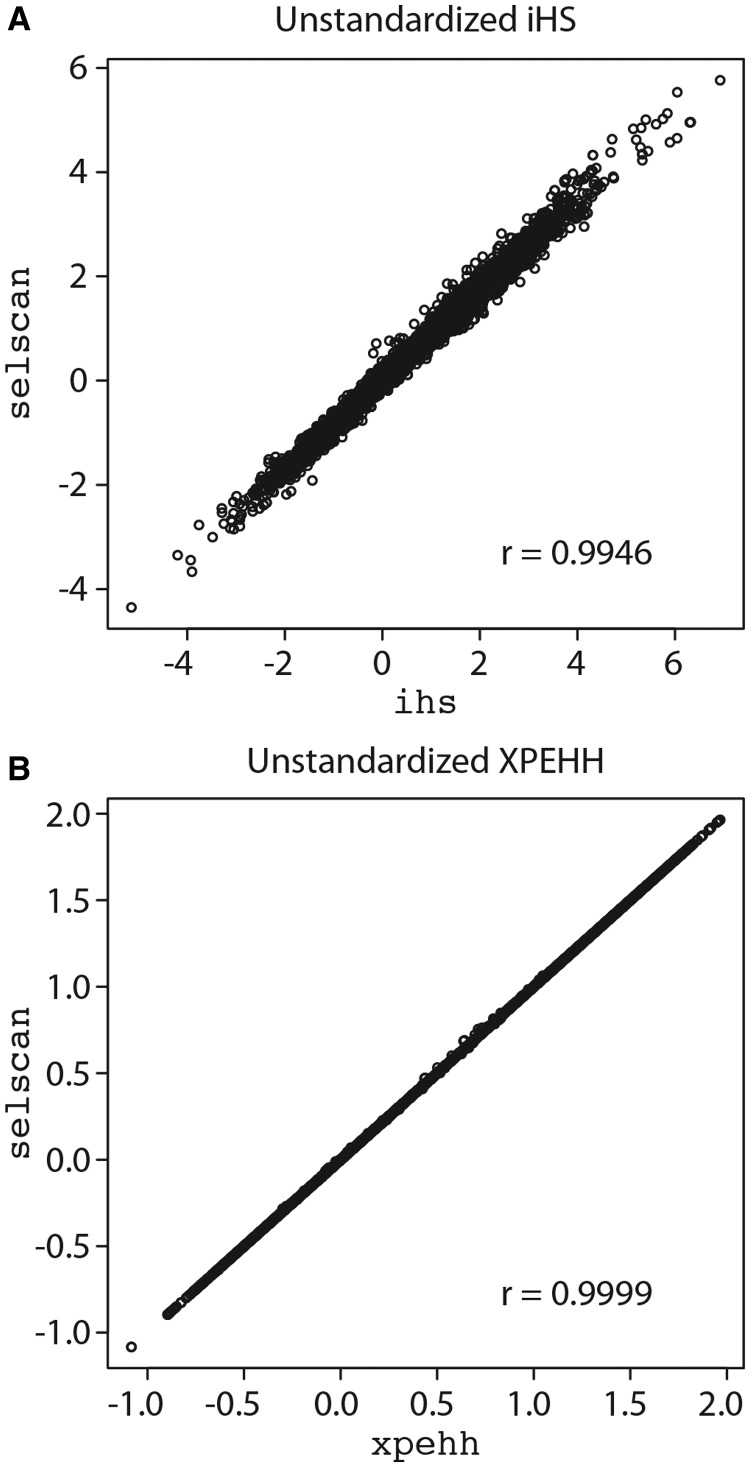
We compare unstandardized iHS scores for the CEU22 data set using ihs and selscan and find excellent agreement (fig. 1A, Pearson’s r = 0.9946). The slight variance in scores between the two programs is likely due to an undocumented difference in the way ihs calculates its scores (supplementary material of Sabeti et al. 2007), but the effect is negligible. We also calculate unstandardized iHS scores for the CEU22 data set using rehh and selscan (using a physical map) and again find excellent agreement (Pearson’s r = 0.9953).
Fig. 1.
(A) Unstandardized iHS scores calculated on the CEU22 data set for selscan and ihs (Pearson’s r = 0.9946) and (B) Unstandardized XPEHH scores calculated on the CEUYRI22 data set for selscan and xpehh (Pearson’s r = 0.9999).
Cross-Population Extended Haplotype Homozygosity
For runtime evaluation of XPEHH calculations, we simulated a 4-Mbp region of DNA with the program ms (Hudson 2002) with a simple two population divergence model (time to divergence t = 0.05, , and ) and generated four independent data sets with varying numbers of sampled haplotypes. We sampled 250 haplotypes (125 from each population, 12,920 SNP loci), 500 haplotypes (250 from each population, 14,989 SNP loci), 1,000 haplotypes (500 from each population, 17,142 SNP loci), and 2,000 haplotypes (1,000 from each population, 19,567 SNP loci). We name these data sets XP250, XP500, XP1000, and XP2000, respectively. These data sets represent a densely typed region similar to next-generation sequencing data. Although these data sets are generated via strictly neutral processes, they serve the purpose of runtime evaulation perfectly well. We also use data from The 1000 Genomes Project (1000 Genomes Project Consortium 2012) Omni genotypes, calculating XPEHH scores at 22, 147 SNP loci on chromosome 22 across 102 CEU individuals (204 haplotypes) and 105 YRI individuals (210 haplotypes). We name this data set CEUYRI22.
Table 2 summarizes the runtimes of xpehh and selscan. Even operating on a single thread, selscan tends to calculate XPEHH scores at least an order of magnitude faster than xpehh. Figure 1B shows the correlation (Pearson’s r = 0.9999) of CEUYRI22 unstandardized XPEHH scores between the two programs.
Table 2.
Runtime Performance (in seconds) of xpehh and selscan for Calculating Unstandardized XPEHH for Various Data Sets.
| Data Set | xpehh |
selscan |
||||
|---|---|---|---|---|---|---|
| Threads | 2 | 4 | 8 | 16 | ||
| XP250 | 11,113 | 287 | 141 | 71 | 38 | 25 |
| XP500 | 57,006 | 766 | 403 | 194 | 104 | 67 |
| XP1000 | 2,037 | 1,018 | 515 | 274 | 180 | |
| XP2000 | 5,683 | 2,798 | 1,471 | 763 | 493 | |
| CEUYRI22 | 37,271 | 578 | 291 | 150 | 78 | 52 |
Note.—Calculations running over 100,000 s were aborted.
Conclusions
selscan achieves a speed up of at least an order or magnitude over both ihs and xpehh and a speed up of nearly 2x over rehh for large data sets through general optimizations of the calculations. We also implement shared memory parallelism with multithreading to further speed up calculations on computers with multiple cores. Because iHS and XPEHH attempt to calculate a score for each site in the data and each score can be calculated indpendently of the others, selscan partitions the workload (sites at which to calculate a score) across threads, while maintaining each thread’s access to the entire data set required to make the calculation.
Additional empirical testing (data not shown) suggests that rehh, ihs, and selscan (for both iHS and XPEHH calculations) are , and xpehh is , where N is the number of haploid samples and D is the SNP locus density.
Each of these statistics require phased haplotypes and a genetic or physical map as input data (TPED format) and missing genotypes must either be dropped or imputed. Because of the speed improvements we have implented, we expect that selscan will be a valuable tool for calculating EHH-based genome-wide scans for positive selection in very large genetic data sets, including whole-genome sequencing and genome-wide association study data, currently being generated for humans and other organisms. selscan will also allow for in-depth examination of the performance of these statistics under a wide range of parameters in large-scale simulation studies.
Acknowledgments
The authors would like to thank Trevor Pemberton and Paul Verdu for assistance in testing the Windows binaries. This work was partially supported by NIH (grants P60MD006902, UL1RR024131, 1R21HG007233, 1R21CA178706, 1R01HL117004-01, and 1R01HG007644) and a Sloan Foundation Research Fellowship (to R.D.H.).
References
- 1000 Genomes Project Consortium. An integrated map of genetic variation from 1,092 human genomes. Nature. 2012;491(7422):56–65. doi: 10.1038/nature11632. [DOI] [PMC free article] [PubMed] [Google Scholar]
- Gautier M, Vitalis R. rehh: an R package to detect footprints of selection in genome-wide SNP data from haplotype structure. Bioinformatics. 2012;28(8):1176–1177. doi: 10.1093/bioinformatics/bts115. [DOI] [PubMed] [Google Scholar]
- Hudson RR. Generating samples under a wrightfisher neutral model of genetic variation. Bioinformatics. 2002;18(2):337–338. doi: 10.1093/bioinformatics/18.2.337. [DOI] [PubMed] [Google Scholar]
- Pickrell JK, Coop G, Novembre J, Kudaravalli S, Li JZ, Absher D, Srinivasan BS, Barsh GS, Myers RM, Feldman MW, et al. Signals of recent positive selection in a worldwide sample of human populations. Genome Res. 2009;19(5):826–837. doi: 10.1101/gr.087577.108. [DOI] [PMC free article] [PubMed] [Google Scholar]
- Sabeti PC, Reich DE, Higgins JM, Levine HZP, Richter DJ, Schaffner SF, Gabriel SB, Platko JV, Patterson NJ, McDonald GJ, et al. Detecting recent positive selection in the human genome from haplotype structure. Nature. 2002;419(6909):832–837. doi: 10.1038/nature01140. [DOI] [PubMed] [Google Scholar]
- Sabeti PC, Varilly P, Fry B, Lohmueller J, Hostetter E, Cotsapas C, Xie X, Byrne EH, McCarroll SA, Gaudet R, et al. Genome-wide detection and characterization of positive selection in human populations. Nature. 2007;449(7164):913–918. doi: 10.1038/nature06250. [DOI] [PMC free article] [PubMed] [Google Scholar]
- Voight BF, Kudaravalli S, Wen X, Pritchard JK. A map of recent positive selection in the human genome. PLoS Biol. 2006;4(3):e72. doi: 10.1371/journal.pbio.0040072. [DOI] [PMC free article] [PubMed] [Google Scholar]


