Abstract
Drusen, the hallmark lesions of age related macular degeneration (AMD), are biochemically heterogeneous and the identification of their biochemical distribution is key to the understanding of AMD. Yet the challenges are to develop imaging technology and analytics, which respect the physical generation of the hyperspectral signal in the presence of noise, artifacts, and multiple mixed sources while maximally exploiting the full data dimensionality to uncover clinically relevant spectral signatures. This paper reports on the statistical analysis of hyperspectral signatures of drusen and anatomical regions of interest using snapshot hyperspectral imaging and non-negative matrix factorization (NMF). We propose physical meaningful priors as initialization schemes to NMF for finding low-rank decompositions that capture the underlying physiology of drusen and the macular pigment. Preliminary results show that snapshot hyperspectral imaging in combination with NMF is able to detect biochemically meaningful components of drusen and the macular pigment. To our knowledge, this is the first reported demonstration in vivo of the separate absorbance peaks for lutein and zeaxanthin in macular pigment.
I. Introduction
WITHOUT improvements in preventing and treating eye diseases and blindness, the number of blind or visually impaired Americans 40 and older will grow from 3.4 to 5.5 million in 2020. Age-related macular degeneration (AMD) is the leading cause of blindness in the U.S. [1]. Drusen the hallmark lesions of age-related macular degeneration, are biochemically heterogeneous and are key to the understanding of AMD. However, their composition cannot be determined in vivo with even the current highest resolution techniques. While standard fundus photographs are a mixture of three color channels (RGB), the full retinal reflectance image to white light contains important spectral information that currently goes unexplored.
Considering that it has long been known that with monochromatic light the information contained in just two wavelengths can be used to detect macular pigment [2] or differentiate between oxy and deoxy-hemoglobin [3], there must potentially be significantly more power in hyperspectral imaging, which collects information from wavelengths across the visible spectrum. One major disadvantage of current available spectral imaging techniques is that they are fundamentally unsuitable for recording rapidly changing two-dimensional scenes as is required for imaging the moving eye. Hyperspectral ophthalmic imaging data, now uniquely clinically attainable with a new snapshot hyperspectral imaging device [3], offers a vision for spectral biopsy of the retina. By dissecting the spectral reflectance and autofluorescence signatures from drusen, other lesions, and anatomical regions, it is possible to achieve in vivo spectral discrimination of different lesion types and anatomical regions of interest. Identification of the distribution and biochemical signatures of the retina and its pathologic phenotype will be uniquely instrumental in understanding AMD.
This paper reports on the analysis of hyperspectral signatures of drusen and anatomical regions (i.e. the macula) in the presence of noise, image artifacts, and multiple mixed sources. The contribution of the paper is two-fold. First, we report on the statistical analysis of snapshot hyperspectral images of normal controls (n=3) and AMD patients (n=7) using non-negative matrix factorization (NMF) [4], [5], and [16]. Second, we propose and investigate the integration of physically meaningful priors into the NMF algorithm as well as a log-normalized transformation by column-wise standard deviation to account for the multiplicative reflectance in the retina and artifacts such as linear trends due to the imaging process. We also assess the reproducibility and consistency of our analysis.
II. Methodology
We will refer to a hyperspectral data cube with a matrix D = [x1, …, xm]. Consider a data cube D ∈ ℝx×y×z comprising observation measurements of a scene Dx×y at different conditions. In order to perform NMF analysis the data needs to be transformed to a two-dimensional matrix. A conceptual overview of NMF is outlined in figure 2. The Perron-Frobenius Theorem forms the theoretical basis for classical iterative methods in numerical analysis. If A is an n-by-n matrix and A ≥ 0, then ρ(A) is an eigenvalue of A and there is a non-negative vector y, with ||y|| = 1, s.t.
Fig. 2.

Conceptual view of non-negative matrix factorization (NMF) for the snapshot hyperspectral ophthalmic image cube.
| (3.1) |
NMF finds a “parts-based” or “sum-of-parts” linear representation of non-negative data. Given a non-negative data matrix D ∈ ℝn×m and a positive integer r = inf (n, m) the NMF problem is to compute a factorization of the form
| (3.2) |
with r being the low-rank factor usually with r < < n, m, and i, j, μ matrix indices. The r columns of W ∈ ℝn×r are basis vectors and each row of H ∈ ℝr×m the linear encoding representing the mixing coefficients or weights. In vector notation each of the m columns of D is a linear combination of the columns of W weighted by the coefficients of H, i.e.
| (3.3) |
where is wi the i-th column vector of W. The conventional approach to find a solution to (3.2) is to solve the following constrained optimization problem
| (3.4) |
where || · ||F is the matrix Frobenius norm. Various strategies have been proposed to minimize (3.4) such as alternating least-squares [6], multiplicative update rules [5], projected gradient descent algorithms [7], and hybrid derivatives. In addition to (3.5) other NMF derivatives have been proposed such as sparse [8], semi/convex [9], Bayesian [10], and derivatives.
In order to compute a solution to equation (3.4), which represents the underlying physiology of drusen or anatomic regions such as the macula we initialize NMF with physiologic meaningful basesW0 and spectral coefficients H0. In this paper we consider two cases: i) drusen and ii) the macula. Since spectral signatures of drusen are not known for case i) we set W0 to be a band that captures the drusen appearance in the hyperspectral data. For case ii) previous in vitro studies have established the absorbance and reflectance spectra of the macula [12], which we use as prior knowledge to set H0. To account for the multiplicative absorbance of the macula we apply a log-normalized transformation to the data cube.
III. Experiments and Results
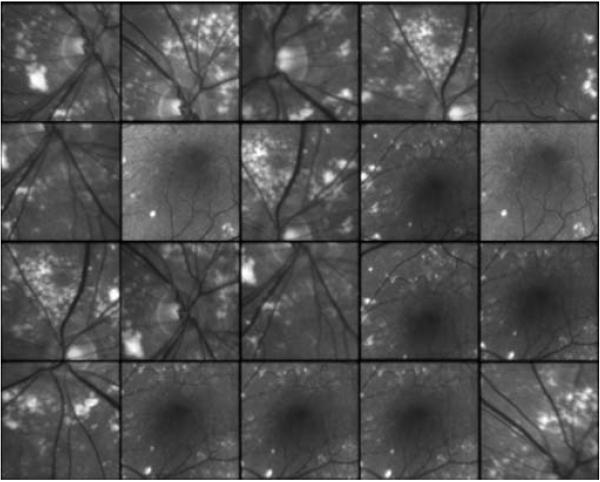
Seven patients with drusen and three normal controls were imaged with the snapshot hyperspectral camera previously described [3]. 20 random ROIs were acquired for patient C (see Fig. 3) and used for intra-patient NMF analysis. Within the 20 ROIs duplicates were introduced in order to assess reproducibility. Experiments for single and intra-patient NMF with and without prior knowledge were performed.
Fig 3.
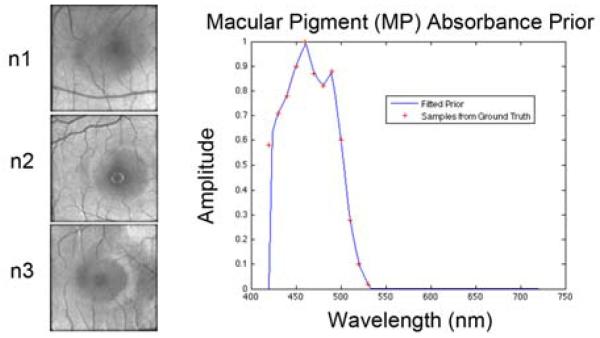
Examples of datasets. (TOP) Central slices of regions of interest (ROIs) for patient C. The indexing from ROI c1 to c20 is from top left to bottom right. (BOTTOM) Central slices of regions of interest (ROIs) for normal controls n1, n2, and n3 (n2 and n3 are both phakic). The plot shows the fitted in vitro macular density prior for NMF analysis.
In the first experiment we analyzed all patient cubes with different NMF decompositions from r = 2,…,10 and multiple trials t=10 using a random initialization scheme. The extracted basis vectors and spectral coefficients however were too sensitive to random initialization and thus will be omitted here due to space limitations.
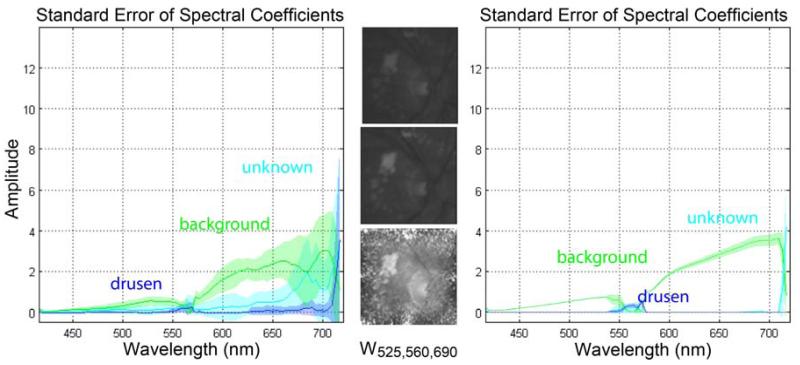
In the second experiment we performed NMF on all patient cubes by integrating physically meaningful prior knowledge about the data by initializing the NMF algorithm with a meaningful basis W0 and corresponding spectral coefficients H0. No preprocessing on the data was performed. Single NMF analysis of all patient cubes yielded spectral coefficients that showed a general trend in increasing spectral amplitudes of the non-drusen mixing coefficients. For all patient cubes the basis vector for mixing component 3 (drusen) depicted a physically meaningful basis with a peak response of the spectral coefficients around the 560nm region (see Fig. 4). The optimal number of basis vectors was determined experimentally. The recovered spectra were consistently similar for drusen and in different areas of the macula from the same eye and also in different eyes. We further performed statistical intra-patient analysis for patient C and n1, n2, and n3 to investigate the reproducibility and consistency of NMF with different types of drusen and on normal controls. Figure 4 shows the standard error of the spectral coefficients for 10 NMF trials with and without ROI stratification. The spectrum had low variability across different ROIs with a patient mean-standard error of σ=0.01 and between patients of σ=0.041.
Fig 4.
Intra-subject variability for different localized ROIs sampled from patient C. (LEFT) Spectral NMF coefficients for ROIs=c1-c20. Component 3 shows a response between the 550 and 600nm interval and high variability in the upper part of the wavelength spectrum. (CENTER) Slices at wavelength 525, 560, 690 nm. (RIGHT) Spectral NMF coefficients for ROIs=c2,c4,c8, c11,c20. After ROI stratification component 3 only shows a response peak around the 550nm region.
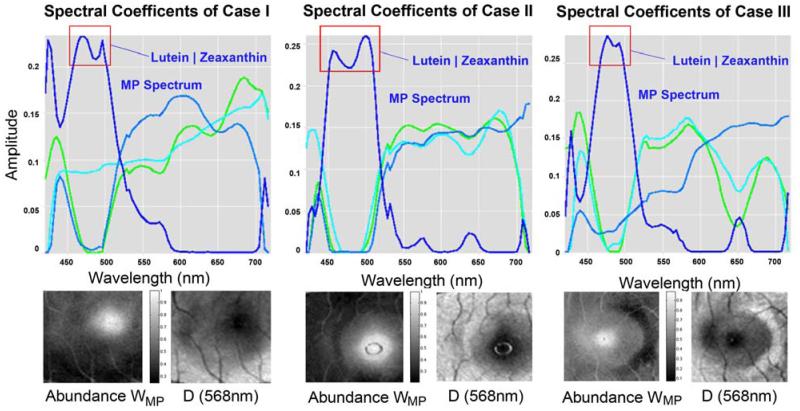
In the third experiment we investigated a physically meaningful prior of the macular pigment density as described in [12]. We compared NMF low-rank decompositions with and without prior information to investigate the consistency of the recovered spectral coefficients with physiologic ground truth. The data was log-normalized by column-wise standard deviation to account for the multiplicative absorbance of the macular pigment. Figure 5 shows the recovered macular density spectrum, which correspond well with the physiologic ground truth reported in [12]. In all normal controls the recovered macular density also shows the two characteristic peaks indicative of lutein and zeaxanthin the two carotenoids that constitute macula pigment. To our knowledge, this is the first reported demonstration in vivo of the separate absorbance peaks for both carotenoids in macular pigment.
Fig. 5.
Comparison of NMF on normal controls n1, n2, n5. (TOP) NMF using macula pigment (MP) density prior. In blue the recovered low-rank macular density. (BOTTOM) Extracted MP abundance and central slice at 568nm for each case. Red rectangle marks the two MP peaks.
IV. Related Work
Davis et al. [11] studied spectral characteristics that differentiated normal macular tissue from various types of genetic-based macular diseases and showed that in statistical terms hyperspectral images of the macula and other retinal tissues can be used to spectrally differentiate different forms of AMD. Not much work has been reported on central issues on optimal data preprocessing methods and their effect on downstream analysis of NMF. Yet the importance of optimal data preprocessing has been emphasized by several researchers in the field. Normalization methods include data centering, standardization and mean subtraction of rows and columns in separation or together. Getz et al. [13] proposed a normalization method by first dividing each column by its mean value and then normalizing each row. Kim and Tidor [14] proposed two data folding methods. Xue et al. [15] proposed a clustering-based initialization for NMF.
V. Conclusion
Snapshot hyperspectral images analyzed with NMF, which imposes physically realistic positivity constraints on the mixing process recovered spectral profiles that reliably identified drusen and the macula. Our results suggest that hyperspectral imaging can detect biochemically meaningful components of drusen and anatomical regions. In future work we plan to extend our analysis to other anatomic regions, as well as other drusen types.
Fig. 1.

Central slices of hyperspectral ophthalmic imaging cubes at 568nm representing different regions of the retina. Images are color coded.
Acknowledgments
This work was supported by the National Eye Institute (NEI) (R01 EY015520), the New York Community (RTS), and unrestricted funds from Research to Prevent Blindness (RPB).
Contributor Information
Noah Lee, Heffner Biomedical Imaging Laboratory (HBIL) and the Department of Biomedical Engineering, Columbia University, New York, NY 10027 USA (phone: 212-854-5996; fax: 212-854-5995); nl2168@columbia.edu.
J. Wielaard, Laboratory for Intelligent Imaging and Neural Computing (LIINC) and the Department of Ophthalmology and Biomedical Engineering, Columbia University, New York, NY 10027 USA; djw21@columbia.edu
A. A. Fawzi, Doheny Eye Institute, University of Southern California, Los Angeles, CA 90033 USA (AFawzi@doheny.org)
P. Sajda, Laboratory for Intelligent Imaging and Neural Computing (LIINC) and the Department of Ophthalmology and Biomedical Engineering, Columbia University, New York, NY 10027 USA; ps629@columbia.edu
A. F. Laine, Heffner Biomedical Imaging Laboratory (HBIL) and the Department of Biomedical Engineering, Columbia University, New York, NY 10027 USA (phone: 212-854-5996; fax: 212-854-5995); laine@columbia.edu
G. Martin, Reichert Ophthalmic Instruments Inc., Depew, NY 14043 USA; gmartin@reichert.com
M. S. Humayun, Department of Biomedical Engineering and Cell and Neurobiology, and the Doheny Eye Institute, University of Southern California, Los Angeles, CA 90033 USA; humayun@usc.edu
Prof. R. T. Smith, Department of Ophthalmology, Columbia University, New York, NY 10027 USA; rts1@columbia.edu
REFERENCES
- [1].Lee N, Laine A, Smith RT. A hybrid segmentation approach for geographic atrophy in fundus auto-fluorescence images for diagnosis of age-related macular degeneration; Proc. of 29th Int. Conf of the IEEE, EMBS; Lyon, France. 2007; pp. 1140–1143. [DOI] [PubMed] [Google Scholar]
- [2].Hammond BR, Fuld K. Interocular differences in macular pigment density. Inv. Ophthal. & Vis. Science. 1992;33(2):350355. [PubMed] [Google Scholar]
- [3].Johnson WR, et al. Spatial-spectral modulating snapshot hyperspectral imager. Applied Optics. 2006;45(9):18981908. doi: 10.1364/ao.45.001898. [DOI] [PubMed] [Google Scholar]
- [4].Sajda P, Du S, Brown TR, Stoyanova R, Shungu DC, Mao X, Parra LC. Non-negative matrix factorization for rapid recovery of constituent spectra in magnetic resonance chemical shift imaging of the brain. IEEE Trans on Med Imaging. 2004;23(12):1453–1465. doi: 10.1109/TMI.2004.834626. [DOI] [PubMed] [Google Scholar]
- [5].Lee D, Seung H. Learning the parts of objects by non-negative matrix factorization. Nature. 1999;401:788–791. doi: 10.1038/44565. [DOI] [PubMed] [Google Scholar]
- [6].Kim H, Park H. Sparse non-negative matrix factorizations via alternating non-negativity-constrained least squares for microarray data analysis. Bioinformatics. 2007;23(12):1495–1502. doi: 10.1093/bioinformatics/btm134. [DOI] [PubMed] [Google Scholar]
- [7].Lin CJ. Projected gradient methods for nonnegative matrix factorization. Neural Computation. 2007;19(10):2756–2779. doi: 10.1162/neco.2007.19.10.2756. [DOI] [PubMed] [Google Scholar]
- [8].Hoyer PO. Non-negative matrix factorization with sparseness constraints. J. Machine Learning Res. 2004;5:1457–1469. [Google Scholar]
- [9].Ding C, Li T, Jordan MI. Convex and semi-nonnegative matrix factorizations. IEEE Trans. on Pattern Analysis and Machine Intelligence. 2010;32(1):45–55. doi: 10.1109/TPAMI.2008.277. [DOI] [PubMed] [Google Scholar]
- [10].Schmidt MN, Winther O, Hansen LK. Bayesian non-negative matrix factorization. Proc. of Independent Component Analysis and Signal Separation. 2009:540–547. [Google Scholar]
- [11].Davis B, Russell S, Abramoff M, Nemeth SC, Barriga ES, Soliz P. Identification of spectral phenotypes in age-related macular degeneration patients. Progress in biomedical optics and imaging. 2007;8 [Google Scholar]
- [12].Hammond BR, Wooten BR, Smollon B. Assessment of the validity of in vivo methods of measuring human macular pigment optical density. Optom Vis Sci. 2005;82:387–404. doi: 10.1097/01.OPX.0000162652.85875.D2. [DOI] [PubMed] [Google Scholar]
- [13].Getz G, Levine E, Domany E. Coupled two-way clustering analysis of gene microarray data. Proc. Natl Acad Sci USA. 2000;97(22):12079–84. doi: 10.1073/pnas.210134797. [DOI] [PMC free article] [PubMed] [Google Scholar]
- [14].Kim PM, Tidor B. Subsystem identification through dimensionality reduction of large-scale gene expression data. Genome Res. 2003;13(7):1706–18. doi: 10.1101/gr.903503. [DOI] [PMC free article] [PubMed] [Google Scholar]
- [15].Xue Y, Tong CS, Chen Y, Chen WS. Clustering-based initialization for non-negative matrix factorization. Applied Mathematics and Computation. 2008;205(2):525–536. [Google Scholar]
- [16].Sajda P, Du S, Parra L. Proc. of SPIE. San Diego, CA: 2003. Recovery of constituent spectra using non-negative matrix factorization; pp. 321–331. [Google Scholar]


