

Abstract
Anxiety is one of the most commonly reported psychiatric conditions, but its pathogenesis is poorly understood. Ailments associated with activation of the innate immune system, however, are increasingly linked to anxiety disorders. In adult male mice, we found that adenosine doubled caspase-1 activity in brain by a pathway reliant on ATP-sensitive potassium (KATP) channels, protein kinase A (PKA) and the A2A adenosine receptor (AR). In addition, adenosine-dependent activation of caspase-1 increased interleukin (IL)-1β in the brain by two-fold. Peripheral administration of adenosine in wild-type (WT) mice led to a 2.3-fold increase in caspase-1 activity in the amygdala and to a 33% and 42% reduction in spontaneous locomotor activity and food intake, respectively, that were not observed in caspase-1 knockout (KO), IL-1 receptor type 1 (IL-1R1) KO and A2A AR KO mice or in mice administered a caspase-1 inhibitor centrally. Finally, adenosine administration increased anxiety-like behaviors in WT mice by 28% in the open field test and by 55% in the elevated zero-maze. Caspase-1 KO mice, IL-1R1 KO mice, A2A AR KO mice and WT mice treated with the KATP channel blocker, glyburide, were resistant to adenosine-induced anxiety-like behaviors. Thus, our results indicate that adenosine can act as an anxiogenic by activating caspase-1 and increasing IL-1β in the brain.
Keywords: none that are not included in title or abstract
Introduction
With a lifetime prevalence of nearly 18% (Kessler et al., 2005), anxiety disorders including generalized anxiety disorder (GAD), obsessive-compulsive disorder (OCD), panic disorder and post-traumatic stress disorder (PTSD) are among the most common psychiatric conditions suffered by Americans and Europeans (Kessler et al., 2005, WHO 2000). In humans, the pathogenesis of anxiety is poorly understood but recently new triggers of anxiety have been described including oxidative stress (Rammal et al., 2008) and inflammation (Pitsavos et al., 2006).
Common to these intertwined physiologic processes is the generation of the pleotropic cytokine IL-1β (Buttke & Sandstrom, 1994, Donath et al., 2008). IL-1β is not only a regulator of innate immunity, angiogenesis and hematopoiesis but also influences brain-based processes including cognition, locomotion, anorexia and anxiety (Johnson et al., 2007, Dantzer et al., 2008, Pugh et al., 2001). Canonically, IL-1β exists intracellularly as a pro-form that is cleaved to its mature secretable polypeptide by caspase-1, as part of the multiprotein inflammasome (Damiano et al., 2004, Bauernfeind et al., 2009). Signals that activate the inflammasome are varied but potassium (K+) efflux is a key event that is especially relevant to the oligomerization and activation of the NLRP3 inflammasome (Pétrilli et al., 2007).
The amygdala is central to emotive learning (Hamann et al., 1999) and appears critical to the aversive state that characterizes anxiety (Davis, 1992). Recently, we demonstrated that the purine nucleoside, adenosine, released from cells during oxidative stress activates caspase-1 in the amygdala (Chiu et al., 2012). There are four described ARs that respond to extracellular adenosine (Fredholm et al., 2001) with the A2A AR being preferentially expressed in the amygdala when compared to the hippocampus (Rosin et al., 1998). As a stimulatory G protein-coupled receptor (GPCR), the A2A AR is a well described inducer of K+ efflux. In the brain, A2A AR-dependent K+ efflux has been linked to KATP channels downstream of PKA (Kleppisch & Nelson, 1995), as part of a hyperpolarization protection mechanism that guards against neuronal excitotoxicity (Popoli et al., 2002). Therefore, this mechanism that helps guard against neuronal damage and death may also be an early activator of the neuroimmune system.
Adenosine is tied to certain behaviorally-related functions including the regulation of sleep (Portas et al., 1997), arousal (Lin et al., 1997) and memory (Pereira et al., 2005). Normally, the cerebral concentration of extracellular adenosine is highest during wakefulness (30 nM) than during sleep (24 nM) (Porkka-Heiskanen, 1997, Huston et al., 1996). However, in instances of an inflammatory response induced by ischemia, hypoxia and sepsis (Martin et al., 2000, Robertson et al., 2001, Gorlach, 2005), the extracellular concentration of adenosine can easily exceed 50 μM, upwards of 1000-fold increase from physiological levels (Hagberg et al., 1987). Therefore, we examined the mechanism by which adenosine activates caspase-1 in the brain and if adenosine triggers anxiety-like behavior via a mechanism reliant on IL-1β.
Methods
Materials
All reagents and chemicals were purchased from Sigma-Aldrich (St Louis, MO) except as noted. All qPCR assays were purchased from Applied Biosystems (Foster City, CA).
Animals
Animal use was conducted in accordance with Institutional Animal Care and Use Committee approved protocols at the University of Illinois. C57BL/6J (C57 WT) and BALB/cJ (BALB/c WT), IL-1R1 knock-out (IL-1R1 KO) on a C57BL/6J background and A2A AR KO mice on a BALB/cJ background were originally purchased from The Jackson Laboratory (Bar Harbor, ME). Caspase-1 KO (Casp-1 KO) mice on a C57BL/6J background were kindly provided by Dr. Richard Flavell (Yale University School of Medicine (Kuida et al., 1995)). Mice were group housed (×8 cage) in standard shoebox cages (length 46.9 cm; width 25.4 cm; height 12.5 cm) and allowed water and food ad libitum. Housing temperature (72 °F) and humidity (45–55%) were controlled, as was a 12/12 h reversed dark-light cycle (2200–1000 h). Video recording of animal behavior was performed under red light using a Sony HDR-XR500V Night Shot capable video camera (Tokyo, Japan). Except for locomotor activity which was performed as a repeated measure, all treatments and time points represent separate cohorts of mice. Mice were between 8 and 14 weeks of age and the total number of mice utilized was 434.
Perfusions
As we have described (Chiu et al., 2012), mice were euthanized via CO2 asphyxiation and the left ventricle immediately was pieced with a BD 23 gage 1.25 inch needle (Franklin Lakes, NJ) attached to a BD 30 mL syringe. Mice, as indicated, were perfused with 30 mL of PBS (3 mM KCl, 138 mM NaCl, 8 mM dibasic sodium phosphate, 2 mM monobasic potassium phosphate, pH of 7.4) with or without 50 μM adenosine, 1 μM 8-(3-chlorostyryl)caffeine (CSC), 100 nM KT5720 or 200 μM glyburide. For studies in which mice were perfused with a high concentration of K+, PBK (130 mM KCl, 3.5 mM NaCl, 1.5 mM dibasic sodium phosphate, 2 mM monobasic potassium phosphate, pH of 7.4) was substituted for PBS, as indicated.
Caspase-1 activity
As we have described (Chiu et al., 2012), perfused whole brains were frozen in liquid nitrogen then freeze fractured in a reaction buffer containing 50 mM NaCl (Fisher Scientific, Fair Lawn, NJ), 10% glycerol, 1 mM DTT, 1 mM EDTA, 1 mM bestatin, 1 mM pepstatin (EMD4Bioscience, Darmstadt, Germany), 1 mM 4-(2-aminoethyl)benzenesulfonyl fluoride hydrochloride and 50 mM HEPES, pH 7.4 (USB Corporation, Cleveland, OH) using a Qiagen TissueLyser II (Valencia, CA). Lysates were clarified at 16,000 × g for 15 min at 4° C and the supernatant protein concentrations determined using the Bio-Rad DC Protein Assay (Hercules, CA) and a BioTek ELx800 Absorbance Microplate Reader (Winooski, VT). Supernatant protein concentrations were normalized to 10 mg/ml with reaction buffer. Caspase-1 activity was determined colorimetrically in the clarified lysates using the caspase-1 substrate Ac-YVAD-p-nitroaniline (p-NA) (Enzo Life Science, Farmingdale, NY) at a final concentration of 4 mM. Substrate incubation was at 37° C for the times indicated. Moles of p-NA liberated was determined by a standard curve ranging from 0.075 mM to 0.3 mM p-NA (Enzo Life Science, Farmingdale, NY). Caspase-1 activity was calculated as (Δ[p-NA]/Δ time)/(total protein). Results are expressed as relative change from control.
PKA activity
Perfused whole brains were frozen in liquid nitrogen then freeze fractured in reaction buffer containing 50 mM NaF, 50 mM β-glycerolphosphate, 2 mM EDTA, 1 mM NaVO4, 5 mM EGTA, 1 mM DTT, 1 mM benzamidine, 10% glycerol, 1:200 Calbiochem Protease Inhibitor Cocktail III (Darmstadt, Germany), 1 mM phenylmethysulfonyl fluoride (PMSF) and 50 mM HEPES, pH 7.4 using the TissueLyser II. Lysates were clarified and supernatant protein concentrations normalized to 10 mg/ml with reaction buffer, as above. PKA activity was determined using the Enzo Life Science PKA Kinase Activity Kit. In brief, samples were incubated with the kit-provided substrate coated plate for 90 min and phosphorylated tetramethylbenzidine measured spectrophotometrically at 450 nm. Results are expressed as relative change from control.
cAMP concentration
Perfused whole brains were frozen in liquid nitrogen then freeze fractured in reaction buffer containing 138 mM NaCl, 8 mM Na2HPO4, 2 mM KH2PO4, 3 mM KCl, 50 mM NaF, 50 mM β-glycerolphosphate, 2 mM EDTA, 1 mM NaVO4, 5 mM EGTA, 1 mM benzamindine, 10% glycerol, 1:200 Calbiochem Protease Inhibitor Cocktail III, 1 mM PMSF, 500 μM 3-isobutyl-1-methylxanthine, 100 μM RO201724 and 50 mM HEPES, pH 7.4 using the TissueLyser II. Lysates were clarified and supernatant protein concentrations normalized to 10 mg/ml with reaction buffer, as above. cAMP concentration was determined using the Promega cAMP-Glo Assay (Madison, WI). In brief, samples were incubated for 30 min and the methyl ester luciferin/luciferase reaction quantified using a Fuji LAS-4000 Imaging System (Tokyo, Japan).
IL-1β concentration
As above, perfused whole brains and livers were frozen in liquid nitrogen then freeze fractured in a homogenization buffer containing 50 mM NaCl, 10% glycerol, 1:200 Calbiochem Protease Inhibitor Cocktail III and 50 mM HEPES, pH 7.4 using the TissueLyser II. Lysates were clarified and supernatant protein concentrations measured as above. IL-1β was measured in 50 μL of lysate using the Bio-Rad Bio-Plex Promouse Cytokine Group I Cytokine Assay and the Milliplex Mouse Cytokine/Chemokine Magnetic Bead Panel on a Luminex 100 System (Austin, TX) by methods similar to those we have described (Chiu et al., 2012). The Luminex 100 System was validated and calibrated using the Bio-Plex validation Kit 4.0 on the day of assay. Results are expressed as relative change from control.
Quantitative PCR (qPCR)
As we have described (Chiu et al., 2012, York et al., 2012), RNA was isolated from perfused whole brains. RNA was reverse transcribed using the Applied Biosystems High-Capacity cDNA Reverse Transcription Kit (PN 4368813). The Applied Biosystems TaqMan Gene Expression primers used were: A2A AR (Mm00802075_m1), IL-1α (Mm99999060_m1), IL-1β (Mm99999061_mH), IL-1 receptor type 1 (IL-1R1) (Mm01226959_m1), IL-1 receptor type 2 (IL-1R2) (Mm00439622_m1), IL-1 receptor antagonist (Il-1RA) (Mm01337566_m1) and caspase-1 (Mm00438023_m1). qPCR was performed on a Applied Biosystems 7900 HT Fast Real-Time PCR System using Applied Biosystems TaqMan Universal PCR Master Mix. To compare gene expression, a parallel amplification of endogenous RPS3 (Mm00656272_m1) was performed. Reactions with no reverse transcription and no template were included as negative controls. Relative quantitative evaluation of target gene to RPS3 was performed by comparing ΔCts, where Ct is the threshold concentration determined automatically by SDS software (Applied Biosystems, version 2.4). ΔCts are determined by Ct Target gene - Ct RPS3. ΔΔCt Target gene is determined by subtracting ΔCt sample by average ΔCt of control. Relative fold change is determined by the equation 2−ΔΔCt. The upper fold error bar is determined by the equation 2−ΔΔCt-standard error – relative fold change. Statistical analysis was determined by using ΔΔCt.
Serum adenosine
500 μL of blood was mixed 1:2 with 138 mM NaCl, 8 mM Na2HPO4, 2 mM KH2PO4, 3 mM KCl, 5.9 mM NaHCO3, 5.6 mM dextrose, 2.15 mM CaCl2, 1% DMSO, and 120 μM dipyridamole. Samples were centrifuged at 3650 × g for 10 min at 4° and proteins precipitated by addition of 2% v/v of 70% (12N) perchloric acid with re-centrifuged at 3650 × g for 10 min at 4°C. Adenosine was determined on a 5500 QTRAP LC/MS/MS (AB Sciex, Foster City, CA) with a 1200 series HPLC (Agilent Technologies, Santa Clara, CA). LC separation was performed on a Phenomenex Kinetex 2.6 u PFP column (4.6 × 100mm) (Torrence, CA). Mobile phase A was 0.1% formic acid in water. Mobile phase B was 0.1% formic acid in acetontrile. Flow rate was 0.3 mL/min and the linear gradient was: 0-1 min, 100% A; 5 min, 90% A; 10 min, 80% A; 12-18 min, 0% A; and 18.5-25 min, 100% A with an auto-sampler temperature of 5°C. The injection volume was 5 μL. Mass spectra were acquired with positive electrospray ionization with an ion spray voltage of 5500 V at a source temperature of 450 °C. The curtain gas, ion source gas 1 and ion source gas 2 were 35, 50, and 65, respectively. Multiple reaction monitoring was used to quantify adenosine m/z 268.1 --> m/z 136.1, inosine m/z 269.1 --> m/z 137.1 and internal standard caffeine m/z 195.1 --> m/z 138.1.
Injectables
Adenosine (Akorn, Lake Forest, IL) in PBS was administered IP at a dose of 2 mg/kg/mouse. Glyburide in 2%DMSO/PBS was administered IP at a dose of 6.6 mg/kg/mouse. Ac-YVAD-CMK (Bachem, Torrance, CA) was administered ICV, as we have described (Johnson et al., 2007, Chiu et al., 2012), at a dose of 50 ng/uL/mouse, 30 min prior to IP adenosine injection.
ICV cannulation
As we have described (Johnson et al., 2007, Chiu et al., 2012), mice were anesthetized with an IP injection of sodium ketamine hydrochloride/xylazine hydrochloride solution delivering 80 mg/kg ketamine and 12 mg/kg xylazine. Animals were placed in a David Kopf Instruments stereotaxic instrument (Tujunga, CA), Plastics One mouse-specific brain infusion cannulas (Roanoke, VA) were placed 0.6 mm posterior, 1.5 mm lateral to the bregma and to extend 2.5 mm ventral from the surface of the skull. Cannulas were fixed to the skull with Plastics One cyanoacrylate gel adhesive and protected by a Plastics One guard. Mice were allowed 7 days to recover prior to treatment. Injection site was stained with 0.4% trypan blue to ensure proper cannula placement.
Locomotion
Spontaneous locomotor activity was measured by continuous videography followed by analysis with automated video tracking software (Noldus Information Technology EthoVision XT 7 (Leesburg, VA)), as we have described (York et al., 2013). Immediately after treatment, mice were video recorded in their home cage for 60 min. Distance moved was binned into consecutive 15 min intervals. Results are presented as percent control.
Food intake
Immediately after adenosine injection, mice were allowed ad libitum access to food in a 6 cm diameter × 1.5 cm glass bowl for 60 min. As we have described (York et al., 2012), food consumption was calculated as the difference in weight of food before and after. Results are presented as percent control.
Open field test
Open field testing was performed as we have described (York et al., 2012). In brief, mice were placed in a novel open field arena (66 cm length × 45.7 cm width × 22.9 cm height) 30 min after adenosine injection. Lighting was positioned to create a 9 cm shadow from each side wall. Mice were video recorded for the times indicated. Total distance traveled, time spent in the non-shadowed and shadowed areas of the arena were determined using Noldus Information Technology EthoVision XT 7. Percent of time (sec) in the non-shadowed area (center) was calculated by dividing time spent in the center by total time (300 sec) in the arena. Results are presented as percent control.
Elevated zero-maze
Elevated zero-maze testing was performed as we have described (York et al., 2012). In brief, 30 min after adenosine injection mice were placed in a circular elevated zero-maze (22.5 cm in diameter, track width of 2.75 cm, elevated 33 cm above the floor). The maze was divided into two open quadrants and two enclosed quadrants. Mice were video recorded for 5 min. Total distance traveled, time spent in the open and closed arms of the maze were determined using Noldus Information Technology EthoVision XT 7. Percent of time (sec) in the open area was calculated by dividing time spent in the center by total time (300 sec) in the arena. Results are presented as percent control.
Statistics
All data are presented as mean ± SEM. Data was analyzed using Sigma Plot 11.2 (Systat Software, Chicago, IL). To test for statistical differences, a one-way or two-way ANOVA was with repeated measurements where needed. Tukey’s test was used for post-hoc pair-wise multiple comparison procedures. Where indicated, raw data was transformed to attain equal variance. Statistical analysis included testing for time × treatment interactions when needed. Statistical significance was denoted at p<0.05.
Results
Inhibition of potassium efflux prevents adenosine-dependent activation of caspase-1 in the brain
Mice were perfused with or without 50 μM adenosine as indicated. Fig.1A demonstrates that activation of caspase-1 by adenosine is prevented when adenosine is coperfused with 130 mM K+ (PBK) when compared to 3 mM K+ (PBS). Main effect of interaction, p < 0.001 (PBK vs. adenosine + PBK, 1.07 ± 0.10 vs. 0.93 ± 0.09, p = 0.563: PBS vs. adenosine + PBS, 1.00 ± 0.06 vs. 2.29 ± 0.32, p < 0.001: PBS vs. PBK, 1.00 ± 0.06 vs. 1.07 ± 0.10, p = 0.776: adenosine +PBS vs. adenosine + PBK, 2.29 ± 0.32 vs. 0.93 ± 0.09, p < 0.001). {Raw values: PBS (30.43 ± 3.24 μM/hr), PBK (32.70 ± 4.06μM/hr), adenosine + PBS (67.58 ± 6.88) μM/hr, adenosine + PBK (28.23 ± 3.96 μM/hr)}. Fig. 1B shows that activation of caspase-1 by adenosine is blocked when adenosine is co-perfused with the KATP channel blocker, glyburide. Main effect of adenosine, p = 0.008 (glyburide vs. adenosine + glyburide, 1.06 ± 0.26 vs. 1.29 ± 0.16, p = 0.427: PBS vs. adenosine + PBS, 1.00 ± 0.14 vs. 1.88 ± 0.18, p = 0.003: PBS vs. glyburide (1.00 ± 0.14 vs. 1.06 ± 0.26, p = 0.806: adenosine vs. adenosine + glyburide, 1.88 ± 0.18 vs. 1.29 ± 0.16, p = 0.036). {Raw values: PBS (50.65 ± 14.07μM/hr), adenosine + PBS (88 ± 18.23 μM/hr), glyburide (59.68 ± 24.81 μM/hr), adenosine + glyburide (59.14 ± 24.48 μM/hr)}.
Fig.1. Inhibition of potassium efflux prevents adenosine-dependent activation of caspase-1 in the brain.

(A) Wild type mice were perfused with or without PBK and/or adenosine and activity of caspase-1 measured. Results are expressed as means ± s.e.m.; n = 4. Bars without a common superscript are different (P < 0.05). (B) Wild type mice were perfused with or without glyburide and/or adenosine and activity of caspase-1 measured. Results are expressed as means ± s.e.m.; n = 4. Bars without a common superscript are different (P < 0.05).
The PKA inhibitor KT5720 blocks activation of caspase-1 by adenosine
Mice were perfused with or without 50 μM adenosine as indicated. Fig.2A shows that activation of caspase-1 by adenosine is blocked when adenosine is co-perfused with KT5720. Main effect of interaction, p = 0.004 (KT5720 vs. adenosine + KT5720, 1.07 ± 0.20 vs. 1.15 ± 0.13, p = 0.701: PBS vs. adenosine, 1.00 ± 0.07 vs. 2.13 ± 0.17, p < 0.001: PBS vs. KT5720, 1.00 ± 0.07 vs. 1.07 ± 0.20, p = 0.755: adenosine vs. adenosine + KT5720, 2.13 ± 0.17 vs. 1.15 ± 0.13, p < 0.001). {Raw values: PBS (91.98 ± 6.29μM/hr), adenosine (196.02 ± 16.18 μM/hr), KT5720 (98.43 ± 18.89 μM/hr), adenosine + KT5720 (105.91 ± 11.84 μM/hr)}. Fig.2B&C demonstrate that PKA activity and the concentration of cAMP are increased in the brain after adenosine perfusion, respectively (saline vs. adenosine, 1.00 ± 0.11 vs. 1.69 ± 0.29, p = 0.037: saline vs. adenosine, 1.00 ± 0.02 vs. 1.64 ± 0.19, p = 0.015). {Raw values: PKA activity: saline (0.00056 ± 0.00011 405 nm/μg of protein), adenosine (0.00091 ± 0.00028 405 nm/μg of protein), cAMP: saline (32532.07 ± 803.17 AU), adenosine (20538.62 ± 2037.11 AU)}.
Fig.2. The PKA inhibitor KT5720 blocks activation of caspase-1 by adenosine.

(A) Wild type mice were perfused with or without KT5720 and/or adenosine and activity of caspase-1 measured. Results are expressed as means ± s.e.m.; n = 4. Bars without a common superscript are different (P < 0.05). (B) Wild type mice were perfused with or without adenosine and activity of PKA. Results are expressed as means ± s.e.m.; n = 4. Bars without a common superscript are different (P < 0.05). (C) Wild type mice were perfused with or without adenosine and the concentration of cAMP measured. Results are expressed as means ± s.e.m.; n = 4. Bars without a common superscript are different (P < 0.05).
Activation of caspase-1 by adenosine is blocked by selective A2A AR antagonism and in A2A AR KO mice
Mice were perfused with or without 50 μM adenosine as indicated. Fig.3A shows that activation of caspase-1 by adenosine is prevented when adenosine is co-perfused with the selective A2A AR antagonist CSC. Main effect of interaction, p < 0.001 (CSC vs. adenosine + CSC, 1.23 ± 0.15 vs. 1.08 ± 0.06, p = 0.196: PBS vs. adenosine, 1.00 ± 0.05 vs. 1.77 ± 0.05, p < 0.001: PBS vs. CSC, 1.00 ± 0.05 vs. 1.23 ± 0.15, p = 0.05: Adenosine vs. adenosine + CSC, 1.77 ± 0.05 vs. 1.08 ± 0.06, p < 0.001). {Raw values: PBS (49.20 ± 4.89 μM/hr), CSC (76.75 ± 9.09 μM/hr), adenosine (75.45 ± 3.46 μM/hr), adenosine + CSC (46.03 ± 2.94 μM/hr)}. Fig.3B demonstrates that A2A AR KO mice are protected from adenosine-dependent activation of caspase-1. Main effect of interaction, p = 0.015 (A2A AR KO vs. adenosine in A2A AR KO, 0.90 ± 0.21 vs. 1.01 ± 0.19, p = 0.610: WT vs. adenosine in WT, 1.00 ± 0.08 vs. 1.83 ± 0.29, p < 0.001: WT vs. A2A AR KO, 1.00 ± 0.084 vs. 0.90 ± 0.21, p = 0.553: adenosine in WT vs. adenosine in A2A AR KO, 1.83 ± 0.29 vs. 1.01 ± 0.19, p = 0.001). {Raw values: WT (124.4 ± 19.03 μM/hr), adenosine in WT (259.13 ± 59.56 μM/hr), A2A AR KO (73.07 ± 9.37 μM/hr), adenosine in A2A AR KO (84.25 ± 9.23 μM/hr)}. Fig.3C demonstrates that caspase-1 KO mice have a 72% reduction in caspase-1 activity in the caspase-1 activity assay utilized (WT vs. caspase-1 KO, 1.00 ± 0.17 vs. 0.28 ± 0.09, p = 0.01). {Raw values: WT (106.18 ± 17.87 μM/hr), Casp-1 KO (30.25 ± 9.74 μM/hr)}.
Fig.3. Activation of caspase-1 by adenosine is blocked by selective A2A AR antagonism and in A2A AR KO mice.

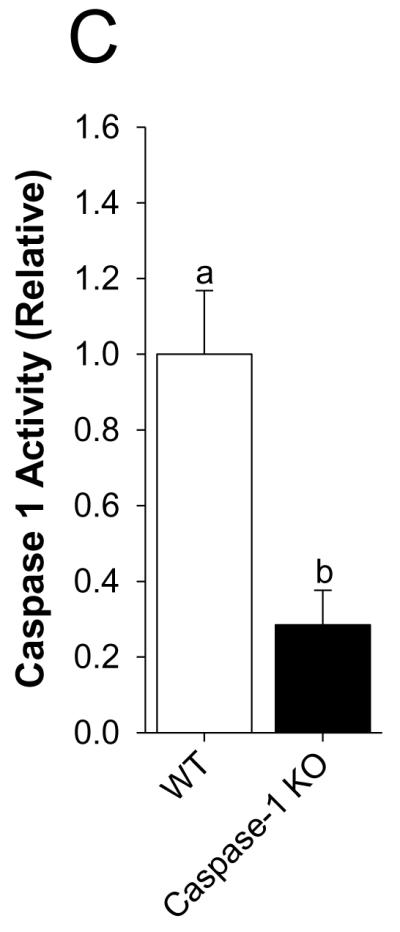
(A) Wild type mice were perfused with or without 8-(3-chlorostyryl)caffeine (CSC) and/or adenosine and activity of caspase-1 measured. Results are expressed as means ± s.e.m.; n = 4. Bars without a common superscript are different (P < 0.05). (B) Wild type and A2A AR KO mice were perfused with or without adenosine and activity of caspase-1 measured. Results are expressed as means ± s.e.m.; n = 4. Bars without a common superscript are different (P < 0.05). (C) Wild type and caspase-1 KO mice were perfused with PBS and activity of caspase-1 measured. Results are expressed as means ± s.e.m.; n = 4. Bars without a common superscript are different (P < 0.05).
Adenosine increases IL-1β protein in the brain but not the liver
Table 1 demonstrates increased IL-1β protein in the brain {Raw values: Control (0.53 ± 0.14 pg/mg/protein), Adenosine (1.24 ± 0.24 pg/mg/protein)} but not the liver {Raw values: Control (1.52 ± 0.45 pg/mg/protein), Adenosine (0.98 ± 0.23 pg/mg/protein)}, after adenosine perfusion. Adenosine did not induce gene transcripts for IL-1β, IL-1α, IL-1R1, IL-1R2, IL-1RA or caspase-1 (data not shown). Table 2 shows that relative gene expression of A2A ARs is greater in the amygdala than hippocampus.
Table 1.
Adenosine increases IL-1β protein in the brain but not the liver
| Tissue | Saline | Adenosine |
|---|---|---|
| Brain | 1.00 ± 0.16a | 2.43 ± 0.37 b |
| Liver | 1.00 ± 0.20a | 0.86 ± 0.23a |
Results are expressed as fold change means ± S.E.M; n=10. Values within a row without a common superscript are different; p< 0.05
Table 2.
Differential expression of A2A AR mRNA in the brain
| Regions | Fold Change |
|---|---|
| Whole Brain | 1.00 (0.12)a |
| Amygdala | 1.31 (0.38)a |
| Hippocampus | 0.13 (0.03)b |
Results are expressed as means (S.E.M.); n=4-6. Values without a common superscript are different; p< 0.05
Adenosine activates caspase-1 in the brain while reducing locomotor activity and food intake
Mice were IP administered 2 mg/kg adenosine as indicated. Fig.4A demonstrates that whole brain caspase-1 activity is increased by 33% 15 min after IP injection of adenosine (saline vs. adenosine, 1.00 ± 0.07 vs. 1.33 ± 0.02, p < 0.001). {Raw values: saline (106.55 ± 9.04 μM/hr), adenosine (141.79 ± 7.72 μM/hr)}. Fig.4B demonstrates that caspase-1 activity isolated from the amygdala is increased by 232% 15 min after IP injection of adenosine (saline vs. adenosine, 1.00 ± 0.10 vs. 2.32 ± 0.43, p = 0.018). {Raw values: saline (2.13 ± 0.21 μM/hr), adenosine (4.93 ± 0.92 μM/hr)}. Concordantly, Fig.4C shows that the serum adenosine concentration is increased by two-fold 15 min after IP injection of adenosine and returns to basal levels 75 min after injection (saline vs. adenosine, 0 min: 1.21 ± 0.35 μM vs. 1.11 ± 0.27 μM, p = 0.896; 15 min: 1.30 ± 0.11 μM vs. 2.18 ± 0.41 μM, p = 0.05; 45 min: 1.30 ± 0.24 μM vs. 2.33 ± 0.47 μM, p = 0.03; 75 min: 1.54 ± 0.32 μM vs. 1.75 ± 0.45 μM, p = 0.716). Fig.4D shows that in C57 WT mice adenosine decreases locomotor activity by 30% from 30 through 75 min post-injection (saline vs. adenosine: 0-15 min, 100.00 ± 6.24 vs. 98.32 ± 4.33, p = 0.823; 15-30 min, 100.00 ± 9.05 vs. 94.78 ± 8.05, p = 0.669; 30-45 min, 100.00 ± 15.94 vs. 67.48 ± 5.57, p = 0.05; 45-60 min, 100.00 ± 12.00 vs. 69.49 ± 6.97, p = 0.05, 60-75 min, 100.00 ± 8.96 vs. 64.93 ± 5.16, p = 0.006; 75-90 min, 100.00 ± 11.30 vs. 72.75 ± 8.32, p = 0.079; 90-105 min, 100.00 ± 11.76 vs. 112.01 ± 16.92, p = 0.590). {Raw values: saline: 0-15 min (1514.46 ± 94.48 cm), 15-30 min (1070.55 ± 96.87 cm), 30-45 min (826.00 ± 131.70 cm), 45-60 min (884.26 ± 106.16 cm), 60-75 min (1701.28 ± 383.92 cm), 75-90 min (1143.27 ± 319.01 cm), 90-105 min (1212.35 ± 421.00 cm), adenosine: 0-15 cm (1489.00 ± 65.62 cm), 15-30 cm (1015.64 ± 86.03 cm), 30-45 min (557.34 ± 46.00 cm), 45-60 min (614.46 ± 61.59 cm), 60-75 min (1688.21 ± 208.10 cm), 75-90 min (1432.31 ± 344.19 cm), 90-105 min (1595.24 ± 365.36 cm)}. Figs.4E&F demonstrate that caspase-1 KO and IL-1R1 KO mice are resistant to adenosine-dependent reductions in locomotor activity ((caspase-1 KO) saline vs. adenosine: 0-15 min, 100.00 ± 4.83 vs. 92.98 ± 4.56, p = 0.312; 15-30 min, 100.00 ± 9.00 vs. 109.76 ± 8.78, p = 0.454; 30-45 min, 100.00 ± 8.06 vs. 94.49 ± 13.48, p = 0.719; 45-60 min, 100.00 ± 11.41 vs. 89.95 ± 7.14, p = 0.596; (IL-1R1 KO) saline vs. adenosine: 0-15 min, 100.00 ± 8.64 vs. 113.26 ± 9.22, p = 0.319; 15-30 min, 100.00 ± 17.34 vs. 149.49 ± 21.96, p = 0.108; 30-45 min, 100.00 ± 22.57 vs. 149.48 ± 33.27, p = 0.298; 45-60 min, 100.00 ± 22.64 vs. 114.82 ± 22.20, p = 0.650). {Raw values: caspase-1 KO: saline: 0-15 min (1704.09 ± 82.32 cm), 15-30 min (1095.87 ± 98.64 cm), 30-45 min (857.56 ± 85.77 cm), 45-60 min (1097.17 ± 160.4 cm), adenosine: 0-15 min (1584.45 ± 77.64 cm), 15-30 min (1202.79 ± 96.33 cm), 30-45 min (810.28 ± 115.63 cm), 45-60 min (986.96 ± 78.32 cm), IL-1R1 KO: saline: 0-15 min (1532.48 ± 132.36 cm), 15-30 min (980.30 ± 169.96 cm), 30-45 min (881.31 ± 198.93 cm), 45-60 min (901.32 ± 204.04 cm), adenosine: 0-15 min (1735.62 ± 141.28 cm), 15-30 min (1465.49 ± 215.27 cm), 30-45 min (1317.40 ± 293.23 cm), 45-60 min (1034.92 ± 200.05 cm)}. Figs.4G&H show, respectively, that in BALB/c WT mice adenosine decreases locomotor activity by 50% 45 min after injection and that A2A AR KO mice are resistant to adenosine-dependent reductions in locomotor activity ((BALB/c WT) saline vs. adenosine: 0-15 min, 100.00 ± 20.94 vs. 83.31 ± 13.51, p = 0.455; 15-30 min, 100.00 ± 23.04 vs. 97.53 ± 13.09, p = 0.914; 30-45 min, 100.00 ± 17.70 vs. 105.83 ± 19.92, p = 0.803; 45-60 min, 100.00 ± 13.34 vs. 50.25 ± 18.87, p = 0.015; (A2A AR KO) saline vs. adenosine: 0-15 min, 100.00 ± 14.45 vs. 81.96 ± 10.97, p = 0.420; 15-30 min, 100.00 ± 11.45 vs. 102.00 ± 13.62, p = 0.931; 30-45 min, 100.00 ± 10.77 vs. 92.27 ± 15.19, p = 0.741; 45-60 min, 100.00 ± 4.41 vs. 95.48 ± 10.79, p = 0.808). {Raw values: WT: saline, 0-15 min (2347.96 ± 491.58 cm), 15-30 min (2247.11 ± 517.65 cm), 30-45 min (1887.45 ± 334.11 cm), 45-60 min (2197.83 ± 293.12 cm), adenosine, 0-15 min (1956.04 ± 317.23 cm), 15-30 min (2191.58 ± 294.05 cm), 30-45 min (1997.52 ± 376.03 cm), 45-60 min (1104.38 ± 414.78 cm), A2A AR KO: saline: 0-15 min (3026.65 ± 437.48 cm), 15-30 min (2676.35 ± 306.52 cm), 30-45 min (2545.34 ± 274.12 cm), 45-60 min (2619.78 ± 115.44 cm), adenosine: 0-15 min (2480.77 ± 331.92 cm), 15-30 min (2729.93 ± 364.46 cm), 30-45 min (2348.65 ± 386.54 cm), 45-60 (2501.48 ± 282.56 cm)}. Figs.4I&J demonstrate that caspase-1 KO mice, IL-1R1 KO mice and A2A AR KO mice are resistant to adenosine-dependent reductions in food intake ((C57 WT) saline vs. adenosine, 100.00 ± 10.91 vs. 58.33 ± 10.11, p = 0.006; (caspase-1 KO) saline vs. adenosine, 100.00 ± 9.45 vs. 150.00 ± 18.26, p = 0.029; (IL-1R1 KO) saline vs. adenosine, 100.00 ± 12.60 vs. 86.67 ± 15.07, p = 0.499; (BALB/c WT) saline vs. adenosine, 100.00 ± 12.48 vs. 61.14 ± 7.87, p = 0.006; (A2A AR KO) saline vs. adenosine, 100.00 ± 6.79 vs. 102.08 ± 9.13, p = 0.875). {Raw values: C57 WT: saline (0.20 ± 0.02 g), adenosine (0.12 ± 0.02 g), IL-1R1 KO: saline (0.30 ± 0.04 g), adenosine (0.26 ± 0.05 g), caspase-1 KO: saline (0.20 ± 0.02 g), adenosine (0.30 ± 0.04 g), BALB/c WT: saline (0.60 ± 0.07 g), adenosine (0.38 ± 0.06 g), A2A AR KO: saline (0.52 ± 0.04 g), adenosine (0.53 ± 0.05 g)}.
Fig.4. Adenosine activates caspase-1 in the brain while reducing locomotor activity and food intake.


(A) Wild type mice were treated with or without IP adenosine and activity of caspase-1 in brain measured 15 min after adenosine administration. Results are expressed as means ± s.e.m.; n = 4. Bars without a common superscript are different (P < 0.05). Data was analyzed using Kruskal-Wallis One Way Analysis of Variance on Ranks to attain equal variance. (B) Wild type mice were treated with or without IP adenosine and activity of caspase-1 in the amygdala measured 15 min after adenosine administration. Results are expressed as means ± s.e.m.; n = 4. Bars without a common superscript are different (P < 0.05). (C) Wild type mice were treated with or without IP adenosine and the serum adenosine concentration was measured at 15 min intervals. Results are expressed as means ± s.e.m. vs. saline injected control; n = 8-12. *p < 0.05 compared to saline control within time. (D) C57 WT mice were treated with or without IP adenosine and locomotion measured at 15, 30, 45, 60, 75, 90 and 105 mins after adenosine administration. Results are expressed as means ± s.e.m. versus saline injected controls; n = 8. *P < 0.05. (E) Caspase-1 KO mice were treated with or without IP adenosine and locomotion measured at 15, 30, 45 and 60 mins after adenosine administration. Results are expressed as means ± s.e.m. versus saline injected controls; n = 8. (F) IL-1R1 KO mice were treated with or without IP adenosine and locomotion measured at 15, 30, 45 and 60 mins after adenosine administration. Results are expressed as means ± s.e.m. versus saline injected controls; n = 8. (G) BALB/c WT mice were treated with or without IP adenosine and locomotion measured at 15, 30, 45 and 60 mins after adenosine administration. Results are expressed as means ± s.e.m. versus saline injected controls; n = 5. *P < 0.05. (H) A2A AR KO mice were treated with or without IP adenosine and locomotion measured at 15, 30, 45 and 60 mins after adenosine administration. Results are expressed as means ± s.e.m. versus saline injected controls; n = 5. (I) C57 WT, caspase-1 KO (Casp-1 KO) and IL-1R1 KO mice were treated with or without IP adenosine and food intake measured for 60 min following adenosine administration. Results are expressed as means ± s.e.m. versus saline injected controls; n = 5-8. *P < 0.05. (J) BALB/c WT and A2A AR KO mice were treated with or without IP adenosine and food intake measured for 60 min following adenosine administration. Results are expressed as means ± s.e.m. versus saline injected controls l; n = 8. *P < 0.05.
Central administration of the caspase-1 inhibitor Ac-YVAD-CMK blocks adenosine-induced reductions in locomotor activity and food intake
Mice were IP administered 2 mg/kg adenosine as indicated with or without co-administration of ICV Ac-YVAD-CMK. Figs.5A&B show that C57 WT administered Ac-YVAD-CMK ICV are protected from adenosine-induced decreases in locomotor activity and food intake, respectively ((locomotion) saline vs. adenosine: 0-15 min, 100.00 ± 10.92 vs. 61.14 ± 2.61, p = 0.013; 15-30 min, 100.00 ± 45.41 vs. 73.64 ± 5.48, p = 0.468; 30-45 min, 100.00 ± 31.94 vs. 36.08 ± 7.75, p = 0.009; 45-60 min, 100.00 ± 21.41 vs. 40.32 ± 5.42, p = 0.018; Ac-YVAD-CMK vs. adenosine: 0-15 min, 100.00 ± 13.50 vs. 74.39 ± 6.53, p = 0.080; 15-30 min, 100.00 ± 24.51 vs. 69.02 ± 10.93, p = 0.395; 30-45 min, 100.00 ± 12.09 vs. 93.17 ± 7.40, p = 0.868; 45-60 min, 100.00 ± 18.50 vs. 137.96 ± 14.10, p = 0.109; (food intake) saline vs. adenosine, 100.00 ± 9.62 vs. 53.33 ± 9.72, p = 0.012; Ac-YVAD-CMK vs. adenosine, 100.00 ± 21.25 vs. 104.17 ± 26.90, p = 0.905). {Raw values: saline: 0-15 min (2217.66 ± 242.14 cm), 15-30 min (2067.88 ± 939.06 cm), 60-45 min (2547.17 ± 813.48 cm), 45-60 min (2192.62 ± 469.49 cm), saline + adenosine: 0-15 min (1355.82 ± 57.88 cm), 15-30 min (1522.72 ± 113.31 cm), 30-45 min (919.12 ± 197.28 cm), 45-60 min (883.95 ± 118.85 cm), Ac-YVAD-CMK: 0-15 min (1708.85 ± 230.68 cm), 15-30 min (1332.14 ± 326.44 cm), 30-45 min (718.82 ± 86.93 cm), 45-60 min (935.94 ± 173.11 cm), Ac-YVAD-CMK + adenosine: 0-15 min (1271.14 ± 111.65 cm), 15-30 min (919.43 ± 145.56 cm), 30-45 min (669.72 ± 53.23 cm), 45-60 min (1291.23 ± 132.01 cm)}. Fig.5C demonstrates the location of ICV injection into the ventricle.
Fig.5. Central administration of the caspase-1 inhibitor Ac-YVAD-CMK blocks adenosine-induced reductions in locomotor activity and food intake.

(A) C57 WT mice were treated with or without ICV Ac-YVAD-CMK and IP adenosine. Locomotion was measured at 0, 15, 30 and 45 mins after adenosine administration. Results are expressed as means ± s.e.m.; n = 5. Bars without a common superscript are different (P < 0.05). (B) C57 WT mice were treated with or without ICV Ac-YVAD-CMK and IP adenosine. Food intake was measured for 60 min after adenosine administration. Results are expressed as means ± s.e.m.; n = 5. Bars without a common superscript are different (P < 0.05). (C) 0.4% trypan blue was administered ICV. Brains were harvested bisected and photographed fresh (representaitive).
Adenosine causes anxiety-like behavior
Mice were IP administered 2 mg/kg adenosine as indicated. Fig.6A shows that mice administered adenosine 30 min prior to open field testing exhibited a 28% decrease in percentage of time spent in the center area while caspase-1 KO, IL-1R1 KO and A2A AR KO mice were resistant ((C57 WT) saline vs. adenosine: 100.00 ± 7.46% vs. 72.45 ± 6.86%, p = 0.02; (caspase-1 KO) 100.00 ± 27.61% vs. 88.75 ± 14.63%, p = 0.714; (IL-1R1 KO) saline vs. adenosine: 100.00 ± 18.56% vs. 88.24 ± 11.91%, p = 0.646; (BALB/c WT) saline vs. adenosine: 100.00 ± 3.81% vs. 66.75 ± 7.47%, p = 0.007; (A2A AR KO) saline vs. adenosine: 100.00 ± 14.36% vs. 108.82 ± 10.43%, p = 0.630). {Raw values: C57 WT: saline (94.17 ± 6.54 sec), adenosine 68.37 ± 6.67 sec), caspase-1 KO: saline (87.49 ± 24.07 sec), adenosine (79.01 ± 13.40 sec), IL-1R1 KO: saline (75.29 ± 20.04 sec), adenosine (72.69 ± 9.75), BALB/c WT: saline (93.33 ± 3.56 sec), adenosine (62.30 ± 6.97 sec), A2A AR KO: saline (55.12 ± 7.92 sec), adenosine (59.99 ± 5.75 sec)}. Fig.6B demonstrates that adenosine did not curtail mouse locomotion within the open field testing arena ((C57 WT) saline vs. adenosine: 100.00 ± 6.12% vs. 115.58 ± 10.05%, p = 0.231; (caspase-1 KO) saline vs. adenosine: 100.00 ± 9.60% vs. 115.02 ± 6.33%, p = 0.210; (IL-1R1 KO) saline vs. adenosine: 100.00 ± 12.91% vs. 108.02 ± 4.40%, p = 0.632; (BALB/c WT) saline vs. adenosine: 100.00 ± 12.43% vs. 107.98 ± 12.84%, p = 0.671; (A2A AR KO) saline vs. adenosine: 100.00 ± 9.26% vs. 97.20 ± 7.43%, p = 0.821). {Raw values: C57 WT: saline (2426.30 ± 148.51 cm), adenosine (2804.21 ± 243.73 cm), Casp-1 KO: saline (1462.56 ± 140.33 cm), adenosine (1682.27 ± 92.55 cm), IL1-R1 KO: saline (2331.98 ± 301.10 cm), adenosine (2518.95 ± 102.68 cm), BALC/c WT: saline (1742.40 ± 216.63 cm), adenosine (1881.52 ± 223.67 cm), A2A AR KO: saline (2006.42 ± 185.71 cm), adenosine (1950.31 ± 149.12 cm)}. Fig.6C shows that mice administered adenosine 30 min prior to open field testing exhibited a 43% decrease in time spent in the center area when extended testing (30 min of observation) was performed (saline vs. adenosine: 100.00 ± 14.03% vs. 57.69 ± 10.04%, p = 0.027). {Raw values: saline (304.82 ± 42.77 sec), adenosine (175.86 ± 30.60 sec)}. Fig.6D demonstrates that adenosine did not curtail mouse locomotion within the open field testing arena during extended testing (30 min of observation) (saline vs. adenosine: 100.00 ± 23.41% vs. 72.15 ± 4.41%, p = 0.234). {Raw values: saline (17994.31 ± 4212.76 cm), adenosine (12983.18 ± 794.43 cm)}. Fig.6E shows a time course of thigmotaxis during the extended observation period (saline vs. adenosine: 0-5 min, 100.00 ± 9.90% vs. 67.17 ± 5.61%, p = 0.011; 5-10 min, 100.00 ± 11.02% vs. 62.38 ± 9.29%, p = 0.021; 10-15 min, 100.00 ± 17.48% vs. 80.37 ± 24.93%, p = 0.542; 15-20 min, 100.00 ± 18.65% vs. 64.59 ± 26.30%, p = 0.305; 20-25 min, 100.00 ± 16.88% vs. 46.26 ± 8.03%, p = 0.010; 25-30 min, 100.00 ± 42.03% vs. 28.79 ± 8.83%, p = 0.100). {Raw values: saline: 0-5 min (45.95 ± 4.55 sec), 5-10 min (69.62 ± 7.67 sec), 10-15 min (45.44 ± 7.94 sec), 15-20 min (45.32 ± 8.45 sec), 20-25 min (42.45 ± 7.17 sec), 25-30 min (56.04 ± 23.55 sec), adenosine: 0-5 min (30.86 ± 2.58), 5-10 min (43.43 ± 6.47 sec), 10-15 min (36.52 ± 11.33 sec), 15-20 min (29.28 ± 11.92 sec), 20-25 min 919.64 ± 3.41 sec), 25-30 min (16.14 ± 4.95 sec)}. Fig.6F demonstrates that mice co-administered glyburide and adenosine 30 min prior to open field testing were protected from adenosine-induced thigmotaxis (vehicle: saline vs. adenosine, 100.00 ± 8.57% vs. 67.11 ± 5.60%, p = 0.006; glyburide: saline vs. adenosine, 100.00 ± 8.99% ± 145.38 ± 28.01%, p = 0.164). {Raw values: vehicle: saline (45.99 ± 3.94 sec), adenosine (30.86 ± 2.58 sec), glyburide: saline (28.12 ± 2.53 sec), adenosine (40.87 ± 7.87 sec)}. Fig.6G shows that neither glyburide nor adenosine curtailed locomotion within the open field testing arena (vehicle: saline vs. adenosine, 100.00 ± 12.13% vs. 90.19 ± 4.46%, p = 0.460; glyburide: saline vs. adenosine, 100.00 ± 4.42% vs. 100.41 ± 5.54%, 9 = 0.956). {Raw values: vehicle: saline (3913.51 ± 474.56 cm), adenosine, 3529.49 ± 174.40 cm), glyburide: saline (3225.63 ± 142.55 cm), adenosine (3238.75 ± 178.77 cm)}. Fig.6H shows that mice administered adenosine 30 min prior to elevated zero-maze testing exhibited a 55% decrease in percentage of time spent in the open arms of the elevated zero-maze while caspase-1 KO, IL-1R1 KO and A2A AR KO mice were resistant ((C57 WT) saline vs. adenosine: 100.00 ± 21.23% vs. 45.25 ± 13.74%, p = 0.05; (caspase-1 KO) 100.00 ± 15.30% vs. 101.47 ± 15.05%, p = 0.947; (IL-1R1 KO) saline vs. adenosine: 100.00 ± 22.91% vs. 139.16 ± 27.19%, p = 0.296; (BALB/c WT) saline vs. adenosine: 100.00 ± 18.5% vs. 41.69 ± 7.82%, p = 0.027; (A2A AR KO) saline vs. adenosine: 100.00 ± 45.18% vs. 92.99 ± 14.44%, p = 0.887). {Raw values: C57 WT: saline (88.10 ± 17.59 sec), adenosine (39.34 ± 10.85 sec), caspase-1 KO: saline (85.96 ± 13.05 sec), adenosine (88.10 ± 10.16 sec), IL-1R1 KO: saline (61.11 ± 13.44 sec), adenosine (83.41 ± 14.58 sec), BALB/c WT: saline (99.85 ± 18.48 sec), adenosine (41.62 ± 7.80 sec), A2A AR KO: saline (115.77 ± 52.30 sec), adenosine (107.65 ± 16.72 sec)}. Fig.6I demonstrates that adenosine did not curtail mouse locomotion within the elevated zero-maze ((C57 WT) saline vs. adenosine: 100.00 ± 4.45% vs. 106.65 ± 5.52%, p = 0.371; (caspase-1 KO) saline vs. adenosine: 100.00 ± 2.89% vs. 119.70 ± 10.68%, p = 0.222; (IL-1R1 KO) saline vs. adenosine: 100.00 ± 3.08% vs. 103.72 ± 4.76%, p = 0.818; (BALB/c WT) saline vs. adenosine: 100.00 ± 17.37% vs. 108.53 ± 8.45%, p = 0.674; (A2A AR KO) saline vs. adenosine: 100.00 ± 5.18% vs. 113.77 ± 11.38%, p = 0.313). {Raw values: C57 WT: saline (657.45 ± 44.63 cm), adenosine (698.52 ± 44.06 cm), caspase-1 KO: saline (595.84 ± 19.03 cm), adenosine (700.69 ± 52.93 cm), IL-1R1 KO: saline (640.31 ± 24.16 cm), adenosine (665.57 ± 39.87 cm), BALB/c WT: saline (443.72 ± 77.05 cm), adenosine (481.57 ± 37.49 cm), A2A AR KO: saline (499.92 ± 25.88 cm), adenosine (568.77 ± 56.90 cm)}.
Fig.6. Adenosine causes anxiety-like behavior.


(A) C57 WT, Casp-1 KO, IL-1R1 KO, BALB/c WT and A2A AR KO mice were treated with or without IP adenosine and time spent in the center area was measured 30 min after adenosine administration. Results are expressed as means ± s.e.m. versus saline injected genotype control; n = 3-7. *P < 0.05. (B) C57 WT, Casp-1 KO, IL-1R1 KO, BALB/c WT and A2A AR KO mice were treated with or without IP adenosine. Total distance traveled in the arena was measured 30 min after adenosine administration. Results are expressed as means ± s.e.m. versus saline injected genotype control; n = 3-7. (C) C57 WT mice were treated with or without IP adenosine and tested in the open field test for 30 min. Time spent in the center area was measured 30 min after adenosine administration. Results are expressed as means ± s.e.m. versus saline injected control; n = 7-8. *P < 0.05. (D) C57 WT mice were treated with or without IP adenosine and tested in the open field test for 30 min. Total distance traveled in the arena was measured 30 min after adenosine administration. Results are expressed as means ± s.e.m. versus saline injected control; n = 7-8. *P < 0.05. (E) C57 WT mice were treated with or without IP adenosine and tested in the open field test for 30 min. Time spent in the center area was measured in 5 min bins. Results are expressed as means ± s.e.m. versus saline injected control; n = 7-8. *P < 0.05. (F) C57 WT mice were treated with or without IP adenosine and/or glyburide and tested in the open field test for 30 min. Time spent in the center area was measured 30 min after adenosine and/or glyburide administration. Results are expressed as means ± s.e.m. versus saline injected control; n = 8-9. *P < 0.05. (G) C57 WT mice were treated with or without IP adenosine and/or glyburide and tested in the open field test for 30 min. Total distance traveled in the arena was measured 30 min after adenosine and glyburide administration. Results are expressed as means ± s.e.m. versus saline injected control; n = 8-9. *P < 0.05. (H) C57 WT, Casp-1 KO, IL-1R1 KO, BALB/c WT and A2A AR KO mice were treated with or without IP adenosine and time spent in the open arms of the elevated zero-maze were measured 30 min after adenosine administration. Results are expressed as means ± s.e.m. versus saline injected genotype control; n = 4-6. *P < 0.05. Data was analyzed using Kruskal-Wallis One Way Analysis of Variance on Ranks to attain equal variance. (I) C57 WT, Casp-1 KO, IL-1R1 KO, BALB/c WT and A2A AR KO mice were treated with or without IP adenosine. Total distance traveled in the elevated zero-maze was measure 30 min after adenosine administration. Results are expressed as means ± s.e.m. versus saline injected genotype control; n = 4-6.
Discussion
The novel data that we present show for the first time that the increase in anxiety (thigmotaxis), decrease in food intake and decrease in locomotor activity caused by adenosine are absent in mice with defects in the A2A AR, caspase-1, IL-1ß to IL-1R1 pathway. These data strongly implicate the induction of IL-1ß protein maturation as a causal mechanism for adenosine-linked behaviors. Our ex vivo data indicate that adenosine initiates the behavioral cascade by engaging the A2A AR, increasing intracellular cAMP, activating PKA and triggering K+ efflux. This signaling pathway is the initiating event for caspase-1 activation, IL-1ß protein elevation and subsequent behavioral changes, including anxiety.
Anxiety disorders and pro-inflammatory Th1-like responses have long been linked (Maes et al., 1998), but the pathways involved have remained elusive. Recently, adenosine receptors have been postulated to have a role in anxiety due to a variety of anecdotal accounts tying consumption of caffeinated drinks to self-perceived anxious/jittery behaviors (Braun et al., 2011, Lara et al., 2010, Maximino et al., 2011, Lee et al., 1985). However, as a competitive pan-AR blocker, caffeine appears to afford protection against some neuroinflammatory/neurodegenerative diseases like Alzheimer’s disease (AD) (Arendash et al., 2006, Arendash & Cao, 2010, Eskelinen & Kivipelto, 2010) indicating that adenosine in the brain can act as a proinflammatory agent (Chiu et al., 2012, Yu et al., 2004). Since IL-1 is a well described anxiogenic (Connor et al., 1998, Koo & Duman, 2009), the proinflammatory actions of adenosine might, in fact, promote an anxious phenotype. Support for this contention is seen in Fig.1 where we show that perfused adenosine doubles brain caspase-1 activity confirming our recent finding that adenosine is an activator of caspase-1 in the brain (Chiu et al., 2012).
As part of the multiprotein inflammasomes, caspase-1 is a critical generator of mature IL-1β (Bauernfeind et al., 2009). How danger signals are recognized by the inflammasome is not entirely known but K+ efflux is an important trigger in caspase-1 activation (Gross et al., 2011). Our data demonstrate that an excess of extracellular potassium prevents adenosine-dependent activation of caspase-1 as does the use of the KATP channel blocker glyburide (Lamkanfi et al., 2009). Thus, adenosine-dependent activation of caspase-1 appears dependent on KATP channel mediated potassium efflux in a manner similar to lipopolysaccharide (LPS)-treated macrophages where NLRP3 inflammasome-dependent activation of caspase-1 can be prevented by raising the extracellular K+ concentration above 70 mM (Pétrilli et al., 2007, Fernandes-Alnemri et al., 2007) or by antagonizing KATP channels with sulfonylureas (Fig.1) (Lamkanfi et al., 2009, Lamkanfi & Dixit, 2009).
How LPS, which interacts with Toll-like receptor 4 (TLR4), causes K+ efflux is still unclear (Scheel et al., 2006, Jo et al., 2011), but for GPCRs, like the ARs, the mechanisms by which K+ efflux is triggered is much better defined (Kleppisch & Nelson, 1995, Mathie, 2007). Importantly, the A2A AR is a well described inducer of K+ efflux through a pathway reliant on increased intracellular cAMP, activation of PKA and opening of KATP channels (Kleppisch & Nelson, 1995). Fig.1&2 show that the competitive PKA inhibitor KT5720 prevents adenosine-dependent-activation of caspase 1 and that caspase-1 activation is reliant on the A2A AR. These findings were not unexpected in light of our previous work showing that that an A1/A2A AR inhibitor cocktail blocked adenosine-dependent activation of caspase-1 (Chiu et al., 2012). Since the A1 AR is a Gi-linked GPCR that inhibits intracellular cAMP production (Stiles, 1986), it was unlikely that the A1 AR was the upstream receptor responsible for adenosine-dependent caspase-1 activation in the brain. In general, ligand bound A2A ARs increase intracellular cAMP concentration (Wu et al., 2013). Therefore, adenosine-dependent activation of caspase-1 in the brain leading to increased brain IL-1β (Table 1) appears reliant on A2A ARs, PKA and KATP channel mediated K+ flux. It is important to note that ATP, the precursor to adenosine, is a known activator of the inflammasome. However, in the extracellular space, ATP is rapidly metabolized to adenosine (Zimmermann, 1996; Zimmermann & Braun, 1996; Latini & Pedata, 2001). Furthermore, ATP stimulates the P2 receptors, which are not G-protein coupled receptors, and do not appear to directly affect cAMP or PKA (Ralevic & Burnsotck, 1998).
Central IL-1, especially in rodents, promotes anxiety-like behavior as first demonstrated in rats administered ICV IL-1β (Connor et al., 1998). Most studies examining the behavioral effects of IL-1 have been developed from the sickness behavior paradigm in which peripheral infection, often modelled by IP LPS administration, triggers brain-based production of IL-1. Our results indicate that IP administration of adenosine increases brain-based caspase-1 activity. Interestingly, this induction of caspase-1 activity appears to have some brain region specificity, especially when the amygdala is compared to the whole brain (Fig.4A vs. Fig.4B). In addition, adenosine did not increase caspase-1 activity in the hippocampus or the cerebellum (data not shown). These results were anticipated given our previous findings demonstrating that hypoxia/reoxygenation-induced caspase-1 activity is confined to the amygdala when compared to the hippocampus (Chiu et al., 2012).
Increased caspase-1 activity was coupled to a 2-fold increase in serum adenosine. Importantly, these increases in adenosine and caspase-1 were linked to the classic IL-1-associated sickness symptoms of transient reduced locomotion and food intake that resolved by 75 mins post injection. It is possible the decreases in locomotor activity and food intake seen were tied to the role of adenosine in sleep and arousal (Portas et al., 1997; Lin et al., 1997) but strong support for caspase-1 and IL-1 is gleaned from our use of caspase-1 KO and IL-1R1 KO mice which demonstrate a resistance to these adenosine-induced reductions in locomotor activity and food intake (Fig.4). Notably, caspase-1 KO mice show increased food intake in response to adenosine suggesting an important role of caspase-1 in food regulation. Since IL-1R1 KO mice do not exhibit a similar behavior, another caspase-1-matured bioactive such as IL-18 is likely involved (Sansonetti et al., 2000), given its to hyperphagia (Netea et al., 2006). As was anticipated, A2A AR KO mice were resistant to adenosine-induced reductions in locomotion and food intake supporting our contention that adenosine through A2A ARs activate caspase-1 leading to IL-1-dependent behaviors.
Clinically, adenosine is given as an intravenous injection to alleviate hypertension and to treat certain types of arrhythmias (Overholt et al., 1988; Morgan et al., 1991). Peripheral injection is used to control pain through the ability of adenosine to hyperpolarize neurons (Sawynok & Liu, 2003). Currently, there are no described indications for central administration of adenosine. Fig.5 shows that central administration of the caspase-1 inhibitor Ac-YVAD-CMK prevented adenosine-induced loss of locomotion and food intake. These findings support the role of brain-based caspase-1 and by extension IL-1β as drivers of behaviors triggered by peripheral elevations in extracellular adenosine. Additional support for the above is derived from our previous work in which hypoxia/reoxygenation-induced extracellular adenosine caused adenosine-dependent activation of caspase-1 in the brain but not in the liver (Chiu et al., 2012). Since oxidative stress and other metabolic-related dysfunctions are the most common precipitates of elevated serum adenosine (Rego et al., 2000, Lavie, 2003, Barsotti & Ipata, 2004), our finding indicate that conditions unrelated to microbial infection can activate caspase-1 in the brain and trigger IL-1-associated adverse behaviors. Furthermore, while certain psychiatric conditions appear to emerge in association with inflammatory conditions, obesity and type 2 diabetes as example (Anderson et al., 2001, Simon et al., 2006, Das-Munshi et al., 2007, Petry et al., 2008), causation of mental illness directly-linked to TLRs has not been firmly established. This suggests that danger signals recognized by non-TLRs may be important.
While induced reductions in spontaneous locomotion and ad libitum food intake are often associated with sickness symptoms (Dantzer et al., 2008), these relatively non-specific behaviors are seen in a variety of conditions unrelated to sickness, including anxious-like states (Schneider et al., 2012). As supported by our data, adenosine decreases the time spent in the center area of the open field test. However, given the novelty and stress of the open field environment, mice were able to overcome the adenosine-induced reductions in locomotion observed during home cage locomotor testing. Similarly, adenosine decreases time spent in the open arms of an elevated zero-maze with no effect on overall motor activity in the novel arena. Finally, the co-administration of glyburide nullifies the anxiogenic effect of adenosine, underscoring the importance of K+ efflux in the adenosine/anxiety-like behavior cascade (Fig.6). These findings highlight the difference between adenosine-induced behaviors and those seen in classic TLR-mediated sickness symptoms or sickness behaviors secondary to IP IL-1β administration. Classic sickness usually does not manifest until 2 hrs post LPS or IL-1β administration and loss of function such as reduced locomotion cannot be normalized by changing the environment or provocation with a noxious stimulus (Dantzer et al., 2008). The cause for this response delay is that LPS and IL-1β do not cross the blood brain barrier efficiently and likely act peripherally to stimulate central IL-1β transcription prior to inflammasome activation (Layé et al., 1995). In contrast, peripheral adenosine can easily and rapidly access the CNS (Li et al., 2001) where without increasing IL-1 transcription (data not shown) it can, within 30 min, trigger anxiety like behaviors in an A2A AR-, KATP-channel, caspase-1- and IL-1R1-dependent fashion (Fig.6). These findings support the current knowledge regarding anxiogenic function of adenosine in that such action appears mediated by inhibition of A1 ARs (such as with caffeine) and/or activation of A2A ARs (as with adenosine) (Johansson et al, 2001). Differential brain distribution of AR subtypes and AR subtype affinity for adenosine is likely critical in realizing the ultimate phenotypic responses to adenosine.
In animal models, caffeine at a moderate dose (30 mg/kg) increases the time rats spend in the open arms of an elevated plus maze (Garcia et al., 2011) indicating that a blockade of adenosine signaling might be anxiolytic. Furthermore, zebra fish with early life anxiety-like behavior can be made less anxious with caffeine (Khor et al., 2013). However, why caffeine is controversial in the context of human anxiety may be due to the dose of caffeine and the natural distribution of adenosine receptors. For instance, zebra fish develop anxiety-like behaviors at a high dose of caffeine (100 mg/kg) but not at a low dose (10 mg/kg) (Maximino et al., 2011). Interestingly, administration of an A1 AR but not an A2A AR antagonist increases anxiety-like behavior (Maximino et al., 2011), suggesting that unopposed activation of PKA is anxiogenic (Keil et al., 2012). Therefore, the anxiogenic effects of high-dose caffeine may be mediated via A1 inhibition which likely bypasses caffeine-mediated blockade of A2A AR signaling. In addition, as we show in Table 2 and others have demonstrated (Rosin et al., 1998), the location of A2A ARs in the brain is primarily in the amygdala and striatum where manipulation of amygdala-based neuronal activity can cause anxiety like behavior in mice (Tye et al., 2011). Finally, human anxiety has a link to adenosine. Coincident with elevated plasma adenosine is a higher prevalence of psychiatric disorders especially anxiety (Henningsen et al., 2003, Cella et al., 2011, Duley et al., 2000). In sum, physiological levels of extracellular adenosine are important to selectively inhibiting neurotransmission via hyperpolarization of excitatory synapses (Lambert & Teyler, 1991, Prince & Stevens, 1992). However, in deleterious conditions where excessive adenosine is present such as undue alcohol ingestion, sterile inflammation, tissue injury and hypoxia/ischemia (Winn et al., 1981, Karmouty-Quintana et al., 2013, Spinetta et al., 2008) this same mechanism of hyperpolarization appears to trigger casapse-1 activation and generation of IL-1β that causes adverse behaviors that include anxiety.
Supplementary Material
Acknowledgments
Support: This research was supported by the: National Institute of Food and Agriculture (NIFA/ILLU to G.G.F), National Institutes of Health (DK064862, NS058525 & AA019357 to GGF MH083767 to RHM, and DK59802 to the Division of Nutritional Sciences as a Ruth L. Kirchstein National Research Service Award Predoctoral Fellowship to GSC)
Abbreviations
- (AR)
adenosine receptor
- (cAMP)
3′-5′-cyclic adenosine monophosphate
- (CSC)
8-(3-chlorostyryl)caffeine
- (IL)
interleukin
- (ICV)
intracerebroventricular
- (IP)
intraperitoneal
- knockout (KO)
ATP-sensitive potassium channels (KATP channels)
- (PBS)
phosphate buffered saline
- (PBK)
potassium (K+) phosphate buffered potassium
- (PKA)
protein kinase A
- (WT)
wild type
Footnotes
Publisher's Disclaimer: This is a PDF file of an unedited manuscript that has been accepted for publication. As a service to our customers we are providing this early version of the manuscript. The manuscript will undergo copyediting, typesetting, and review of the resulting proof before it is published in its final citable form. Please note that during the production process errors may be discovered which could affect the content, and all legal disclaimers that apply to the journal pertain.
References
- Anderson R, Freedland K, Clouse R, Lustman P. The prevalence of comorbid depression in adults with diabetes a meta-analysis. Diabetes Care. 2001;24(6) doi: 10.2337/diacare.24.6.1069. [DOI] [PubMed] [Google Scholar]
- Arendash GW, Cao C. Caffeine and coffee as therapeutics against Alzheimer’s disease. Journal of Alzheimer’s disease : JAD. 2010;20(Suppl 1):S117–26. doi: 10.3233/JAD-2010-091249. [DOI] [PubMed] [Google Scholar]
- Arendash GW, Schleif W, Rezai-Zadeh K, Jackson EK, Zacharia LC, Cracchiolo JR, Shippy D, Tan J. Caffeine protects Alzheimer’s mice against cognitive impairment and reduces brain beta-amyloid production. Neuroscience, 2006;142(4):941–52. doi: 10.1016/j.neuroscience.2006.07.021. [DOI] [PubMed] [Google Scholar]
- Barsotti C, Ipata PL. Metabolic regulation of ATP breakdown and of adenosine production in rat brain extracts. The international journal of biochemistry & cell biology, 2004;36(11):2214–25. doi: 10.1016/j.biocel.2004.04.015. [DOI] [PubMed] [Google Scholar]
- Bauernfeind F, Horvath G, Stutz A, Alnemri ES, MacDonald K, Speert D, Fernandes-Alnemri T, Wu J, Monks BG, Fitzgerald KA, Hornung V, Latz E. Cutting edge: NF-kappaB activating pattern recognition and cytokine receptors license NLRP3 inflammasome activation by regulating NLRP3 expression. Journal of immunology, 2009;183(2):787–91. doi: 10.4049/jimmunol.0901363. [DOI] [PMC free article] [PubMed] [Google Scholar]
- Braun AA, Skelton MR, Vorhees CV, Williams MT. Comparison of the elevated plus and elevated zero mazes in treated and untreated male Sprague-Dawley rats: effects of anxiolytic and anxiogenic agents. Pharmacology, biochemistry, and behavior, 2011;97(3):406–15. doi: 10.1016/j.pbb.2010.09.013. [DOI] [PMC free article] [PubMed] [Google Scholar]
- Buttke TM, Sandstrom PA. Oxidative stress as a mediator of apoptosis. Immunology Today. 1994;15(1):7–10. doi: 10.1016/0167-5699(94)90018-3. [DOI] [PubMed] [Google Scholar]
- Cella M, Chalder T, White PD. Does the heterogeneity of chronic fatigue syndrome moderate the response to cognitive behaviour therapy? An exploratory study. Psychotherapy and psychosomatics, 2011;80(6):353–8. doi: 10.1159/000327582. [DOI] [PubMed] [Google Scholar]
- Chiu GS, Chatterjee D, Darmody PT, Walsh JP, Meling DD, Johnson RW, Freund GG. Hypoxia/Reoxygenation Impairs Memory Formation via Adenosine-Dependent Activation of Caspase 1. J. Neurosci. 2012;32:13945–13955. doi: 10.1523/JNEUROSCI.0704-12.2012. [DOI] [PMC free article] [PubMed] [Google Scholar]
- Connor T, Song C, Leonard B, Merali Z, Anisman H. An assessment of the effects of central interleukin-1β, -2, -6, and tumor necrosis factor-α administration on some behavioural, neurochemical, endocrine and immune parameters in the rat. Neuroscience, 1998;84(3):923–933. doi: 10.1016/s0306-4522(97)00533-2. [DOI] [PubMed] [Google Scholar]
- Damiano JS, Oliveira V, Welsh K, Reed JC. Heterotypic interactions among NACHT domains: implications for regulation of innate immune responses. The Biochemical journal. 2004;381(Pt 1):213–9. doi: 10.1042/BJ20031506. [DOI] [PMC free article] [PubMed] [Google Scholar]
- Dantzer R, O’Connor JC, Freund GG, Johnson RW, Kelley KW. From inflammation to sickness and depression: when the immune system subjugates the brain. Nature reviews. Neuroscience, 2008;9(1):46–56. doi: 10.1038/nrn2297. [DOI] [PMC free article] [PubMed] [Google Scholar]
- Das-Munshi J, Stewart R, Ismail K, Bebbington PE, Jenkins R, Prince MJ. Diabetes, common mental disorders, and disability: findings from the UK National Psychiatric Morbidity Survey. Psychosom Med. 2007;69(6):543–50. doi: 10.1097/PSY.0b013e3180cc3062. [DOI] [PubMed] [Google Scholar]
- Davis M. The role of the amygdala in fear and anxiety. Annual Reviews in Neuroscience. 1992;15:353–75. doi: 10.1146/annurev.ne.15.030192.002033. [DOI] [PubMed] [Google Scholar]
- Donath MY, Schumann DM, Faulenbach M, Ellingsgaard H, Perren A, Ehses JA. Islet Inflammation in Type 2 Diabetes: From metabolic stress to therapy. Diabetes Care. 2008;31:S161–S164. doi: 10.2337/dc08-s243. [DOI] [PubMed] [Google Scholar]
- Duley JA, Garrick DP, Pratt DA. Raised plasma adenosine associated with chronic fatigue syndrome: a preliminary study. Journal of Chronic Fatigue Synsrome. 2000;7(3):77–85. [Google Scholar]
- Eskelinen MH, Kivipelto M. Caffeine as a protective factor in dementia and Alzheimer’s disease. Journal of Alzheimer’s disease : JAD. 2010;20(Suppl 1):S167–74. doi: 10.3233/JAD-2010-1404. [DOI] [PubMed] [Google Scholar]
- Fernandes-Alnemri T, Wu J, Yu J-W, Datta P, Miller B, Jankowski W, Rosenberg S, Zhang J, Alnemri ES. The pyroptosome: a supramolecular assembly of ASC dimers mediating inflammatory cell death via caspase-1 activation. Cell death and differentiation, 2007;14(9):1590–604. doi: 10.1038/sj.cdd.4402194. [DOI] [PMC free article] [PubMed] [Google Scholar]
- Fredholm BB, Ijzerman AP, Jacobson KA, Klotz KN, Linden J. International Union of Pharmacology. XXV. Nomenclature and classification of adenosine receptors. Pharmacological reviews. 2001;53(4):527–52. [PMC free article] [PubMed] [Google Scholar]
- Garcia AMB, Cardenas FP, Morato S. The effects of pentylenetetrazol, chlordiazepoxide and caffeine in rats tested in the elevated plus-maze depend on the experimental illumination. Behavioural brain research, 2011;217(1):171–7. doi: 10.1016/j.bbr.2010.09.032. [DOI] [PubMed] [Google Scholar]
- Gorlach A. Control of adenosine transport by hypoxia. Circ. Res. 2005;97:1–3. doi: 10.1161/01.RES.0000174112.36064.77. [DOI] [PubMed] [Google Scholar]
- Gross O, Thomas CJ, Guarda G, Tschopp J. The inflammasome: an integrated view. Immunol. Rev. 2011;243:136–151. doi: 10.1111/j.1600-065X.2011.01046.x. [DOI] [PubMed] [Google Scholar]
- Hagberg H, Andersson P, Lacarewicz J, Jacobson I, Butcher S, Sandberg M. Extracellular adenosine, inosine, hypoxanthine, and xanthine in relation to tissue nucleotides and purines in rat striatum during transient ischemia. Journal of neurochemistry, 1987;49(1):227–231. doi: 10.1111/j.1471-4159.1987.tb03419.x. [DOI] [PubMed] [Google Scholar]
- Hamann SB, Ely TD, Grafton ST, Kilts CD. Amygdala activity related to enhanced memory for pleasant and aversive stimuli. Nature Neuroscience. 1999;2:289–293. doi: 10.1038/6404. [DOI] [PubMed] [Google Scholar]
- Henningsen P, Thomas Z, Sattel H. Medically Unexplained Physical Symptoms, Anxiety, and Depression: A Meta-Analytic Review. Psychosomatic Medicine, 2003;65(4):528–533. doi: 10.1097/01.psy.0000075977.90337.e7. [DOI] [PubMed] [Google Scholar]
- Huston J, Haas H, Boix F, Pfister M. Extracellular adenosine levels in neostriatum and hippocampus during rest and activity periods of rats. Neuroscience, 1996;73(1):99–107. doi: 10.1016/0306-4522(96)00021-8. [DOI] [PubMed] [Google Scholar]
- Jo H-Y, Kim SY, Lee S, Jeong S, Kim SJ, Kang TM, Lee K-Y. Kir3.1 channel is functionally involved in TL R4-mediated signaling. Biochemical and biophysical research communications. 2011;407(4):687–91. doi: 10.1016/j.bbrc.2011.03.076. [DOI] [PubMed] [Google Scholar]
- Johansson B, Halldner L, Dunwiddie TV, Masino SA, Poelchen W, Gimenez-Llort L, Escorihuela RM, Fernandez-Teruel A, Wiesendeld-Hallin Z, Xu X-J, Hardemark A, Betsholtz C, Herlenius E, Fredholm BB. Hyperalgesia, anxiety, and decreased hypoxic neuroprotection in mice lacking the adenosine A1 receptor. Procedings of the National Academy of Sciences of the United States of American, 2001;98(16):9408–9412. doi: 10.1073/pnas.161292398. [DOI] [PMC free article] [PubMed] [Google Scholar]
- Johnson DR, O’Connor JC, Hartman ME, Tapping RI, Freund GG. Acute hypoxia activates the neuroimmune system, which diabetes exacerbates. The Journal of neuroscience : the official journal of the Society for Neuroscience, 2007;27(5):1161–6. doi: 10.1523/JNEUROSCI.4560-06.2007. [DOI] [PMC free article] [PubMed] [Google Scholar]
- Karmouty-Quintana H, Xia Y, Blackburn MR. Adenosine signaling during acute and chronic disease states. Journal of molecular medicine (Berlin, Germany), 2013;91(2):173–81. doi: 10.1007/s00109-013-0997-1. [DOI] [PMC free article] [PubMed] [Google Scholar]
- Keil MF, Briassoulis G, Gokarn N, Nesterova M, Wu TJ, Stratakis CA. Anxiety phenotype in mice that overexpress protein kinase A. Psychoneuroendocrinology, 2012;37(6):836–43. doi: 10.1016/j.psyneuen.2011.09.016. [DOI] [PMC free article] [PubMed] [Google Scholar]
- Kessler RC, Chiu WT, Demler O, Walters EE. Prevalence, severity, and comorbidity of twelve-month DSM-IV disorders in the National Comorbidity Survey Replication (NCS-R) Archives of General Psychiatry. 2005;62(6):617–27. doi: 10.1001/archpsyc.62.6.617. [DOI] [PMC free article] [PubMed] [Google Scholar]
- Khor YM, Soga T, Parhar IS. Caffeine neuroprotects against dexamethasone-induced anxiety-like behaviour in the Zebrafish (Danio rerio) General and comparative endocrinology, 2013;181(310):5. doi: 10.1016/j.ygcen.2012.09.021. [DOI] [PubMed] [Google Scholar]
- Kleppisch T, Nelson M. Adenosine activates ATP-sensitive potassium channels in arterial myocytes via A2 receptors and cAMP-dependent protein kinase. Proceedings of the National Academy of Sciences. 1995 Dec;92:12441–12445. doi: 10.1073/pnas.92.26.12441. [DOI] [PMC free article] [PubMed] [Google Scholar]
- Koo JW, Duman RS. Interleukin-1 receptor null mutant mice show decreased anxiety-like behavior and enhanced fear memory. Neuroscience letters, 2009;456(1):39–43. doi: 10.1016/j.neulet.2009.03.068. [DOI] [PMC free article] [PubMed] [Google Scholar]
- Kuida K, Lippke JA, Ku G, Harding MW, Livingston DJ, Su MS, Flavell RA. Altered cytokine export and apoptosis in mice deficient in interleukin-1 beta converting enzyme. Science (New York, N.Y.) 1995;267(5206):2000–3. doi: 10.1126/science.7535475. [DOI] [PubMed] [Google Scholar]
- Lambert NA, Teyler TJ. Adenosine depresses excitatory but not fast inhibitory synaptic transmission in area CA1 of the rat hippocampus. Neuroscience letters, 1991;122(1):50–2. doi: 10.1016/0304-3940(91)90190-5. [DOI] [PubMed] [Google Scholar]
- Lamkanfi M, Dixit VM. Inflammasomes: guardians of cytosolic sanctity. Immunol. Rev. 2009;227:95–105. doi: 10.1111/j.1600-065X.2008.00730.x. [DOI] [PubMed] [Google Scholar]
- Lamkanfi M, Mueller JL, Vitari AC, Misaghi S, Fedorova A, Deshayes K, Lee WP, Hoffman HM, Dixit VM. Glyburide inhibits the Cryopyrin/Nalp3 inflammasome. J. Cell Biol. 2009;187:61–70. doi: 10.1083/jcb.200903124. [DOI] [PMC free article] [PubMed] [Google Scholar]
- Lara DR. Caffeine, mental health, and psychiatric disorders. Journal of Alzheimer’s disease : JAD. 2010;20(Suppl 1):S239–48. doi: 10.3233/JAD-2010-1378. [DOI] [PubMed] [Google Scholar]
- Latini S, Pedata F. Adenosine in the central nervous system: release mechanisms and extracellular concentrations. Journal of Neurochemistry, 2001;79(3):463–84. doi: 10.1046/j.1471-4159.2001.00607.x. [DOI] [PubMed] [Google Scholar]
- Lavie L. Obstructive sleep apnoea syndrome – an oxidative stress disorder. Sleep Medicine Reviews, 2003;7(1):35–51. doi: 10.1053/smrv.2002.0261. [DOI] [PubMed] [Google Scholar]
- Layé S, Bluthé RM, Kent S, Combe C, Médina C, Parnet P, Kelley K, Dantzer R. Subdiaphragmatic vagotomy blocks induction of IL-1 beta mRNA in mice brain in response to peripheral LPS. The American journal of physiology. 1995;268(5 Pt 2):R1327–31. doi: 10.1152/ajpregu.1995.268.5.R1327. [DOI] [PubMed] [Google Scholar]
- Lee M, Cameron O, Greden J. Anxiety and caffeine consumption in people with anxiety disorders. Psychiatry research, 1985;211:217. doi: 10.1016/0165-1781(85)90078-2. [DOI] [PubMed] [Google Scholar]
- Li JY, Boado RJ, Pardridge WM. Cloned blood-brain barrier adenosine transporter is identical to the rat concentrative Na+ nucleoside cotransporter CNT2. Journal of cerebral blood flow and metabolism : official journal of the International Society of Cerebral Blood Flow and Metabolism, 2001;21(8):929–36. doi: 10.1097/00004647-200108000-00005. [DOI] [PubMed] [Google Scholar]
- Lin AS, Uhde TW, Slate SO, McCann UD. Effects of intravenous caffeine administered to healthy males during sleep. Depression and anxiety, 1997;5(1):21–8. [PubMed] [Google Scholar]
- Ma XC, Gottschall PE, Chen LT, Wiranowska M, Phelps CP. Role and mechanisms of interleukin-1 in the modulation of neurotoxicity. Neuroimmunomodulation, 2003;10(4):199–207. doi: 10.1159/000068322. [DOI] [PubMed] [Google Scholar]
- Maes M, Song C, Lin A, De Jongh R, Van Gastel A, Kenis G, Bosmans E, De Meester I, Benoy I, Neels H, Demedts P, Janca A, Scharpé S, Smith RS. The effects of psychological stress on humans: increased production of pro-inflammatory cytokines and a Th1-like response in stress-induced anxiety. Cytokine, 1998;10(4):313–8. doi: 10.1006/cyto.1997.0290. [DOI] [PubMed] [Google Scholar]
- Martin C, Leone M, Viviand X, Ayem M-L, Guieu R. High adenosine plasma concentration as a prognostic index for outcome in patients with septic shock. Critical Care Medicine, 2000;28(9):3198–3202. doi: 10.1097/00003246-200009000-00014. [DOI] [PubMed] [Google Scholar]
- Mathie A. Neuronal two-pore-domain potassium channels and their regulation by G protein-coupled receptors. The Journal of physiology. 2007;578(Pt 2):377–85. doi: 10.1113/jphysiol.2006.121582. [DOI] [PMC free article] [PubMed] [Google Scholar]
- Maximino C, Lima MG, Olivera KRM, Picanço-Diniz DLW, Herculano AM. Adenosine A1, but not A2, receptor blockade increases anxiety and arousal in Zebrafish. Basic & clinical pharmacology & toxicology, 2011;109(3):203–7. doi: 10.1111/j.1742-7843.2011.00710.x. [DOI] [PubMed] [Google Scholar]
- Morgan JM, McCormack DG, Griffiths MJ, Morgan CJ, Barnes PJ, Evans TW. Adenosine as a vasodilator in primary pulmonary hypertension. Circulation, 1991;84:1145–1149. doi: 10.1161/01.cir.84.3.1145. [DOI] [PubMed] [Google Scholar]
- Netea MG, Joosten LAB, Lewis E, Jensen DR, Voshol PJ, Kullberg BJ, Tack CJ, van Krieken H, Kim S-H, Stalenhoef AF, van de Loo FA, Verschueren I, Pulawa L, Akira S, Eckel RH, Dinarello CA, van den Berg W, van der Meer JWM. Deficiency of interleukin-18 in mice leads to hyperphagia, obesity and insulin resistance. Nature medicine, 2006;12(6):650–6. doi: 10.1038/nm1415. [DOI] [PubMed] [Google Scholar]
- Overholt ED, Rheuban KS, Gutesell HP, Lerman BB, Dimarco JP. Usefulness of adenosine for arrhythmias in infants and children. The Ameriacn Journal of Cardiology, 1988;61(4):336–340. doi: 10.1016/0002-9149(88)90940-x. [DOI] [PubMed] [Google Scholar]
- Pereira GS, Rossato JI, Sarkis JJF, Cammarota M, Bonan CD, Izquierdo I. Activation of adenosine receptors in the posterior cingulate cortex impairs memory retrieval in the rat. Neurobiology of learning and memory, 2005;83(3):217–23. doi: 10.1016/j.nlm.2004.12.002. [DOI] [PubMed] [Google Scholar]
- Pétrilli V, Papin S, Dostert C, Mayor A, Martinon F, Tschopp J. Activation of the NALP3 inflammasome is triggered by low intracellular potassium concentration. Cell death and differentiation, 2007;14(9):1583–9. doi: 10.1038/sj.cdd.4402195. [DOI] [PubMed] [Google Scholar]
- Petry NM, Barry D, Pietrzak RH, Wagner JA. Overweight and obesity are associated with psychiatric disorders: results from the National Epidemiologic Survey on Alcohol and Related Conditions. Psychosomatic medicine, 2008;70(3):288–97. doi: 10.1097/PSY.0b013e3181651651. [DOI] [PubMed] [Google Scholar]
- Pitsavos C, Panagiotakos DB, Papageorgiou C, Tsetsekou E, Soldatos C, Stefanadis C. Anxiety in relation to inflammation and coagulation markers, amon healthy adults: the ATTICA Study. Atherosclerosis. 2006;185(2):320–326. doi: 10.1016/j.atherosclerosis.2005.06.001. [DOI] [PubMed] [Google Scholar]
- Popoli P, Pintor A, Domenici MR, Frank C, Tebano MT, Pèzzola A, Scarchilli L, Quarta D, Reggio R, Malchiodi-Albedi F, Falchi M, Massotti M. Blockade of striatal adenosine A2A receptor reduces, through a presynaptic mechanism, quinolinic acid-induced excitotoxicity: possible relevance to neuroprotective interventions in neurodegenerative diseases of the striatum. The Journal of neuroscience : the official journal of the Society for Neuroscience, 2002;22(5):1967–75. doi: 10.1523/JNEUROSCI.22-05-01967.2002. [DOI] [PMC free article] [PubMed] [Google Scholar]
- Porkka-Heiskanen T. Adenosine: A Mediator of the Sleep-Inducing Effects of Prolonged Wakefulness. Science, 1997;276(5316):1265–1268. doi: 10.1126/science.276.5316.1265. [DOI] [PMC free article] [PubMed] [Google Scholar]
- Portas CM, Thakkar M, Rainnie DG, Greene RW, McCarley RW. Role of adenosine in behavioral state modulation: a microdialysis study in the freely moving cat. Neuroscience, 1997;79(1):225–35. doi: 10.1016/s0306-4522(96)00640-9. [DOI] [PubMed] [Google Scholar]
- Prince DA, Stevens CF. Adenosine decreases neurotransmitter release at central synapses. Proceedings of the National Academy of Sciences of the United States of America, 1992;89(18):8586–90. doi: 10.1073/pnas.89.18.8586. [DOI] [PMC free article] [PubMed] [Google Scholar]
- Pugh CR, Fleshner M, Watkins LR, Maier SF, Rudy JW. The immune system and memory consolidation: a role for the cytokine IL-1beta. Neuroscience and biobehavioral reviews, 2001;25(1):29–41. doi: 10.1016/s0149-7634(00)00048-8. [DOI] [PubMed] [Google Scholar]
- Ralevic V, Burnstock G. Receptors for purines and pyrimidines. Pharmacological Reviews. 1998;50(3):413–492. [PubMed] [Google Scholar]
- Rammal H, Bouayed J, Younos C, Soulmani R. Evidence that oxidative stress is linked to anxiety-related behavior in mice. Brain, Behavior, and Immunity. 2008;22(8):1156–1159. doi: 10.1016/j.bbi.2008.06.005. [DOI] [PubMed] [Google Scholar]
- Rego AC, Agostinho P, Melo J, Cunha RA, Oliveira CR. Adenosine A2A receptors regulate the extracellular accumulation of excitatory amino acids upon metabolic dysfunction in chick cultured retinal cells. Experimental eye research, 2000;70(5):577–87. doi: 10.1006/exer.1999.0815. [DOI] [PubMed] [Google Scholar]
- Robertson CL, Bell MJ, Kochanek PM, Adelson PD, Ruppel RA, Carcillo JA, Wisniewski SR, Mi Z, Janesko KL, Clark RSB, Marion DW, Graham SH, Jackson EK. Increased adenosine in cerebrospinal fluid after severe traumatic brain injury in infants and children: Association with severity of injury and excitotoxicity. Critical Care Medicine, 2001;29(12):2287–2293. doi: 10.1097/00003246-200112000-00009. [DOI] [PubMed] [Google Scholar]
- Rosin DL, Robeva A, Woodard RL, Guyenet PG, Linden J. Immunohistochemical localization of adenosine A2A receptors in the rat central nervous system. The Journal of Comparative Neurology. 1998;401(2):163–186. [PubMed] [Google Scholar]
- Sansonetti PJ, Phalipon A, Arondel J, Thirumalai K, Banerjee S, Akira S, Takeda K, Zychlinsky A. Caspase-1 Activation of IL-1β and IL-18 Are Essential for Shigella flexneri–Induced Inflammation. Immunity. 2000;12(5):581–590. doi: 10.1016/s1074-7613(00)80209-5. [DOI] [PubMed] [Google Scholar]
- Sawynok J, Liu XJ. Adenosine in the spinal cord and periphery: release and regulation of pain. Progress in Neurobiology, 2003;69(5):313–340. doi: 10.1016/s0301-0082(03)00050-9. [DOI] [PubMed] [Google Scholar]
- Scheel O, Papavlassopoulos M, Blunck R, Gebert A, Hartung T, Zähringer U, Seydel Ulrich., Schromm AB. Cell activation by ligands of the toll-like receptor and interleukin-1 receptor family depends on the function of the large-conductance potassium channel MaxiK in human macrophages. Infection and immunity, 2006;74(7):4354–6. doi: 10.1128/IAI.01783-05. [DOI] [PMC free article] [PubMed] [Google Scholar]
- Schneider T, Skitt Z, Liu Y, Deacon RMJ, Flint J, Karmiloff-smith A, Rawlins JNP, Tassabehji M. Anxious, hypoactive phenotype combined with motor deficits in Gtf2ird1 null mouse model relevant to Williams syndrome. Behavioural Brain Research, 2012;233(2):458–473. doi: 10.1016/j.bbr.2012.05.014. [DOI] [PubMed] [Google Scholar]
- Simon GE, Von Korff M, Saunders K, Miglioretti DL, Crane PK, van Belle G, Kessler RC. Association between obesity and psychiatric disorders in the US adult population. Archives of general psychiatry, 2006;63(7):824–30. doi: 10.1001/archpsyc.63.7.824. [DOI] [PMC free article] [PubMed] [Google Scholar]
- Spinetta MJ, Woodlee MT, Feinberg LM, Stroud C, Schallert K, Cormack LK, Schallert T. Alcohol-induced retrograde memory impairment in rats: prevention by caffeine. Psychopharmacology, 2008;201(3):361–71. doi: 10.1007/s00213-008-1294-5. [DOI] [PubMed] [Google Scholar]
- Stiles G. Adenosine receptors: structure, function and regulation. Trends in Pharmacological Sciences. 1986 Dec;:486–490. [Google Scholar]
- Tye KM, Prakash R, Kim S-Y, Fenno LE, Grosenick L, Zarabi H, Thompson KR, Gradinaru V, Ramakrishnan C, Deisseroth K. Amygdala circuitry mediating reversible and bidirectional control of anxiety. Nature, 2011;471(7338):358–62. doi: 10.1038/nature09820. [DOI] [PMC free article] [PubMed] [Google Scholar]
- WHO International Consortium in Psychiatric Epidemiology Cross-National Comparisons of the Prevalences and Correlates of Mental Disorders. Bulletin of the World Health Organization. 2000;78(4) [PMC free article] [PubMed] [Google Scholar]
- Winn H, Rubio R, Berne R. Brain adenosine concentration during hypoxia in rats. American Journal of Physiology - Heart and Circulatory Physiology, 1981;241:235–242. doi: 10.1152/ajpheart.1981.241.2.H235. [DOI] [PubMed] [Google Scholar]
- Wu Y-C, Lai H-L, Chang W-C, Lin J-T, Liu Y-J, Chern Y. A novel Gαs-binding protein, Gas-2 like 2, facilitates the signaling of the A2A adenosine receptor. Biochimica et biophysica acta. 2013 doi: 10.1016/j.bbamcr.2013.08.009. [DOI] [PubMed] [Google Scholar]
- York JM, Blevins NA, McNeil LK, Freund GG. Mouse Short- and Long-term Locomotor Activity Analyzed by Video Tracking Software. J. Vis. Exp. 2013;(76):e50252. doi: 10.3791/50252. [DOI] [PMC free article] [PubMed] [Google Scholar]
- York JM, Blevins NA, Baynard T, Freund GG. Mouse testing methods in psychoneuroimmunology: and overview of how to measure sickness, depressive/anxietal, cognitive, and physical activity behaviors. Methods in molecular biology. 2012;934:243–76. doi: 10.1007/978-1-62703-071-7_13. [DOI] [PubMed] [Google Scholar]
- Yu L, Huang Z, Mariani J, Wang Y, Moskowitz M, Chen J-F. Selective inactivation or reconstitution of adenosine A2A receptors in bone marrow cells reveals their significant contribution to the development of ischemic brain injury. Nature medicine, 2004;10(10):1081–7. doi: 10.1038/nm1103. [DOI] [PubMed] [Google Scholar]
- Zimmermann H. Biochemistry, localization and functional roles of ecto-nucleotidases in the nervous system. Progress in neurobiology. 1996;Vol. 49:589–618. doi: 10.1016/0301-0082(96)00026-3. [DOI] [PubMed] [Google Scholar]
- Zimmermann H, Braun N. Extracellular metabolism of nucleotides in the nervous system. Journal of Autonomic Pharmacology. 1996:397–400. doi: 10.1111/j.1474-8673.1996.tb00062.x. [DOI] [PubMed] [Google Scholar]
Associated Data
This section collects any data citations, data availability statements, or supplementary materials included in this article.