Abstract
Evidence suggests a role for acetylation and deacetylation in regulating autophagy. In this chapter, we describe the methods useful for understanding this important connection. In particular, we discuss methods for the measurements of sirtuin deacetylase activity, in vivo acetylation detection, and the common assays used to monitor both autophagy and the more selective process of mitophagy.
Keywords: Autophagy, p62, LC3, Autophagosome, Atg, Keima
1 Introduction
Macroautophagy, herein termed autophagy, is a highly regulated process that allows damaged proteins and organelles in the cytosol to be engulfed within specialized double membrane structures termed autophagosomes [1]. These autophagosomes are then delivered to lysosomes, where the contents of the autophagosomes can be degraded. This degradation provides several important functions. First, it removes damaged and potentially harmful proteins and organelles from the cell. Secondly, it provides biosynthetic materials for ongoing cellular needs. The latter function is presumably why autophagy is strongly induced under starved conditions. In addition, even under basal conditions, autophagy is needed to maintain cellular homeostasis. Indeed, in the absence of autophagy tissues accumulate a variety of damaged organelles including bizarre and abnormally functioning mitochondria that appear to result in conditions that mimic age-related pathologies [2, 3].
As mention, starvation is a condition known to stimulate autophagic fl ux. Similarly, starvation or caloric restriction is known to stimulate sirtuin activity [4, 5]. This link led us to hypothesize that there might be a connection between sirtuins and autophagy. Our data suggests that Sirt1, a mammalian NAD+-dependent deacetylase, interacts with autophagy-related proteins (Atgs) and regulates acetylation status of several essential Atg proteins including Atg5, Atg7, Atg8, and Atg12 [6]. This regulation was evident both in vitro and in vivo. Our data suggests that increasing Sirt1 activity stimulates autophagic flux, while removing Sirt1 inhibits autophagy. Subsequent studies revealed that the p300 acetyltransferase acted in counterbalancing fashion to regulate autophagy [7]. Other laboratories have substantially added to these observations suggesting a complex albeit incompletely understood role for acetylation and deacetylation in the regulation of autophagy [8, 9]. Nonetheless, given the increasing interest in both sirtuins and autophagy as therapeutic targets for aging and age-related pathologies, the link between these two biological pathways will undoubtedly receive additional focus in the future. Indeed, pharmaceutical approaches that target this connection are already emerging [10]. Here we provide a detailed guide to allow interested investigators the tools to assess the acetylation status of Atg proteins, measurements of autophagic flux, and newer strategies to measure the selective removal of mitochondria, a process known as mitophagy.
2 Materials
2.1 Assays to Assess In Vitro Deaceytylase Activity
Lysis Buffer: 50 mM Tris (pH 7.4), 1 % Triton X-100, 0.5 % Nonidet P-40, 150 mM NaCl, protease inhibitor cocktail, phosphatase inhibitor mixture, and 10 % (vol/vol) glycerol.
pCS-Flag-Sirt1 WT and HY plasmids from Addgene, pcDNA4-HisMax-Atg7, and Atg8 plasmids.
Effectene and Ni–nitrilotriacetic acid–agarose beads.
Anti-FLAG M2 affinity gel.
FLAG peptide, in Elution Buffer (50 mM Tris–HCl, 150 mM NaCl, pH 7.4).
Assay buffer: 50 mM Tris–HCl, 1 mM MgCl2, and 150 mM NaCl (pH 8.0).
NAD.
Anti acetyl-lysine antibody from Cell Signaling (#9441; Cell Signaling Technology Inc., Danvers, MA).
Standard cell culture growth medium.
2.2 In Vivo Acetylation/Deacetylation of Atg Proteins
Sonicator XL 2020.
Lysis Buffer (see above).
Protein G-Sepharose.
Effectene.
Fugene 6.
Antibodies against acetyl-lysine, myc (SC40; SantaCrutz), atg7 (A2856; Sigma, XW-7984; ProSci Inc., Poway, CA, and #04-1055; Millipore, Billerica, MA).
2.3 Autophagy Assays
2.3.1 LC3 I/II Conversion
Pepstatin A and E64d from Sigma.
Lysis Buffer.
Antibody against LC3 (L8918; Sigma, NB100-2331; NOVUS Biologicals, Littleton, CO).
2.3.2 GFP-LC3 Assays
GFP-LC3 plasmid (Addgene Inc., Cambridge, CA).
Effectene (Qiagen).
Lab-Tek Chambered Coverglass w/cover.
Fixation Buffer: 4 % Paraformaldehyde in PBS.
Confocal laser-scanning microscope.
2.3.3 p62 Assay
Lysis Buffer.
Antibody for p62 (GP62; American Research Products, Inc., Belmont, MA).
2.3.4 Mitophagy Analysis Using Mitochondria-Targeted Keima (mtKeima)
Hela cells were obtained from the American Type Culture Collection (ATCC, Manassas, VA).
Lentivirus encoding mitochondria-targeted Keima (mtKeima).
Chambered Lab-Tek cover glass system (#1.0 German borosilicates; Nalge Nunc International).
Modular Incubator Chamber.
500 mM 3-methyladenine, dissolved in water and stored at −20 °C.
100 μM bafilomycin A1, dissolved in DMSO and stored at −20 °C.
Becton-Dickinson LSR II flow cytometer.
Zeiss LSM 510-UV laser-scanning confocal microscope.
3 Methods
3.1 In Vitro Deacetylase Assays
3.1.1 Transfection of HeLa Cells
Add 4 μg of DNAs (Sirt1 or His-Atgs) with 60 μL Effectene using the manufacturer's protocol of DNA transfection.
Wash cells in a 10 cm dish with 1× PBS and then add 7 mL of standard growth medium.
Add DNA–Effectene complexes diluted in 3 mL of complete media.
Incubate 37 °C for 24 h.
3.1.2 Cell Harvesting
Wash transfected plate once with 1× PBS.
Add 5 mL of PBS and scrape cells into a 15 mL conical tube.
Centrifuge cells at 160 × g for 5 min.
Remove PBS and add 1 mL of Lysis buffer.
Transfer resuspended cells to a 1.5 mL tube and incubate at 4 °C for 30 min (see Notes 1 and 2).
Briefly sonicate cell suspension (amplitude-#4, 20 % amplitude, 5–10 s).
Centrifuge lysates at 15,000 × g (4 °C for 10 min).
Collect supernatant.
BCA assay (at RT for 30 min) for measurement of protein concentration.
3.1.3 Purification of Sirt1 Enzymes
Bind 2 mg of Flag-tag Sirt1 transfected protein lysates with 40 μL of anti-Flag affinity gel (50 % v/v slurry of resin).
Incubate complexes at 4 °C for 1 h (see Note 3).
Wash beads containing Flag-tagged Sirt1 protein three times with Lysis Buffer.
Wash beads twice with Elution Buffer.
Elute Flag-Sirt1 protein using 100 μL of Elution Buffer including 2 μL of FLAG peptide (5 mg/mL of Stock) by gently shaking at 4 °C for 30 min (see Notes 4–6).
Spin down beads and collect supernatant.
BCA assay for eluted Flag-Sirt1 protein.
3.1.4 Purification of His-Tagged Atg Proteins
In a 1.5 mL tube, incubate 2 mg of protein cell lysate obtained from cells previously transfected with a His-Atg construct with 40 μL of Ni-resin (50 % v/v slurry) overnight at 4 °C.
Spin down briefly at 9,000 × g for 30 s.
Remove supernatant and wash resin three times with Lysis buffer (see Note 7).
Wash resin two times with Assay buffer.
Spin down and remove any residual supernatant.
3.1.5 Deacetylation Assay (See Note 8)
Prepare reactions by aliquoting purified Atg protein into a fresh 1.5 mL tube with or without approximately 300 ng of purified Sirt1 proteins with or without the addition of 5 μL of NAD (see Note 9) to obtain a final volume of 50 μL.
Incubate samples at 37 °C for 2 h (see Note 10).
Spin down and remove supernatant.
Add 35 μL of 2× protein sample buffer and heat at 95 °C for 5 min to stop the reaction.
Analyze samples using standard Western blotting procedures and detection with rabbit Acetyl-Lysine antibody (Fig. 1).
Fig. 1.
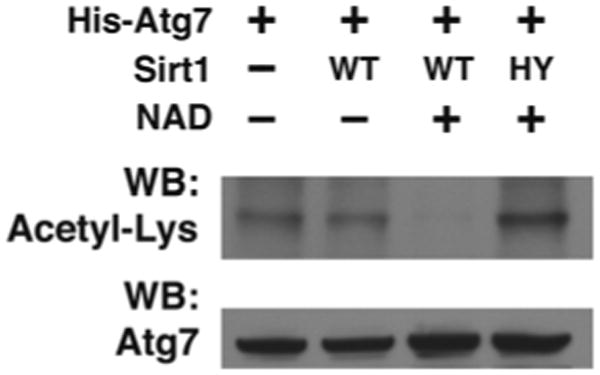
In vitro Sirt1 deacetylation reactions with purified acetylated His-Atg7 as a substrate in the presence or absence of 10 mM NAD and purified Wild-type (WT) or deacetylase-inactive (HY) mutant Sirt1 protein (reprinted with permission from Lee et al. [6])
3.2 In Vivo Deacetylation/Acetylation of Atg Proteins (See Notes 11–16)
3.2.1 Transfection of Cells
For HeLa cells, dilute 4 μg of DNA (2 μg of myc-Atgs and 2 μg of empty vector or HA-Sirt1) with 40 μL Effectene reagent as previously described in 3.1 A.
For primary mouse embryonic fibroblast (MEF) transfection, dilute 18 μL of Fugene6 in 500 μL of serum-free medium (see Note 17) and incubate for 5 min at RT.
Add 6 μg of the desired myc-tagged Atg construct and incubate for 20 min at RT.
Wash MEF cells with 1× PBS and add 9 mL of complete growth media.
Add 1 mL of complete media into the tube containing the DNA-Fugene6 complex.
Add the above mixture to the MEF cell dish and incubate for 24 h at 37 °C.
3.2.2 Preparation of Mouse Tissues
Mince small pieces of fresh or frozen tissues (2–3 mm 3) with a sharp scalpel (see Notes 18 and 19).
To these finely minced tissues, add 1 mL of Lysis buffer and incubate at 4 °C for 30 min (see Note 20).
Sonicate in a 1.5 mL tube (amplitude-#4, 20 % amplitude, 10 s, 3–7 times) (see Note 21).
Centrifuge lysates at 13,000 rpm (4 °C for 20 min).
Collect supernatant and perform BCA assay for measurement of protein concentration.
3.2.3 Immunoprecipitation
Mix protein lysates (1–2 mg) with 10 μL of an acetyl-lysine antibody overnight at 4 °C.
Add 60 μL of protein G-Sepharose and incubate at 4 °C for an additional 2 h.
Spin down and remove supernatant.
Wash beads 3–5 times with Lysis buffer (see Note 22).
Add 35 μL of 2× sample buffer to the beads.
Boil samples at 95 °C for 5 min and load samples for Western blotting (Fig. 2) to detect protein of interest (see Note 23).
Fig. 2.
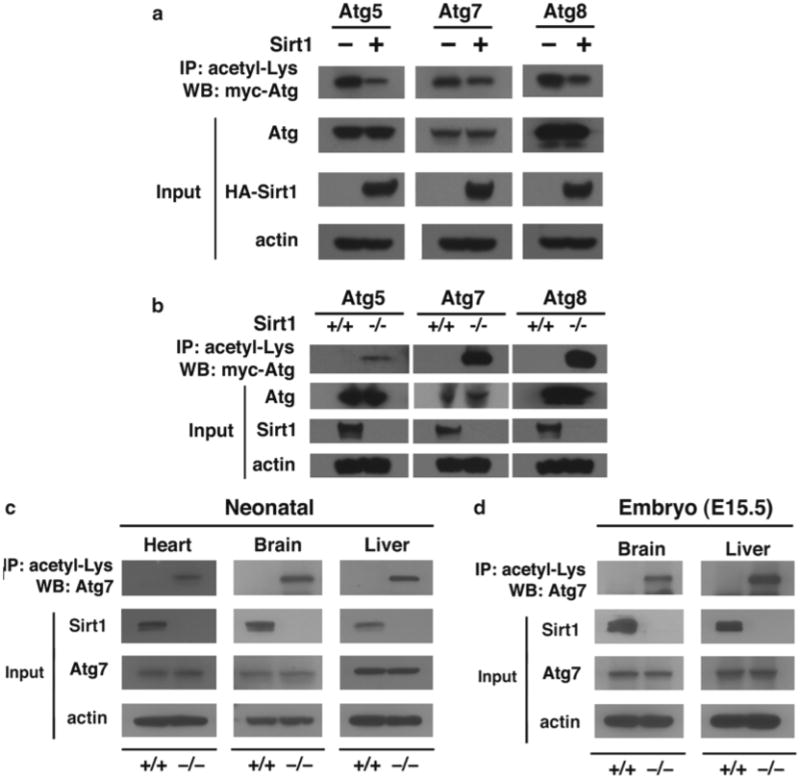
Sirt1 regulates acetylation of autophagy gene products. (a) Transient-increased expression of Sirt1 reduces acetylation. HeLa cells were transfected with the indicated epitope-tagged Atg construct along with, where indicated, wild-type Sirt1 −/−. Measurements were done under fed conditions. IP immunoprecipitation, WB Western blotting. (b) Acetylation of autophagy proteins in wild-type or Sirt1−/− MEFs under fed conditions. Absence of Sirt1 dramatically increased acetylation. (c) Levels of endogenous Atg7 acetylation in various wild-type (+/+) and Sirt1−/− neonatal tissue. Tissues were harvested several hours after birth (reprinted with permission from Lee et al. [6]). (d) Similar analysis in E15.5 embryos
3.3 Autophagy Assay-Atgs
3.3.1 LC3 Assay (LC3 I/II Conversion)
Two hours prior to harvest of cells, add the lysosomal protease inhibitor pepstatin A and E-64d both at 10 μg/mL (see Note 24).
Harvest cells with previous protocol and resolve proteins on a 4–20 % gradient SDS-PAGE.
Transfer gel to solid membrane and detect LC3-I and LC3-II by western blotting (Fig. 3).
Fig. 3.
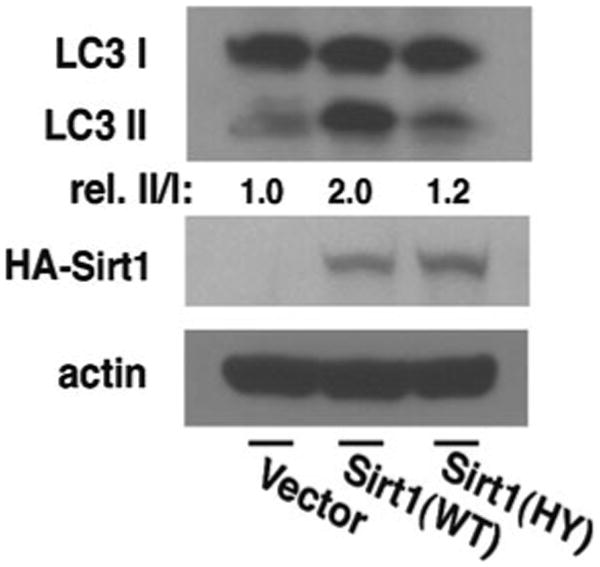
Sirt1 is necessary for autophagy. Transient expression of wild-type (WT) Sirt1 but not a deacetylase-inactive (HY) point mutant of Sirt1 stimulates conversion of LC3-I to LC3-II in HCT116 cells. Quantification of the relative (rel.) levels of LC3-II/LC3-I is shown with the ratio of 1.0 being assigned to vector- transfected cells under fed conditions (reprinted with permission from Lee et al. [6])
3.3.2 GFP-LC3 Assay: Transfection of GFP-LC3 in MEF Cells
Add 0.6 μg of the GFP-LC3 plasmid with 6 μL of Effectene in a total volume of 75 μL to each chamber of a two chamber Lab-Tek slide. Transfection of MEFs follows the manufacturer's protocol (see Note 25).
Incubate at 37 °C for 24 h.
Wash MEFs three times with PBS.
Add 500 μL of Fixation solution for 10 min.
Wash cells three times with PBS.
Observe cells using Confocal Microscopy (LSM510 Meta, Zeiss) (see Notes 26 – 28, Fig. 4).
Fig. 4.
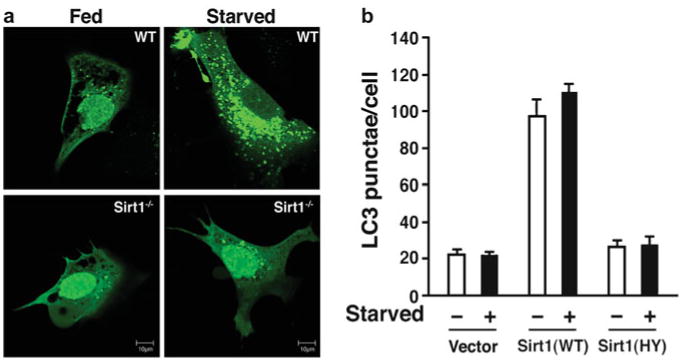
Role of Sirt1 in autophagy. (a) Reduced autophagy in Sirt1−/− MEFs. High power view of wild-type or Sirt1−/− MEFs transfected with GFP-LC3 under fed or starved conditions. In wild-type (wt) cells starvation induces an increase in GFP-LC3 punctae. (b) Quantification of GFP-LC3 punctae in wild-type (+/+) and Sirt1−/− MEFs under fed or starved conditions (reprinted with permission from Lee et al. [6])
3.3.3 p62 Assay (See Notes 29 and 30)
Prepare protein lysates from cells or tissues using Lysis buffer and sonication as described in Subheadings 3.1.2 and 3.2.2.
Analyze protein lysate by standard Western blotting using an antibody directed against p62. Clearance of p62 is dependent on autophagy and increased levels are consistent with impaired autophagic flux (see Fig. 5).
Fig. 5.
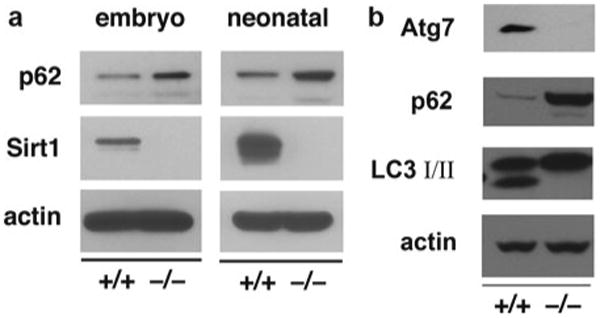
Accumulation of p62 as a marker of autophagic flux. (a) Accumulation of the autophagy marker p62 in the myocardium of embryonic and neonatal Sirt1−/− tissue. Neonatal tissue was harvested in the first 3 h after birth (reprinted with permission from Lee et al. [6]). (b) Analysis of wild-type and Atg7- deficient MEFs. Levels of p62 are increased and levels of LC3-II are decreased in Atg7−/− MEFs. These two conditions allow one to conclude that there is a defect in autophagy
3.3.4 Mitophagy Analysis Using Mitochondria-Targeted Keima (mtKeima)
Mitophagy is the presumed selective removal of damaged or dysfunctional mitochondria from the cell by using the autophagic machinery [11]. The ability to monitor this process has recently been greatly aided by the development of a novel fluorescent reporter termed mitochondria-targeted Keima or mtKeima [12]. Keima is a coral fluorescent protein that is resistant to lysosomal degradation. By using the large shift in the peak excitation spectrum of Keima protein from 440 to 586 nm corresponding to neutral and acidic pH, mitophagy can be specifically assessed.
In particular, cells undergoing high levels of mitophagy have an increase in the ratio of the 586/440 excitation assessed by FACS analysis. Mitophagic cells expressing mtKeima also exhibit bright punctate structure with a high 586/440 ratio by confocal analysis. Hypoxia-induced mitophagy of Hela cells can be analyzed using the following procedure (see Notes 31 and 32).
Plate Hela cells in a 6-well culture plate. After 1 day in culture, cells can be infected with a lentivirus encoding mtKeima for 24 h. Infected cells are selected with 2 μg/mL of puromycin for 2 days and surviving cells are used for further experiments.
Hela cells expressing mtKeima are plated in complete DMEM in a Lab-tek cover glass four well chamber slide. For FACS analysis, cells were plated in 60-mm culture dish.
For hypoxic treatment, Hela cells are transferred to a MIC-101 modular incubator chamber and were fl ushed with 1 % O2, 5 % CO2, 94 % N2. Cells were placed in a 37 °C incubator for the next 24 h. In order to pharmacologically inhibit mitophagy, 5 mM of 3-methyladenine or 100 nM of bafilomycin A1 can be added to the culture medium.
After a 24 h incubation, Hela cells in chambered Lab-tek cover glasses are examined by confocal microscopy. We use a Zeiss LSM 510-UV laser-scanning confocal microscope with 20× magnification and 458 and 561 nm excitation lasers to visualize the fluorescent signal from mtKeima in neutral and acidic pH, respectively. Images are acquired with Zeiss Zen 2009 software. Representative images of hypoxia-induced mitophagy are shown in Fig. 6. The excitation ratio at 561/458 nm of each images is calculated with Metamorph 7.6 software (Universal Imaging Corporation, West Chester, PA) using the region measurement function.
For FACS analysis, Hela cells are trypsinized and washed once with DPBS. Cells are resuspended into 1 mL of DPBS and analyzed with BD LSR II flow cytometer (Bioscience, San Jose, CA) equipped with 407, 488, 532, and 633 nm LASER lines using DIVA 6.1.2 software (BD). Cells are excited with a violet laser (407 nm) with emission detected by 605 ± 20 nm (V605) detector and with a green laser (532 nm) with emission detected by 610 ± 10 nm (G610) detector simultaneously. Ratio of emission at G610/V605 of whole sample or designated population is calculated using FlowJo software (FlowJo 7.6.5; Tree Star Inc., Ashland, OR). Representative data for hypoxia-induced sample are shown in Fig. 7.
Fig. 6.
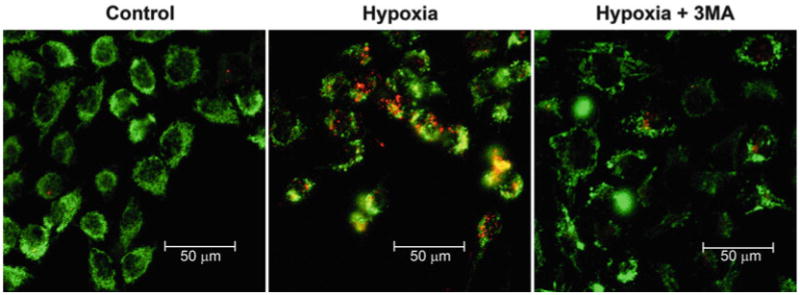
Detection of mitophagy using mtKeima fluorescence. Hela cells expressing mtKeima were exposed to hypoxic conditions for 24 h with or without the addition of 5 mM of 3-methyladenine (3MA). In this confocal micrograph, mtKeima fl uorescence signal from 561 nm (acidic) is red and the signal from 458 nm (neutral) is green. When mitophagy is induced, red punctate structures representing mitochondria contained within the acidic lysosome appear. The appearance of these red punctate structures can be inhibited by 3MA treatment
Fig. 7.
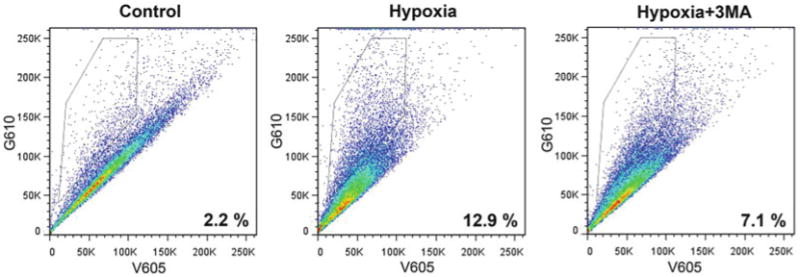
Representative FACS analysis of hypoxia-induced mitophagy. Hela cells expressing mtKeima were exposed to hypoxic conditions for 24 h with or without the addition of 5 mM 3-methyladenine (3MA) and analyzed by FACS using V605 and G610 detectors. Cells with high G610/V605 ratio were selected (boxed area) and their proportion was calculated with FlowJo software
Acknowledgments
We are grateful to A. Miyawaki for the gift of mtKeima. This work was supported by NIH Intramural funds.
Footnotes
Use a rotator in the cold room following cell lysis to prevent degradation of proteins.
Prior to adding Lysis buffer to cells, supplement the Lysis buffer with the deacetylase inhibitors TSA (1 μM) and nicotinamide (10 mM) along with 5 mM imidazole.
For maximum binding, incubate mixture at 4 °C overnight.
To prepare the stock solution, dissolve lyophilized Flag peptide in Elution Buffer to a final concentration of 5 mg/mL (50×).
The working concentration is 100–150 μg/mL peptide in order to elute FLAG fusion proteins from the ANTI-FLAG- M2 affinity resins.
Five to one column volumes of the working solutions are sufficient to elute most FLAG fusion proteins.
When you wash beads, add 20 mM imidazole.
Use fresh assay buffer, enzymes, and substrates.
Make 100 mM of stock of NAD with distilled water and filter it with 0.22 μm filter (Millipore).
Equal amounts of acetylated substrate were added to each tube and samples were subsequently shaken gently during the reaction.
To check acetylation status of individual Atg proteins we routinely used 1–2 mg of proteins. Poorly expressed Atg proteins can require up to 6 mg of initial lysate.
Rabbit antibody is more sensitive than the mouse antibody in detecting acetylated proteins.
Both expression and acetylation of tagged-Atgs can be variable.
The detection of acetylated protein often varies due to lot-to-lot variation of the polyclonal acetyl-lysine antibody.
Acetylation of proteins is sometime sensitive to experimental conditions including cell confluency, passage number, or overall health of the cells.
When harvesting cells or tissues, use Lysis buffer containing Triton X-100 and NP-40 followed by sonication.
Serum-free media should not have antibiotics, which may interfere with complex formation between Fugene 6 and DNA.
When you prepare tissue, begin with samples that are approximately 2–3 mm 3, roughly the size of ½ a grain of rice.
Before sonication of tissues, chop tissues into the smaller size possible.
While incubating in Lysis buffer, use a rotator in the cold room to prevent degradation of proteins.
Sonicate cell or tissue lysates until you cannot see aggregates. Over-sonication can cause degradation of proteins.
Please remove supernatant as much as you can in the last wash.
- A. Cat #: A2856.
- B. Blocking sol: 5 % Milk (Incubate membrane at RT for 30 min).
- C. First antibody: 5 % BSA (Dilution ratio: 1:1,000, Incubate membrane at 4 °C overnight).
- D. Second antibody: 5 % Milk (second rabbit antibody from Santa Cruz, dilution factor: 1:5,000–10,000, Incubate membrane with antibodies at RT for 1 h).
- E. Atg7 is a relatively abundant protein, so it can be detected using roughly 20 μg of initial protein lysate.
In some cases such as HeLa and HCT116 cells, a 30 min incubation of these lysosomal protease inhibitor including pepstatin and E64d is sufficient.
The general transfection efficiency of MEFs is less than 10 %. There is significant variation between different commercially available transfection reagents. We have been successful using Effectene (Qiagen), Fugene 6, Fugene 6 HD (Roche), TurboFect (Fermentas), or Lipofectamine 2000 (Invitrogen).
When you observe GFP-LC3 dots in cells using the confocal microscope, a 62× objective lens is recommended.
A minimum of 5–10 random fields should be taken for each sample.
A minimum of 300 cells per sample were counted using quadruplicate samples per construct per experiment. GFP-LC3 dot was considered to be a structure greater than approximately 1 μm in diameter. A positive cell was defined as having more than three GFP-LC3 dots.
When you detect p62 level in cell lysates usually around 25–50 μg is sufficient.
Block the membrane with 5 % milk at RT for 30 min, then incubate it with p62 antibody in 5 % BSA (Dilution ratio: 1:1,000–3,000) at 4 °C overnight. After washing membrane, incubate it with a secondary antibody in 5 % milk (secondary guinea pig antibody from Santa Crutz, dilution factor: 1:5,000) at RT for 1 h.
For granularity analysis, nuclear staining is advised prior to analysis by confocal microscopy. The cell nucleus can be stained with 1 μg/mL of Hoechst 33342 for 15 min.
Extent of mitophagy also can be expressed as percentage of cells exhibiting structures with a high 561/458 ratio. We considered cells to be positive for mitophagy if there was more than three punctate per cell. Analysis was performed using the Granularity function of Metamorph software.
References
- 1.Mizushima N, Yoshimori T, Ohsumi Y. The role of Atg proteins in autophagosome formation. Annu Rev Cell Dev Biol. 2011;27:107–132. doi: 10.1146/annurev-cellbio-092910-154005. [DOI] [PubMed] [Google Scholar]
- 2.Komatsu M, Waguri S, Chiba T, Murata S, Iwata J, Tanida I, Ueno T, Koike M, Uchiyama Y, Kominami E, Tanaka K. Loss of autophagy in the central nervous system causes neurodegeneration in mice. Nature. 2006;441(7095):880–884. doi: 10.1038/nature04723. doi:nature04723 [pii] 10.1038/nature04723. [DOI] [PubMed] [Google Scholar]
- 3.Hara T, Nakamura K, Matsui M, Yamamoto A, Nakahara Y, Suzuki-Migishima R, Yokoyama M, Mishima K, Saito I, Okano H, Mizushima N. Suppression of basal autophagy in neural cells causes neurodegenerative disease in mice. Nature. 2006;441(7095):885–889. doi: 10.1038/nature04724. doi:nature04724 [pii] 10.1038/nature04724. [DOI] [PubMed] [Google Scholar]
- 4.Nemoto S, Fergusson MM, Finkel T. Nutrient availability regulates SIRT1 through a forkhead-dependent pathway. Science. 2004;306(5704):2105–2108. doi: 10.1126/science.1101731. doi:306/5704/2105 [pii] 10.1126/science.1101731. [DOI] [PubMed] [Google Scholar]
- 5.Cohen HY, Miller C, Bitterman KJ, Wall NR, Hekking B, Kessler B, Howitz KT, Gorospe M, de Cabo R, Sinclair DA. Calorie restriction promotes mammalian cell survival by inducing the SIRT1 deacetylase. Science. 2004;305(5682):390–392. doi: 10.1126/science.1099196. doi:10.1126/science.1099196 1099196 [pii] [DOI] [PubMed] [Google Scholar]
- 6.Lee IH, Cao L, Mostoslavsky R, Lombard DB, Liu J, Bruns NE, Tsokos M, Alt FW, Finkel T. A role for the NAD-dependent deacetylase Sirt1 in the regulation of autophagy. Proc Natl Acad Sci U S A. 2008;105(9):3374–3379. doi: 10.1073/pnas.0712145105. doi:0712145105 [pii] 10.1073/pnas.0712145105. [DOI] [PMC free article] [PubMed] [Google Scholar]
- 7.Lee IH, Finkel T. Regulation of autophagy by the p300 acetyltransferase. J Biol Chem. 2009;284(10):6322–6328. doi: 10.1074/jbc.M807135200. doi:M807135200 [pii] 10.1074/jbc.M807135200. [DOI] [PMC free article] [PubMed] [Google Scholar]
- 8.Hamai A, Codogno P. New targets for acetylation in autophagy. Sci Signal. 2012;5(231):e29. doi: 10.1126/scisignal.2003187. doi:scisignal.2003187 [pii] 10.1126/scisignal.2003187. [DOI] [PubMed] [Google Scholar]
- 9.Yi C, Yu L. How does acetylation regulate autophagy? Autophagy. 2012;8(10):1529–1530. doi: 10.4161/auto.21156. doi:21156 [pii] [DOI] [PubMed] [Google Scholar]
- 10.Morselli E, Marino G, Bennetzen MV, Eisenberg T, Megalou E, Schroeder S, Cabrera S, Benit P, Rustin P, Criollo A, Kepp O, Galluzzi L, Shen S, Malik SA, Maiuri MC, Horio Y, Lopez-Otin C, Andersen JS, Tavernarakis N, Madeo F, Kroemer G. Spermidine and resveratrol induce autophagy by distinct pathways converging on the acetylproteome. J Cell Biol. 2011;192(4):615–629. doi: 10.1083/jcb.201008167. doi:jcb.201008167 [pii] 10.1083/jcb.201008167. [DOI] [PMC free article] [PubMed] [Google Scholar]
- 11.Youle RJ, Narendra DP. Mechanisms of mitophagy. Nat Rev Mol Cell Biol. 2011;12(1):9–14. doi: 10.1038/nrm3028. doi:nrm3028 [pii] 10.1038/nrm3028. [DOI] [PMC free article] [PubMed] [Google Scholar]
- 12.Katayama H, Kogure T, Mizushima N, Yoshimori T, Miyawaki A. A sensitive and quantitative technique for detecting autophagic events based on lysosomal delivery. Chem Biol. 2011;18(8):1042–1052. doi: 10.1016/j.chembiol.2011.05.013. doi:S1074-5521(11)00204-3 [pii] 10.1016/j.chembiol.2011.05.013. [DOI] [PubMed] [Google Scholar]


