

Summary
A central problem in biology is to identify gene function. One approach is to infer function in large supergenomic networks of interactions and ancestral relationships among genes; however, their analysis can be computationally prohibitive. We show here that these biological networks are compressible. They can be shrunk dramatically by eliminating redundant evolutionary relationships and this process is efficient because in these networks the number of compressible elements rises linearly rather than exponentially as in other complex networks. Compression enables global network analysis to computationally harness hundreds of interconnected genomes and to produce functional predictions. As a demonstration, we show that the essential, but functionally uncharacterized Plasmodium falciparum antigen EXP1 is a membrane glutathione S-transferase. EXP1 efficiently degrades cytotoxic hematin, is potently inhibited by artesunate, and is associated with artesunate metabolism and susceptibility in drug-pressured malaria parasites. These data implicate EXP1 in the mode of action of a frontline antimalarial drug.
Introduction
The biological functions of most genes are unknown (Erdin et al., 2011) and therefore require novel methods of identification (Radivojac et al., 2013). Increasingly, these methods rely on computational network analysis (Sharan et al., 2007). Such networks are composed of protein or gene nodes connected by intrinsic links, which indicate common evolutionary origins across species, and contextual links, which indicate interactions or biological correlations among genes and proteins within a genome. The function of a protein node can then be inferred through either local network analysis that transfers annotations from the nodes it directly connects to, or through global analysis that optimizes some relatedness measure over the entire network (Sharan et al., 2007; Vazquez et al., 2003). Although local network analyses are computationally relatively inexpensive, they are also of limited value in sparsely annotated network regions (Erdin et al., 2011) since they cannot reach for information beyond an immediate neighborhood (Chua et al., 2006). Unfortunately, such areas of very sparsely annotated genome regions include genomes of disease-causing agents (Ideker and Sharan, 2008). For example, in the human malarial parasite Plasmodium falciparum, the low sensitivity of current annotation methods leaves most genes without any known biological function (Aurrecoechea et al., 2009; Gardner et al., 2002). By contrast, global network approaches can be more sensitive (Erdin et al., 2011), but their computational demands typically restrict them to smaller networks that can encompass single proteomes with only several thousand nodes (Erdin et al., 2011; Vazquez et al., 2003).
In this study we apply a known global network-based function prediction method, termed graph–based information diffusion (GID; Venner et al., 2010), over so-called supergenomic networks that comprise all the genes from hundreds of genomes. To achieve this, we propose a general network compression scheme that dramatically reduces the number of network links by eliminating redundancies within and between network cliques. In the context of supergenomic networks, these cliques consist of clusters of orthologous groups of proteins (COGs) (Tatusov et al., 1997). Critically, network compression does not significantly perturb global network analysis: GID is much more efficient on a compressed network but still accurately reproduces GID outputs on an uncompressed network. Thus network compression opens, in principle, the known gene and protein space to global network-based function prediction.
As a validation of this approach, we tested a GID based prediction in P. falciparum 3D7 parasites of the biological function of exported protein 1 (EXP1), also referred to as exported antigen 5.1 (Ag5.1) or circumsporozoite-related antigen/protein (CRA) (Hope et al., 1984; Simmons et al., 1987). Even though the biological role of EXP1 has not been characterized, several lines of evidence suggest that this small 17 kDa polypeptide is important to malaria pathogenesis. Failure to disrupt this exp1 gene, which is well conserved among Plasmodium species (Simmons et al., 1987), suggests its essentiality for the parasite (Maier et al., 2008). This gene is also one of the most abundantly transcribed loci (PF11_0224/PF3D7_1121600) during the ring and early trophozoite stages (Bozdech et al., 2003; Le Roch et al., 2004), which is the asexual blood parasite's initial growth phase in erythrocytes. The protein product is mainly exported to the parasitophorous vacuolar membrane (PVM) and to cytosolic compartments in infected red blood cells (RBCs) (Simmons et al., 1987), where it forms homomers integral to the membrane (Spielmann et al., 2006). EXP1 triggers an antigenic immune response in humans (Simossis et al., 2005), and has been explored as a malaria vaccine candidate (Caspers et al., 1991; Meraldi et al., 2004). We demonstrate that EXP1 is a glutathione S-transferase (GST) that conjugates glutathione onto hematin—the main cytotoxin released during malarial blood stage infection. This activity is unique among known membrane GSTs, but is nonetheless consistent with their ability to protect cells against xenobiotic and oxidative stress (Morgenstern et al., 2011). We further show that EXP1 is potently inhibited by the current antimalarial drug of choice, artesunate (ART). This soluble artemisinin derivative is currently recommended by the World Health Organization as the frontline treatment of severe falciparum malaria (World Health Organization (WHO), 2011) even though its future efficacy is uncertain due to emerging parasite resistance to artemisinins (Ariey et al., 2014). Our identification of EXP1 as Plasmodium membrane-bound GST suggests previously unresolved modes of parasitic hematin metabolism and artesunate-mediated stress response.
Results
Supergenomic networks of evolutionary relationships are compressible
Network compression exploits the COG cliques present in supergenomic networks (see Experimental Procedures) in two steps. First, intra-clique compression replaces each COG clique with a star graph (Figure 1A). All the edges among the members of a clique are removed and instead every node becomes connected by a single edge to a new core node for the clique, weighted by the size of the clique, ncog (Figure 1A,B). In a realistic supergenomic network, however, still more compression is required. For example, over 373 proteomes from different species, the STRING (Search Tool for the Retrieval of Interacting Genes/Proteins) database (von Mering et al., 2007) yielded a supergenomic network with n ≈ 1.51×10⁶ protein nodes connected by nc ≈ 3.86 × 10⁷ contextual links and up to ni ≈ 1.93×10¹¹ intrinsic links (Figure 1B schematic and Experimental Procedures). The latter included 5.41× 10⁸ intra-COG links from 33,929 COGs. Intra-clique compression reduces these nearly 400-fold, to 1.38×10⁶, and at the cost of adding ∼2% (33,929) new core nodes to build the star graphs. But the network structure is still dominated by ∼1011 inter-COG links and remains beyond practical computational capabilities.
Figure 1. Compression of supergenomic networks.

(A) Supergenomic network with multiple genomes/proteomes (grey ovals), and links depicting intrinsic and contextual gene associations.
(B) COG cliques of size ncog are transformed in intra-COG compression into weighted star graphs. For both cliques and star graphs, every node is connected to the new node with a link of weight w, and the resulting link weight at each clique or star graph member is w ncog.
(C) Inter-COG compression additionally replaces all sequence similarity links between members in two different COGs with a single link. Contextual links are not compressed.
(D) Intra-clique network compression example of an n = 1000 node network with six cliques. The edge density, i.e. the ratio of the actual number of edges over the maximum edge number n(n − 1)/2, of the uncompressed network is 0.013 and the compressed network has only one third the number of links from the original network.
(E) GID output comparison in logarithmic scale between the full, uncompressed and the compressed network as shown in panel D. GID input labeling in the first third of indexed nodes was “−1”, second was “0”, and third was “+1” (grey curve). The GID output is shown in red, and the absolute error (vector norm difference between uncompressed and compressed GID output) in yellow. Despite the loss of more than 60% of its links, the GID output on the compressed networks had only 0.4% average relative error, defined as the absolute error divided by the vector norm of the GID output of the uncompressed network. Due to the logarithmic scale, negative class label values are represented in absolute values.
To further reduce computational cost the second essential step is inter-clique compression, which additionally compresses evolutionary relationships between COGs. All the links between a pair of COGs are replaced by a single edge connecting their core nodes, weighted by average sequence similarity between COGs (Figure 1C). The number of inter-COG links now falls almost 105-fold from 1.93×10¹¹ to 6.81×10⁶. After full compression the total number of remaining intrinsic links is 8.19×10⁶, which is of the same order of magnitude as contextual links.
Critically, this compression perturbs graph-based information diffusion (GID) only mildly: in extensive simulations on random networks with nodes assigned random initial conditions the relative error between GID on the full network and on the compressed network remained below ∼10% when the original uncompressed graph had an edge density below ∼20% (Figure S1A,B and specific example in Figure 1D,E), i.e. when the graph contained less than ∼20% of all possible edges (see Extended Experimental Procedures). Thus network compression perturbs GID minimally when the underlying network is sparse. Together these and additional numerical data (Figure S1C-E and Extended Experimental Procedures) suggest that network compression was essential to practically enable GID on large supergenomic networks with a loss of accuracy that is tolerable and adjustable.
Theoretical reason for compressibility
Network compression was computationally efficient because in supergenomic networks the number of maximal cliques has a linear relation to the number of network nodes (Figure S1F). Given that the computational time to find all maximal cliques in a network is bounded linearly by the number of nodes per single maximal clique (Eppstein et al., 2010), the observation that the total maximal clique number rises linearly and not exponentially with network size ensures that a complete list of compressible cliques can be computed efficiently, i.e. in non-exponential, linear time (Figure S1G, black graph). In contrast, other common complex networks such as Erdős-Rényi random graphs have a number of maximal cliques that are exponential in the number of nodes (Figure S1G, red graph). Consequently, in larger networks their detection quickly becomes computationally prohibitive. Supergenomic networks are therefore biological examples of networks where clique detection is computationally efficient.
To explain the efficiency of compression in supergenomic networks, we model evolutionary relationships between genes by preferential attachment among cliques (Figure S1H): beginning with a small number of a few given cliques, a new clique is added to the network by linking it to an existing clique with a probability defined by the connectivity of that clique. This scale-free network generation model (Wang et al., 2009) is a natural generalization of both Yule's model of biological speciation (Yule, 1925) and of the Barabasi-Albert model of preferential attachment for scale-free networks (Barabasi and Albert, 1999; Newman, 2005). It predicts that for large clique sizes k ≫ 1 their distribution follows a power law ∼ k −γ with γ = 3. In agreement with this prediction, we measured γ = 2.94 ± 0.03 for the clique (COG) sizes in the supergenomic network (Figure S1I) which implies that its structure was consistent with preferential attachment. Because preferential attachment necessarily produces scale-free networks, in which all maximal cliques can be localized efficiently in computer time that scales linearly with network size (Eppstein et al., 2010), the model offers a rationale for the compressibility of supergenomic networks.
Functional matching on compressed supergenomic networks
In order to benchmark the performance of functional predictions, we next tested the ability to recover the activities of test proteins after hiding their Gene Ontology (GO) Molecular Function information from the network (leave-one-out experiments). The GID output was ranked by statistical z-scores. These scores were insensitive to compression error (Figure 2A), and were based on a normal approximation for the global distribution of reciprocal GID output log-ratios (Figure 2B, example in Figure 2C, and Extended Experimental Procedures). For comparison we used two local and one global algorithm for sequence similarity networks. The local methods were PSI-BLAST sequence search (Altschul et al., 1997), where all links from the full uncompressed network were allowed for matching, and the ordering of network COGs by their average sequence similarity to the query protein (COG method). Since neither method takes into account contextual information, GID was limited to intrinsic evolutionary links for fair comparison. A set of 1,000 enzymes from the curated SwissProt collection of the UniProt database (UniProt, 2010) defined the test set of the leave-one-out experiments. Over these experiments, we measured success by the average number of true positive predictions made prior to reaching 50 false predictions, or ACC50 accuracy values (Gribskov and Robinson, 1996). We found that GID z-scores above z ∼ 2 were reliable indicators of functional accuracy (Figure 2D) giving accuracies that were 9% greater for GID than for PSI-BLAST (p < 9.2×10⁻¹⁷, Wilcoxon signed rank test; Figure 2E), and 21% more than with COGs (p < 1.7×10⁻¹¹; Figure 2F). Our results showed that local algorithms on the full, uncompressed network (such as PSI-BLAST) yielded lower prediction accuracies than GID on the compressed network.
Figure 2. Functional matching on a supergenomic network.

(A) Transformation of GID output f-scores (absolute values) into output z-scores (red solid line); error in output z-scores due to a given GID compression error in f-scores (dashed black line).
(B) GID output z-scores follow approximately a shifted Gaussian distribution (represented here on a reciprocal log scale). The shift follows from the bias in the functional input labels to negative values.
(C) Example output for one leave-one-out test (MMP1595, a Methanococcus maripaludis queuine tRNA-ribosyltransferase; EC 2.4.2.29). The histogram shows the distribution of output z-scores over the entire network, where statistically significant matches are above z = 2. For a fixed number of 50 false matches, GID is more sensitive than PSI-BLAST: it detects 307 true positives (TP) against 42 with PSI-BLAST, or ACC50 = 0.86 against ACC50 = 0.45, where ACC50 is the accuracy defined as TP/(TP + 50). A corresponding histogram of sequence identities to the query sequence; and a dendrogram of true matches across species for PSI-BLAST (black) and GID (red).
(D) Accuracy as a function of minimum z-score cut-off.
(E) GID vs. PSI-BLAST scatter plot of accuracy values for the test set of 1,000 fully annotated (EC numbers) enzyme sequences.
(F) GID vs. COG and
(G) GID vs. RankProp scatter plots for the same test set.
We also benchmarked GID against an established global algorithm, RankProp (Melvin et al., 2009). The iterative flow algorithm underlying RankProp was computationally intractable on the uncompressed supergenomic network, so RankProp was also applied to the intrinsic compressed network. In that test (Figure 2G), GID detected 5% more true matches than RankProp (p < 1.3×10⁻³). This further confirmed that compression is an essential step towards global analysis of large networks, and that GID can improve function detection among other global methods.
Application to the P. falciparum genome: the molecular function of EXP1
EXP1 enzymatic function prediction and validation
To predict novel molecular functions over many genomes, we used competitive GID (Venner et al., 2010) on the compressed supergenomic network: at any tested level of the GO hierarchy, the most likely molecular function was determined by the GO term with the highest significant z-score. Given the prior distribution of input functional labels (Figure S3A), we produced 92,892 significant predictions (with z > 2) for 1,889 Molecular Function enzyme commission (EC) numbers in archaea (4% of predictions), bacteria (48%), and eukaryota (48%; see Table S1). Bacillus anthracis and Plasmodium falciparum, causative agents of anthrax and malaria, had the smallest numbers of genes annotated with EC molecular function terms compared to their total number of genes in the prokaryotic and eukaryotic categories respectively (Figure S3B). This last case confirmed earlier observations that the majority of the P. falciparum 3D7 genome is difficult to annotate with biological function (Gardner et al., 1999; Ochoa et al., 2011). To rank the importance of gene targets among the 305 P. falciparum functional predictions made with GID, we reviewed their number of references in the scientific literature (Table S2). This analysis highlighted EXP1 as the most cited P. falciparum gene with no known molecular function and for which we had a functional prediction.
When applied to EXP1, competitive GID predicted ‘catalytic activity’ (z = 2.39) as the only significant term at the highest molecular function level. Out of six main enzymatic classes, ‘transferase activity’ (z = 2.38) most strongly associated with EXP1 (Figure 3A, B and Table S2). No prediction from the transferase subclasses achieved a significant z-score, but three main functional clusters in eukaryotic integral membrane transferases emerged: glycosyltransferases (EC 2.4.1), protein kinases (EC 2.7), and microsomal glutathione S-transferases (GST, EC 2.5.1.18; Figure 3A). A search in the GO Biological Process category produced ‘glutathione metabolism’ (z = 2.88; Figure 3A, B). To identify the network sources of these predictions, we ordered all other protein nodes by their z-score distance to EXP1 (Table S3): the closest was a type 3 membrane GST from Saccharomyces cerevisiae, leading to the prediction that EXP1 has a function akin to microsomal glutathione S-transferases (MGSTs).
Figure 3. Prediction and experimental confirmation of EXP1 function.

(A) GID analysis of EXP1 performed for all GO terms that were enriched significantly in the three possible clusters.
(B) GID predictions of molecular function and biological process in z-score histograms for all P. falciparum genes extracted from the network.
(C) Purified EXP1 at apparent molecular weight near 23 kDa, which is higher than the predicted 17 kDa and a known anomaly of this antigen (Hope et al., 1985).
(D) No EXP1 antibody interference with both expression host GST from Escherichia coli and positive control GST from Schistosoma japonicum (SjGST).
(E) GST activity of EXP1 toward CDNB; negative control with bovine serum albumin (BSA).
(F) Extended homology sequence alignment (Simossis et al., 2005) of P. falciparum EXP1 and Anopheles gambiae microsomal glutathione S-transferase GSTMIC3 indicates a putative shared site (positions 59-89 with 46% similarity, green box); this region includes a charged helical stretch (red bar). Sequence logos from multiple sequence alignments indicate similar amino acid composition at the putative catalytic residue positions. Secondary structure comparison between EXP1 and GSTMIC3 reveals further commonalities. E-domain indicates putative MGST oligomerization domain (Holm et al., 2006).
Guided by this prediction, we tested EXP1 in vitro for GST activity, after purifying the full-length protein expressed in Escherichia coli (Figure 3C, D). EXP1 was active in a detergent-solubilized form, and standard GST assay spectrophotometric measurements of EXP1 conjugating the thiol group of glutathione toward the benzene ring of the cytotoxic benzene derivative 1-chloro-2,4-dinitrobenzene (CDNB) yielded a specific activity of 8.72 ± 3.73 nmol min−1 mg−1 (Figure 3E and S3C). This activity of EXP1 was comparable to that of the human microsomal GST (MGST1, Figure S3D-F) and the unrelated cytosolic 27 kDa GST from P. falciparum (PfGST, PF11_0187). Heterologous bacterial expression showed that no other P. falciparum proteins were required for the observed activity of EXP1. This GST activity of EXP1 establishes a new apicomplexan member of the widespread superfamily of membrane-associated proteins in eicosanoid and glutathione metabolism (MAPEG; (Jakobsson et al., 1999)). No MAPEG members have previously been described in the Plasmodium genus, although there is likeness in quaternary structure: both EXP1 and eukaryotic MGST form membrane homo-oligomers (Holm et al., 2006; Spielmann et al., 2006).
EXP1 putative catalytic site
Even though EXP1 lacks substantial homology to other MGSTs, there is a suggestive sequence identity, detected at 9% using extended homology alignments (Simossis et al., 2005), and global secondary structure similarity to a type 3 MGST from the malaria mosquito vector Anopheles gambiae (GSTMIC3). An Evolutionary Trace analysis (Mihalek et al., 2004) identified Arg70 as well as the nearby Glu66 (Figure 3F), as being among the most important residues in the MAPEG superfamily (top 8% of evolutionarily traced residue positions). Indeed, a substitution of this arginine to a threonine is sufficient for a loss of GST activity in leukotriene C4 synthase (Lam et al., 1997). We therefore predicted that Arg70 in P. falciparum EXP1 might be catalytically important for GST activity.
To test this hypothesis we expressed and purified an R70T mutant of EXP1 (Figure S3E,F). Enzyme kinetics confirmed that the reaction was approximately five times faster for WT compared to the R70T mutant (Figure 4A) and gave a rate constant kcat = 34.27 s−1 for WT EXP1, and kcat = 6.64 s−1 for R70T EXP1; the Michaelis constants were KM = 1.20 mM and KM = 0.85 mM, respectively. Our data demonstrate that R70 is important to the transferase mechanism while not critically involved in substrate binding. WT EXP1 reaction kinetics were in good agreement with other eukaryotic MGSTs (Andersson et al., 1995).
Figure 4. CDNB and hematin are substrates of EXP1.

(A) Reaction kinetics and Michaelis-Menten analysis for WT EXP1 and R70T EXP1.
(B) Hematin inhibits the GST activity of EXP1 competitively (inset Dixon plot) with a Ki of 170 nM.
(C) Spectrometry-monitored kinetics of the spontaneous degradation of hematin (H) in GSH solution (H+G), EXP1-mediated enzymatic degradation of hematin (G+H+E), and its inhibition after adding artesunate (10 nM, G+H+E+A).
(D) Michaelis-Menten analysis for EXP1-mediated degradation of hematin; points represent mean values with standard error bars from three measurements; curve (solid red line) least square fits to Michaelis-Menten equation.
Hematin is a EXP1 substrate
During malarial infection, the principal cytotoxic compound that is released during parasite hemoglobin catabolism is iron-bound heme, or its hydroxide, hematin. Given that hematin weakly and uncompetitively inhibits PfGST through binding to a pre-formed PfGST-GSH complex with a Ki value of 3 μM (Hiller et al., 2006), we asked whether hematin might inhibit EXP1. We found that inhibition was almost twenty times stronger, with Ki =170 nM, and was competitive (Figure 4B, inset)—i.e. hematin competed with the substrate CDNB for binding to the EXP1 active site. As a control, spectrophotometry around 400 nm showed that recombinant EXP1 purified from Escherichia coli carried no detectible residual heme or hematin, and that only the addition of exogenous hematin produced a prominent Soret peak at 395 nm that is the characteristic of hematin (Figure S4A). This result opened the possibility that hematin itself is a substrate of EXP1, which to our knowledge would be a unique property of this malarial GST.
Reduced GSH spontaneously degrades heme by forming a GSH-heme complex through nucleophillic attack in which heme's porphyrin ring is disrupted leading to the release of Fe3+ (Atamna and Ginsburg, 1995). This process, which can be traced directly through spectrophotometry near 395 nm (Atamna and Ginsburg, 1995; Ginsburg et al., 1998), has been proposed as the underlying mechanism of GSH-mediated heme/hematin degradation in P. falciparum infected erythrocytes (Famin et al., 1999; Ginsburg et al., 1998). We confirmed this reaction in vitro where, in the presence of reduced GSH, loss of free hematin was monitored by a decrease of the Soret peak at 395 nm (Figure S4B,C), and by mass spectrometry-based measurements of the production of GSH-hematin complexes (Figure S4D-F). Motivated by these observations we asked whether the addition of EXP1 enzymatically accelerates hematin degradation. Two experiments demonstrate that EXP1 actively facilitates the conjugation of reduced GSH to hematin. First, spectrophotometry showed a four-fold higher rate of decrease in 395 nm absorbance over the first ∼30 s of reaction time in the presence of EXP1 (G+H+E), compared to the spontaneous degradation of hematin (H+G, Figure 4C). Second, mass spectrometry identified the GSH-hematin product in which addition of EXP1 increased product yield over the spontaneous reaction >14-fold (Figure S4G,H). A Michaelis-Menten analysis (Figure 4D) measured kcat = 7.7 s−1 and a KM = 251 nM. Remarkably, the high specificity constant kcat /KM ∼ 3×10⁷ s−1M−1 placed EXP1 near other extremely efficient enzymes such as fumarase or catalase and thus not far from the universal diffusion limit of ∼108 s−1M−1. This activity toward hematin was unique among all tested wildtype (SjGST, human MGST1) and mutant (R70T EXP1) GSTs (Figure S4I).
In line with the functional formation of MGST homotrimers (Holm et al., 2006), an inhibition analysis with R70T EXP1 (Figure S4J) indicated that several WT EXP1 units constitute one functional catalytic unit. In addition, we bacterially expressed, purified and tested the function of the uncharacterized Plasmodium yoelii EXP1 ortholog HEP17 (17 kDa hepatocyte erythrocyte protein). HEP17 shares only 44% sequence identity with EXP1 such that, and consistent with the sequence logo in Figure 3F (inset), the proposed EXP1 catalytic residue R70 changes to N in HEP17, and E66 changes to K. Despite this variation, HEP17 matched the GST activity of EXP1 both towards CDNB and towards hematin (Figure S4K, L). These data provide evidence that hematin is a substrate of EXP1, which itself belongs to this Plasmodium family of membrane GSTs that share hematin as a substrate.
Artesunate is a potent inhibitor of EXP1
Studies on artemisinin mode of action mostly agree that hemoglobin uptake, digestion, and heme/hematin release lead to cleavage of artemisinin's endoperoxide bridge. The resulting activated drug then causes oxidative damage to parasite membranes (Klonis et al., 2011). EXP1 primarily localizes to the PVM, and a construct of GFP fused to the EXP1 signal sequence has been observed in spherical/cytostomal PVM invaginations that appear to contain RBC cytosol and hemoglobin (Gruring et al., 2011). Endocytic vesicles have been reported to pinch off from these invaginations to form acidified compartments during ring stages, i.e. before the formation of a main food vacuole (FV) (Abu Bakar et al., 2010). Using differential interference contrast and immunofluorescence microscopy, our observations suggested the presence of similar peripheral PVM invaginations and vesicles, which in part co-localized with foci of EXP1 expression during trophozoite (Figure 5A) and late ring stages (Figure 5B). Such peripheral EXP1 foci were also observed in three distinct parasite lines (CQ and ART sensitive 3D7, CQ resistant and ART sensitive Dd2, and CQ sensitive and ART tolerant 3b1 – see Experimental Procedures), in two different drug exposure conditions (with and without ART), and at three different time points after RBC invasion (12, 18, and 30 hours; Figure 5C,D and S5A-D). These invaginations and vesicles are potential sites of early hemoglobin degradation and hematin release (Abu Bakar et al., 2010), which could supply the peroxide bridge activator during ring stages (Klonis et al., 2013b). Because of this temporal and spatial profile of EXP1 expression, and the high affinity of EXP1 to its substrate hematin (Figure 4B,D and S4G), we hypothesized that ART inhibits hematin degradation catalyzed by EXP1. To test this hypothesis in vitro, we added ART to our EXP1-hematin reactions. These assays revealed competitive inhibition (Figure S5E) with a half-maximal inhibitory concentration (IC50) of 2.05 nM (Figure 4C and 5E). Non-specific inhibition was excluded through stoichiometry controls (Habig et al., 2009): after reducing enzyme concentration tenfold, from 100 nM to 10 nM, potency changed by only ∼25% and remained within error margins (Figure 5F). A control through liquid chromatography-mass spectrometry (LC-MS) confirmed an ART-dependent suppression of EXP1-mediated GSH-hematin adduct formation down to spontaneous levels (Figure 5F inset and S5F). Consistent with the peroxide bridge activation mechanism, the reaction displayed strong hematin dependence (Figure 5G): inhibition of EXP1 activity toward CDNB, in the absence of iron-bound hematin, was uncompetitive (Figure S5G) and 100–fold less potent with an average IC50 of 184 nM. In a negative control, we tested the standard cytosolic SjGST from Schistosoma japonicum, which showed six-fold lower reaction velocities that were close to the background noise level (Figure 4E and S4E). Because EXP1 units form membrane homo-oligomers, we further tested for cooperativity. A Hill equation analysis resulted in a calculated IC50 value of 1.21 nM and in a Hill coefficient nH = 0.56, which indicated lack of cooperativity: one EXP1 unit appeared to bind one ART molecule (Figure 5G inset). Our results provide evidence of a potent, hematin-dependent inhibition of EXP1 activity by ART.
Figure 5. Artesunate is a potent inhibitor of EXP1.
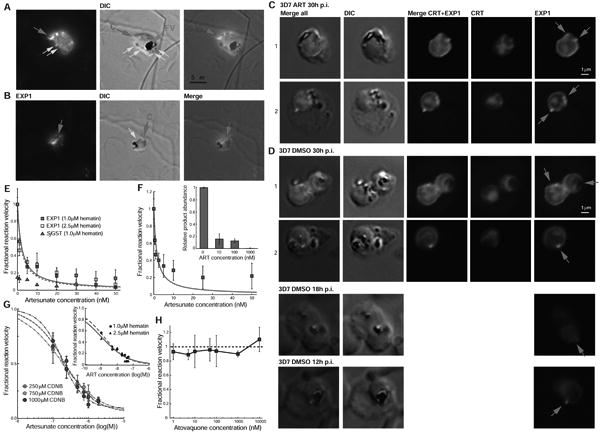
(A) Immunofluorescence microscopy of a 3D7 trophozoite parasites labeled with anti-EXP1 antibodies (EXP1) shows peripheral expression of EXP1 that co-localizes with an apparent cytostomic invagination (C, red arrow; DIC panel). A fully formed trophozoite stage food vacuole (FV, green arrow) presents a large accumulation of hemozoin while small darker spots (yellow arrows) may be vesicles that have pinched off from the invagination.
(B) A late ring stage parasite displays a prominent spherical invagination that also partly corresponds to a convexly shaped EXP1 expression signal; small vesicles (yellow arrow) may become components of an internal pre-FV compartment (dark irregular structure).
(C) Trophozoite stage 3D7 parasites exposed to ART present peripheral EXP1 expression (row C1) or enhanced expression foci at the PVM (row C2).
(D) Control trophozoites (DMSO) displayed similar morphology in EXP1 expression patterns to the drug-exposed parasites. Antibodies to the FV marker CRT (P. falciparum chloroquine resistance marker, PfCRT) indicate that EXP1 expression was largely independent of FV location.
(E) ART inhibits EXP1 GST activity toward hematin.
(F) Stoichiometry control of ART-mediated inhibition of EXP1 activity toward hematin at a reduced enzyme concentration of 10 nM. Inset: ART-dependent inhibition of GSH-hematin product formation.
(G) Inhibition of EXP1 activity toward CDNB through artesunate at three increasing CDNB concentrations. Inset: Hill equation analysis for inhibition of EXP1-mediated hematin degradation through ART.
(H) Atovaquone does not inhibit EXP1 GST activity toward hematin. Dashed line represents fractional reaction velocity at zero concentration of atovaquone (in absolute physical units 0.74 ± 0.06 μM min−1).
Mean values and standard error bars from three experimental results.
As a control for drug specificity, we tested the antimalarial naphthoquinone atovaquone that targets the cytochrome bc1 complex in the mitochondrial electron transport chain (ETC) (Fry and Pudney, 1992). Even though eukaryotic MGSTs have a structural similarity with the ETC enzyme cytochrome c oxidase (Holm et al., 2006), atovaquone did not inhibit EXP1-mediated hematin degradation (Figure 5H). This suggests that EXP1 may be targeted by endoperoxides but not by naphthoquinones.
EXP1 in parasite drug response
We then asked whether EXP1 might be involved in ART drug action, whose cellular effectors may extend beyond the genes and genomic regions that recent sequencing studies associated with emerging ART resistance (Ariey et al., 2014; Cheeseman et al., 2012; Park et al., 2012; Takala-Harrison et al., 2013). Specifically, we tested a model (Mukanganyama et al., 2001) of reductive metabolism of ART, mediated by a hypothetical GST that could catalyze the formation of GSH-ART complexes via GSH binding to the drug's lactone ring to form a hydroperoxide moiety. We addressed this model through EXP1 in the dihydroartemisinin-pressured ART-tolerant parasite line 3b1 (see Experimental Procedures), compared to the parental line Dd2 and to the reference drug-sensitive line 3D7.
In vitro data from LC-MS showed that EXP1 can catalyze the production of GSH-ART adducts in an ART concentration-dependent manner (Figure 6A). A control with SjGST, which belongs to the same GST family as PfGST (PF14_0187), yielded GSH-ART levels indistinguishable from their spontaneous formation. These results recall earlier findings that PfGST does not actively conjugate GSH to ART and is unlikely to modulate parasite susceptibility to artemisinins (Deponte and Becker, 2005). LC-MS studies with extracts of cultured parasites yielded GSH-ART levels that, in ART-tolerant 3b1 parasites, were estimated to be 3.76 ± 0.31 times higher after ART exposure than the background signal without drug challenge (Figure 6B and S6); while in 3D7 parasites those levels were low and almost indistinguishable from post drug exposure levels (0.93 ± 0.09 ratio). Similarly, in Dd2 parasites, GSH-ART measurements after ART challenge were only 1.52 ± 0.54 times higher than without drug exposure.
Figure 6. EXP1 is associated with ART metabolism and modulation of ART susceptibility.

(A) In vitro LC-MS of GSH-ART product formation (monitored at m/z 692.0) with increasing concentrations of artesunate (ART).
(B) Abundance ratios of GSH-ART products from in vivo parasite samples challenged with artesunate (ART+) against unchallenged parasites (ART-); error bars represent minimum and maximum ratios from two independent samples per condition. Significance levels (*) p < 0.05 and (**) p < 0.01 from student's t-test.
(C) Blood stage RNA microarray expression temporal profiles for exp1 and Pfgst at 6 time points between 8 and 48 hours post RBC invasion. Shaded area indicates late-ring/trophozoite transition.
(D) Distribution of transcript level fold changes between the ART-resistant line 3b1 and the ART-sensitive line 3D7 from whole genome mRNA expression arrays over 5,446 P. falciparum genes (see Extended Experimental Procedures).
(E) Distribution of transcript level fold changes between the ART-tolerant line 3b1 and the ART-sensitive line Dd2 (the parental line from which 3b1 was derived) from whole genome mRNA expression arrays over 5,446 P. falciparum genes (see Extended Experimental Procedures).
(F) Western immunoblotting shows elevated EXP1 levels in the ART-tolerant 3b1 line compared to Dd2 and 3D7. Loading controls employed antibodies to the ER lumen protein retaining receptor ERD2 (PF13_0280).
DNA sequencing of the exp1 locus , including 1 kb upstream and 0.5 kb downstream of the coding region, revealed no difference between Dd2 and 3b1 (data not shown), and quantitative PCR indicated no exp1 copy number change in 3b1 compared to Dd2 (Extended Experimental Procedures). mRNA microarray temporal profiles over six time points in the intra-erythrocytic parasite stages showed the strongest transcriptional upregulation of exp1 in line 3b1 near the late-ring/trophozoite transition (Figure 6C), whereas this upregulation was less pronounced in Dd2 by a factor of two. Relative to 3D7, exp1 mRNA levels in 3b1 parasites were the third most highly upregulated among all 5,446 genes tested (3.5-fold increase; p < 6×10⁻⁵; Figure 6C; Table S4; Eastman et al., in preparation). In comparison to Dd2, exp1 mRNA levels in 3b1 were also upregulated by a factor of 2.2 (p < 0.012; Figure 6D; Table S4). Remarkably, Pfgst (PF14_0187) did not present higher transcript levels (expression ratio 0.8 in 3b1/3D7 and 0.8 in 3b1/Dd2; Figure 6C-E). To increase microarray mRNA signal, 3b1 and Dd2 parasite samples were pre-treated with terminator exonuclease, and we note that lower exp1 expression ratios were observed without this treatment (expression ratio 1.3 in 3b1/3D7 and 1.2 in 3b1/Dd2). EXP1 protein levels measured through immunoblotting with EXP1-antibodies in parasites challenged for 6 hours with ART overall showed elevated expression in 3b1, followed by EXP1 levels in the unchallenged line 3b1 (Figure 6F). This evidence of upregulation was not observed in the control lines Dd2 and 3D7 (Figure 6F). Together, these results suggest EXP1 as the first known GST with ART as a substrate, and support a model in which EXP1 may be part of a reductive metabolic pathway of ART by conjugating it to reduced glutathione.
Discussion
Compression of supergenomic networks may be the first positive evidence to address the hypothesis that large biological systems, when represented through evolutionarily related information sequences, are algorithmically compressible (Oexle, 1995). Critically, increased computational efficiency through compression did not prove costly in terms of functional sensitivity and accuracy: the malarial antigen EXP1 case study, in which the network prediction preceded and guided the experimental validation, illustrates the value of global network information.
The discovery of GST activity for EXP1, which we now also refer to as PfMGST (Plasmodium falciparum membrane glutathione S-transferase and, for HEP17, Plasmodium yoelii membrane glutathione S-transferase, PyMGST) point to EXP1 as being a key component of glutathione metabolism in P. falciparum. Heme/hematin release through hemoglobin degradation, and separately antimalarial drug action, both confer strong oxidative insults on the host cell and on the parasite (Becker et al., 2004). Thus, relative to the classical hemozoin formation pathway, EXP1-catalyzed hematin degradation may constitute a novel GSH-mediated detoxification pathway within the malaria parasite (Figure 7). Given that no other known essential protein activity or recently discussed drug target candidates (Cardi et al., 2010; Chugh et al., 2013) are inhibited by ARTs at comparably low concentrations, and the mounting but indirect evidence that these drugs interfere with the glutathione-redox cycle (O'Neill et al., 2010), we propose that EXP1 inhibition might be an important component of the mode of action of artesunate.
Figure 7. Model of EXP1 in the intraerythrocytic P. falciparum.

EXP1 resides in homo-trimeric complexes mainly in the parasitophorous vacuole membrane (PVM) and inside cytostomal invaginations of the PVM where through GST activity it may protect membranes from hematin (ferriprotoporphyrin IX, Fp), which can be released from internalized red blood cell (RBC) cytosol and catabolized hemoglobin (Hb). GSH-Fp complex formation may be an alternative to the detoxification pathway of Fp into hemozoin (Hz) through biomineralization, which eventually leads to hemozoin (Hz) deposits in the food vacuole (FV). In the presence of heme/hematin, EXP1 activity can be potently inhibited by artesunate (ART). EXP1 may also degrade ART by conjugating it to reduced glutathione (GSH) in drug-tolerant parasites.
A prominent phenotype of P. falciparum lines selected for resistance to artemisinins is ring stage quiescence (Witkowski et al., 2010): a temporary arrest of development and hemoglobin uptake and heme/hematin release until toxic ART levels have been reduced sufficiently to resume growth (Klonis et al., 2013a). Sensitive parasites appear to also be able to enter the dormant stage, albeit at a reduced frequency compared to in vitro-derived resistant lines, suggesting that resistant lines have multiple means to withstand ART exposure (Teuscher et al., 2012). Prior studies with ART-resistant P. yoelii parasites have observed an upregulation of GSH-mediated detoxification pathways (Witkowski et al., 2012). During ring stage quiescence, EXP1 might directly contribute to the degradation of ARTs by conjugating them to reduced glutathione, thus lowering the drugs' oxidative potential and allowing a stronger parasite population to recrudesce (Figure 7). Our data support further studies on EXP1 and GSH-mediated oxidative stress responses in artemisinin action and parasite susceptibility.
Experimental Procedures
Supergenomic network data and compressible cliques
Large-scale protein network data came from the Search Tools for Interacting Genes database (STRING) version 7.1. It had a total of 1.513 million protein nodes of which 33% belonged to eukaryota, 63% to bacteria, and 4% to archaea. Nodes were connected with intrinsic evolutionary and with contextual species-specific links, including six types of protein-protein associations: immunoprecipitation, yeast-two-hybrid; co-expression; conserved genomic neighborhood; phylogenetic co-occurrence; and literature co-occurrence. Contextual links between nodes had weights given by a Bayes classifier of evidence scores from STRING and normalized between 0 and 1, such that 1 indicated the highest confidence in a functional association. In total, the network had nc = 38,573,579 = 3.86 ×10⁷ contextual links. Intrinsic links were binary: 1 indicated that two proteins were orthologs or that they were paralogs that shared orthology to a third protein, and 0 if no evolutionary relationship was detected. Orthology was established in a pair if its two protein sequences had symmetrical best hits in sequence identity based on the Smith-Waterman algorithm among all given lineages; mutually orthologous proteins from at least three different species gave rise to clusters of orthologous groups (COGs) which were computed using the automated eggNOG algorithm (Jensen et al., 2008). COGs were characterized as maximal cliques (Mohseni-Zadeh et al., 2004). A clique is maximal if it is not a subset of any other clique; and here we always mean a maximal clique with ncog nodes when simply referring to a clique. Paralogous genes from single species were grouped into single units (Jensen et al., 2008), and COGs were maximal ncog-cliques when detected through best reciprocal sequence hits or become so through mergers of maximal cliques of ncog nodes that have (ncog-1) nodes in common (Falls et al., 2004; Montague and Hutchison, 2000). Empirically (Mohseni-Zadeh et al., 2004), mergers affect only a few (often less than 1%) of the originally detected cliques, which allowed us directly to model COGs as maximal cliques in the sequence matching network. The total number of intrinsic links within COGs with is the sum of ncog (ncog − 1)/2 over all 33,929 COGs present in the network. This gave 540,563,390 ≈ 5.41×10⁸ intra-COG links. Additionally, any pair of cliques with significant sequence similarity results in at most ncog1 × ncog2 inter-COG links, and over all such pairs produced a maximum of ni ≈ 1.93×10¹¹ links.
Cloning, expression and purification of P. falciparum EXP1
The P. falciparum exp1 cDNA was PCR amplified using the plasmid DNA clone pHRPExGFP (kindly deposited by Dr. Kasturi Haldar at the Malaria Research and Reference Reagent Resource Center, MR4, Manassas, VA, USA). The recombinant exp1 product was sequence verified and cloned between NdeI and HindIII restriction sites in the KanR pET28a (+) vector from Novagen (New Canaan CT, USA) to enable E. coli expression of N-terminal His-tagged EXP1 protein (OL617, pET28a-His-EXP1). The EXP1 R70T mutant (OL618, pET28a-His-EXP1-R70T) was generated using the QuikChange II XL Site-Directed Mutagenesis Kit (Stratagene, La Jolla, CA, USA). The His-tagged EXP1 WT and R70T proteins from the total lysate was purified using Ni-NTA agarose (Qiagen, Valencia, CA, USA) affinity column chromatography. Recombinant proteins were aliquoted and stored in GST assay buffer (pH 7.3) containing 20% glycerol and 10% Triton X-100 at -80°C.
EXP1 GST enzyme assay
Purified EXP1 was pre-incubated at pH 6.5 with 0.1% Triton X-100 and 1 mM reduced GSH on ice for 90 minutes, followed by the addition CDNB. Absorbance of the reaction was monitored at 340 nm, every 15 seconds for a period of 10 minutes. GST activity towards hematin was assayed by pre-incubating 100 nM WT protein with 0.1% Triton X-100, 2 mM GSH in pH 6.5 assay buffer for 30 minutes on ice followed by the addition of hematin to initiate hematin degradation. Absorbance was monitored at 395 nm every second for 3 minutes.
EXP1 artesunate inhibition assay
Artesunate (ART) and atovaquone were dissolved in 100% ethanol was added to 100 nM WT EXP1 hematin reactions to determine hematin degradation inhibition. WT EXP1 was pre-incubated in GST assay buffer pH 6.5 with 0.1% Triton X-100 and ART on ice for 30 minutes followed by the addition of 2 mM GSH and hematin. The reaction was monitored at 395 nm, every second for 3 minutes.
Generation of DHA/ART-tolerant parasites
3b1 parasites were selected from the Dd2 strain by culturing asexual blood stage parasites (∼108 on average) in the presence of the artemisinin derivative dihydroartemisinin (DHA) at sub-IC50 concentrations (2.8 nM, as compared to a parental IC50 value of 6.4 nM) for 55 days, followed by progressive increases in drug concentration (up to 28 nM) over the next 200 days. Acquired tolerance to DHA and to artesunate (ART) was evidenced as an increased frequency of recrudescence over a 30-day period following parasite exposure to high concentrations of DHA/ART for four days (up to 112 nM; Eastman et al., manuscript in preparation).
Supplementary Material
Like digital data, biological networks spanning hundreds of genomes can be compressed.
Compression enables gene function prediction at unprecedented network scale.
Application: EXP1 identified as a GST in the malaria parasite Plasmodium falciparum.
EXP1 activity is potently inhibited by artesunate, a frontline antimalarial drug.
Footnotes
Supplemental Information: Supplemental Information includes Extended Experimental Procedures, six figures, four tables, Author Contributions and Acknowledgments.
Publisher's Disclaimer: This is a PDF file of an unedited manuscript that has been accepted for publication. As a service to our customers we are providing this early version of the manuscript. The manuscript will undergo copyediting, typesetting, and review of the resulting proof before it is published in its final citable form. Please note that during the production process errors may be discovered which could affect the content, and all legal disclaimers that apply to the journal pertain.
References
- Abu Bakar N, Klonis N, Hanssen E, Chan C, Tilley L. Digestive-vacuole genesis and endocytic processes in the early intraerythrocytic stages of Plasmodium falciparum. J Cell Sci. 2010;123:441–450. doi: 10.1242/jcs.061499. [DOI] [PubMed] [Google Scholar]
- Altschul SF, Madden TL, Schaffer AA, Zhang J, Zhang Z, Miller W, Lipman DJ. Gapped BLAST and PSI-BLAST: a new generation of protein database search programs. Nucleic Acids Res. 1997;25:3389–3402. doi: 10.1093/nar/25.17.3389. [DOI] [PMC free article] [PubMed] [Google Scholar]
- Andersson C, Piemonte F, Mosialou E, Weinander R, Sun TH, Lundqvist G, Adang AE, Morgenstern R. Kinetic studies on rat liver microsomal glutathione transferase: consequences of activation. Biochim Biophys Acta. 1995;1247:277–283. doi: 10.1016/0167-4838(94)00239-d. [DOI] [PubMed] [Google Scholar]
- Ariey F, Witkowski B, Amaratunga C, Beghain J, Langlois AC, Khim N, Kim S, Duru V, Bouchier C, Ma L, et al. A molecular marker of artemisinin-resistant Plasmodium falciparum malaria. Nature. 2014;505:50–55. doi: 10.1038/nature12876. [DOI] [PMC free article] [PubMed] [Google Scholar]
- Atamna H, Ginsburg H. Heme degradation in the presence of glutathione. A proposed mechanism to account for the high levels of non-heme iron found in the membranes of hemoglobinopathic red blood cells. J Biol Chem. 1995;270:24876–24883. doi: 10.1074/jbc.270.42.24876. [DOI] [PubMed] [Google Scholar]
- Aurrecoechea C, Brestelli J, Brunk BP, Dommer J, Fischer S, Gajria B, Gao X, Gingle A, Grant G, Harb OS, et al. PlasmoDB: a functional genomic database for malaria parasites. Nucleic Acids Res. 2009;37:D539–543. doi: 10.1093/nar/gkn814. [DOI] [PMC free article] [PubMed] [Google Scholar]
- Barabasi AL, Albert R. Emergence of scaling in random networks. Science. 1999;286:509–512. doi: 10.1126/science.286.5439.509. [DOI] [PubMed] [Google Scholar]
- Becker K, Tilley L, Vennerstrom JL, Roberts D, Rogerson S, Ginsburg H. Oxidative stress in malaria parasite-infected erythrocytes: host-parasite interactions. Int J Parasitol. 2004;34:163–189. doi: 10.1016/j.ijpara.2003.09.011. [DOI] [PubMed] [Google Scholar]
- Bozdech Z, Llinas M, Pulliam BL, Wong ED, Zhu J, DeRisi JL. The transcriptome of the intraerythrocytic developmental cycle of Plasmodium falciparum. PLoS Biol. 2003;1:E5. doi: 10.1371/journal.pbio.0000005. [DOI] [PMC free article] [PubMed] [Google Scholar]
- Cardi D, Pozza A, Arnou B, Marchal E, Clausen JD, Andersen JP, Krishna S, Moller JV, le Maire M, Jaxel C. Purified E255L mutant SERCA1a and purified PfATP6 are sensitive to SERCA-type inhibitors but insensitive to artemisinins. J Biol Chem. 2010;285:26406–26416. doi: 10.1074/jbc.M109.090340. [DOI] [PMC free article] [PubMed] [Google Scholar]
- Caspers P, Etlinger H, Matile H, Pink JR, Stuber D, Takacs B. A Plasmodium falciparum malaria vaccine candidate which contains epitopes from the circumsporozoite protein and a blood stage antigen, 5.1. Mol Biochem Parasitol. 1991;47:143–150. doi: 10.1016/0166-6851(91)90173-4. [DOI] [PubMed] [Google Scholar]
- Cheeseman IH, Miller BA, Nair S, Nkhoma S, Tan A, Tan JC, Al Saai S, Phyo AP, Moo CL, Lwin KM, et al. A major genome region underlying artemisinin resistance in malaria. Science. 2012;336:79–82. doi: 10.1126/science.1215966. [DOI] [PMC free article] [PubMed] [Google Scholar]
- Chua HN, Sung WK, Wong L. Exploiting indirect neighbours and topological weight to predict protein function from protein-protein interactions. Bioinformatics. 2006;22:1623–1630. doi: 10.1093/bioinformatics/btl145. [DOI] [PubMed] [Google Scholar]
- Chugh M, Sundararaman V, Kumar S, Reddy VS, Siddiqui WA, Stuart KD, Malhotra P. Protein complex directs hemoglobin-to-hemozoin formation in Plasmodium falciparum. Proc Natl Acad Sci U S A. 2013;110:5392–5397. doi: 10.1073/pnas.1218412110. [DOI] [PMC free article] [PubMed] [Google Scholar]
- Deponte M, Becker K. Glutathione S-transferase from malarial parasites: structural and functional aspects. Methods Enzymol. 2005;401:241–253. doi: 10.1016/S0076-6879(05)01015-3. [DOI] [PubMed] [Google Scholar]
- Eppstein D, Loffler M, Srash D. Paper presented at: 21st International Symposium on Algorithms and Computation (ISAAC 2010) Springer; 2010. Listing All Maximal Cliques in Sparse Graphs in Near-Optimal Time. [Google Scholar]
- Erdin S, Lisewski AM, Lichtarge O. Protein function prediction: towards integration of similarity metrics. Curr Opin Struct Biol. 2011;21:180–188. doi: 10.1016/j.sbi.2011.02.001. [DOI] [PMC free article] [PubMed] [Google Scholar]
- Famin O, Krugliak M, Ginsburg H. Kinetics of inhibition of glutathione-mediated degradation of ferriprotoporphyrin IX by antimalarial drugs. Biochem Pharmacol. 1999;58:59–68. doi: 10.1016/s0006-2952(99)00059-3. [DOI] [PubMed] [Google Scholar]
- Fry M, Pudney M. Site of action of the antimalarial hydroxynaphthoquinone, 2-[trans-4-(4'-chlorophenyl) cyclohexyl]-3-hydroxy-1,4-naphthoquinone (566C80) Biochem Pharmacol. 1992;43:1545–1553. doi: 10.1016/0006-2952(92)90213-3. [DOI] [PubMed] [Google Scholar]
- Gardner MJ, Hall N, Fung E, White O, Berriman M, Hyman RW, Carlton JM, Pain A, Nelson KE, Bowman S, et al. Genome sequence of the human malaria parasite Plasmodium falciparum. Nature. 2002;419:498–511. doi: 10.1038/nature01097. [DOI] [PMC free article] [PubMed] [Google Scholar]
- Gardner MJ, Tettelin H, Carucci DJ, Cummings LM, Smith HO, Fraser CM, Venter JC, Hoffman SL. The malaria genome sequencing project: complete sequence of Plasmodium falciparum chromosome 2. Parassitologia. 1999;41:69–75. [PubMed] [Google Scholar]
- Ginsburg H, Famin O, Zhang J, Krugliak M. Inhibition of glutathione-dependent degradation of heme by chloroquine and amodiaquine as a possible basis for their antimalarial mode of action. Biochem Pharmacol. 1998;56:1305–1313. doi: 10.1016/s0006-2952(98)00184-1. [DOI] [PubMed] [Google Scholar]
- Gribskov M, Robinson NL. Use of receiver operating characteristic (ROC) analysis to evaluate sequence matching. Comput Chem. 1996;20:25–33. doi: 10.1016/s0097-8485(96)80004-0. [DOI] [PubMed] [Google Scholar]
- Gruring C, Heiber A, Kruse F, Ungefehr J, Gilberger TW, Spielmann T. Development and host cell modifications of Plasmodium falciparum blood stages in four dimensions. Nat Commun. 2011;2:165. doi: 10.1038/ncomms1169. [DOI] [PubMed] [Google Scholar]
- Habig M, Blechschmidt A, Dressler S, Hess B, Patel V, Billich A, Ostermeier C, Beer D, Klumpp M. Efficient elimination of nonstoichiometric enzyme inhibitors from HTS hit lists. J Biomol Screen. 2009;14:679–689. doi: 10.1177/1087057109336586. [DOI] [PubMed] [Google Scholar]
- Hiller N, Fritz-Wolf K, Deponte M, Wende W, Zimmermann H, Becker K. Plasmodium falciparum glutathione S-transferase--structural and mechanistic studies on ligand binding and enzyme inhibition. Protein Sci. 2006;15:281–289. doi: 10.1110/ps.051891106. [DOI] [PMC free article] [PubMed] [Google Scholar]
- Holm PJ, Bhakat P, Jegerschold C, Gyobu N, Mitsuoka K, Fujiyoshi Y, Morgenstern R, Hebert H. Structural basis for detoxification and oxidative stress protection in membranes. J Mol Biol. 2006;360:934–945. doi: 10.1016/j.jmb.2006.05.056. [DOI] [PubMed] [Google Scholar]
- Hope IA, Hall R, Simmons DL, Hyde JE, Scaife JG. Evidence for immunological cross-reaction between sporozoites and blood stages of a human malaria parasite. Nature. 1984;308:191–194. doi: 10.1038/308191a0. [DOI] [PubMed] [Google Scholar]
- Hope IA, Mackay M, Hyde JE, Goman M, Scaife J. The gene for an exported antigen of the malaria parasite Plasmodium falciparum cloned and expressed in Escherichia coli. Nucleic Acids Res. 1985;13:369–379. doi: 10.1093/nar/13.2.369. [DOI] [PMC free article] [PubMed] [Google Scholar]
- Ideker T, Sharan R. Protein networks in disease. Genome Res. 2008;18:644–652. doi: 10.1101/gr.071852.107. [DOI] [PMC free article] [PubMed] [Google Scholar]
- Jakobsson PJ, Morgenstern R, Mancini J, Ford-Hutchinson A, Persson B. Common structural features of MAPEG -- a widespread superfamily of membrane associated proteins with highly divergent functions in eicosanoid and glutathione metabolism. Protein Sci. 1999;8:689–692. doi: 10.1110/ps.8.3.689. [DOI] [PMC free article] [PubMed] [Google Scholar]
- Klonis N, Creek DJ, Tilley L. Iron and heme metabolism in Plasmodium falciparum and the mechanism of action of artemisinins. Curr Opin Microbiol. 2013a;16:722–727. doi: 10.1016/j.mib.2013.07.005. [DOI] [PubMed] [Google Scholar]
- Klonis N, Crespo-Ortiz MP, Bottova I, Abu-Bakar N, Kenny S, Rosenthal PJ, Tilley L. Artemisinin activity against Plasmodium falciparum requires hemoglobin uptake and digestion. Proc Natl Acad Sci U S A. 2011;108:11405–11410. doi: 10.1073/pnas.1104063108. [DOI] [PMC free article] [PubMed] [Google Scholar]
- Klonis N, Xie SC, McCaw JM, Crespo-Ortiz MP, Zaloumis SG, Simpson JA, Tilley L. Altered temporal response of malaria parasites determines differential sensitivity to artemisinin. Proc Natl Acad Sci U S A. 2013b;110:5157–5162. doi: 10.1073/pnas.1217452110. [DOI] [PMC free article] [PubMed] [Google Scholar]
- Lam BK, Penrose JF, Xu K, Baldasaro MH, Austen KF. Site-directed mutagenesis of human leukotriene C4 synthase. J Biol Chem. 1997;272:13923–13928. doi: 10.1074/jbc.272.21.13923. [DOI] [PubMed] [Google Scholar]
- Le Roch KG, Johnson JR, Florens L, Zhou Y, Santrosyan A, Grainger M, Yan SF, Williamson KC, Holder AA, Carucci DJ, et al. Global analysis of transcript and protein levels across the Plasmodium falciparum life cycle. Genome Res. 2004;14:2308–2318. doi: 10.1101/gr.2523904. [DOI] [PMC free article] [PubMed] [Google Scholar]
- Maier AG, Rug M, O'Neill MT, Brown M, Chakravorty S, Szestak T, Chesson J, Wu Y, Hughes K, Coppel RL, et al. Exported proteins required for virulence and rigidity of Plasmodium falciparum-infected human erythrocytes. Cell. 2008;134:48–61. doi: 10.1016/j.cell.2008.04.051. [DOI] [PMC free article] [PubMed] [Google Scholar]
- Melvin I, Weston J, Leslie C, Noble WS. RANKPROP: a web server for protein remote homology detection. Bioinformatics. 2009;25:121–122. doi: 10.1093/bioinformatics/btn567. [DOI] [PMC free article] [PubMed] [Google Scholar]
- Meraldi V, Nebie I, Tiono AB, Diallo D, Sanogo E, Theisen M, Druilhe P, Corradin G, Moret R, Sirima BS. Natural antibody response to Plasmodium falciparum Exp-1, MSP-3 and GLURP long synthetic peptides and association with protection. Parasite Immunol. 2004;26:265–272. doi: 10.1111/j.0141-9838.2004.00705.x. [DOI] [PubMed] [Google Scholar]
- Mihalek I, Res I, Lichtarge O. A family of evolution-entropy hybrid methods for ranking protein residues by importance. J Mol Biol. 2004;336:1265–1282. doi: 10.1016/j.jmb.2003.12.078. [DOI] [PubMed] [Google Scholar]
- Morgenstern R, Zhang J, Johansson K. Microsomal glutathione transferase 1: mechanism and functional roles. Drug Metab Rev. 2011;43:300–3006. doi: 10.3109/03602532.2011.558511. [DOI] [PubMed] [Google Scholar]
- Mukanganyama S, Naik YS, Widersten M, Mannervik B, Hasler JA. Proposed reductive metabolism of artemisinin by glutathione transferases in vitro. Free Radic Res. 2001;35:427–434. doi: 10.1080/10715760100300941. [DOI] [PubMed] [Google Scholar]
- Newman MEJ. Power laws, Pareto distributions and Zipf's law. Contemporary Physics. 2005;46:323–351. [Google Scholar]
- O'Neill PM, Barton VE, Ward SA. The molecular mechanism of action of artemisinin--the debate continues. Molecules. 2010;15:1705–1721. doi: 10.3390/molecules15031705. [DOI] [PMC free article] [PubMed] [Google Scholar]
- Ochoa A, Llinas M, Singh M. Using context to improve protein domain identification. BMC Bioinformatics. 2011;12:90. doi: 10.1186/1471-2105-12-90. [DOI] [PMC free article] [PubMed] [Google Scholar]
- Oexle K. Data compressibility, physical entropy, and evolutionary a priori relation between observer and object. Phys Rev E Stat Phys Plasmas Fluids Relat Interdiscip Topics. 1995;51:2651–2653. doi: 10.1103/physreve.51.2651. [DOI] [PubMed] [Google Scholar]
- Park DJ, Lukens AK, Neafsey DE, Schaffner SF, Chang HH, Valim C, Ribacke U, Van Tyne D, Galinsky K, Galligan M, et al. Sequence-based association and selection scans identify drug resistance loci in the Plasmodium falciparum malaria parasite. Proc Natl Acad Sci U S A. 2012;109:13052–13057. doi: 10.1073/pnas.1210585109. [DOI] [PMC free article] [PubMed] [Google Scholar]
- Radivojac P, Clark WT, Oron TR, Schnoes AM. A large-scale evaluation of computational protein function prediction. Nature Mthods. 2013 doi: 10.1038/nmeth.2340. [DOI] [PMC free article] [PubMed] [Google Scholar]
- Sharan R, Ulitsky I, Shamir R. Network-based prediction of protein function. Mol Syst Biol. 2007;3:88. doi: 10.1038/msb4100129. [DOI] [PMC free article] [PubMed] [Google Scholar]
- Simmons D, Woollett G, Bergin-Cartwright M, Kay D, Scaife J. A malaria protein exported into a new compartment within the host erythrocyte. Embo J. 1987;6:485–491. doi: 10.1002/j.1460-2075.1987.tb04779.x. [DOI] [PMC free article] [PubMed] [Google Scholar]
- Simossis VA, Kleinjung J, Heringa J. Homology-extended sequence alignment. Nucleic Acids Res. 2005;33:816–824. doi: 10.1093/nar/gki233. [DOI] [PMC free article] [PubMed] [Google Scholar]
- Spielmann T, Gardiner DL, Beck HP, Trenholme KR, Kemp DJ. Organization of ETRAMPs and EXP-1 at the parasite-host cell interface of malaria parasites. Mol Microbiol. 2006;59:779–794. doi: 10.1111/j.1365-2958.2005.04983.x. [DOI] [PubMed] [Google Scholar]
- Takala-Harrison S, Clark TG, Jacob CG, Cummings MP, Miotto O, Dondorp AM, Fukuda MM, Nosten F, Noedl H, Imwong M, et al. Genetic loci associated with delayed clearance of Plasmodium falciparum following artemisinin treatment in Southeast Asia. Proc Natl Acad Sci U S A. 2013;110:240–245. doi: 10.1073/pnas.1211205110. [DOI] [PMC free article] [PubMed] [Google Scholar]
- Tatusov RL, Koonin EV, Lipman DJ. A genomic perspective on protein families. Science. 1997;278:631–637. doi: 10.1126/science.278.5338.631. [DOI] [PubMed] [Google Scholar]
- Teuscher F, Chen N, Kyle DE, Gatton ML, Cheng Q. Phenotypic changes in artemisinin-resistant Plasmodium falciparum lines in vitro: evidence for decreased sensitivity to dormancy and growth inhibition. Antimicrob Agents Chemother. 2012;56:428–431. doi: 10.1128/AAC.05456-11. [DOI] [PMC free article] [PubMed] [Google Scholar]
- UniProt. The Universal Protein Resource (UniProt) in 2010. Nucleic Acids Res. 2010;38:D142–148. doi: 10.1093/nar/gkp846. [DOI] [PMC free article] [PubMed] [Google Scholar]
- Vazquez A, Flammini A, Maritan A, Vespignani A. Global protein function prediction from protein-protein interaction networks. Nat Biotechnol. 2003;21:697–700. doi: 10.1038/nbt825. [DOI] [PubMed] [Google Scholar]
- Venner E, Lisewski AM, Erdin S, Ward RM, Amin SR, Lichtarge O. Accurate protein structure annotation through competitive diffusion of enzymatic functions over a network of local evolutionary similarities. PLoS One. 2010;5:e14286. doi: 10.1371/journal.pone.0014286. [DOI] [PMC free article] [PubMed] [Google Scholar]
- von Mering C, Jensen LJ, Kuhn M, Chaffron S, Doerks T, Kruger B, Snel B, Bork P. STRING 7--recent developments in the integration and prediction of protein interactions. Nucleic Acids Res. 2007;35:D358–362. doi: 10.1093/nar/gkl825. [DOI] [PMC free article] [PubMed] [Google Scholar]
- von Mering C, Jensen LJ, Snel B, Hooper SD, Krupp M, Foglierini M, Jouffre N, Huynen MA, Bork P. STRING: known and predicted protein-protein associations, integrated and transferred across organisms. Nucleic Acids Res. 2005;33:D433–437. doi: 10.1093/nar/gki005. [DOI] [PMC free article] [PubMed] [Google Scholar]
- Wang B, Yang Xh, Wang Wl. A novel scale-free network model based on clique growth. J Cent South Univ Technol. 2009;16:474–477. [Google Scholar]
- Witkowski B, Lelievre J, Barragan MJ, Laurent V, Su XZ, Berry A, Benoit-Vical F. Increased tolerance to artemisinin in Plasmodium falciparum is mediated by a quiescence mechanism. Antimicrob Agents Chemother. 2010;54:1872–1877. doi: 10.1128/AAC.01636-09. [DOI] [PMC free article] [PubMed] [Google Scholar]
- Witkowski B, Lelievre J, Nicolau-Travers ML, Iriart X, Njomnang Soh P, Bousejra-Elgarah F, Meunier B, Berry A, Benoit-Vical F. Evidence for the contribution of the hemozoin synthesis pathway of the murine Plasmodium yoelii to the resistance to artemisinin-related drugs. PLoS One. 2012;7:e32620. doi: 10.1371/journal.pone.0032620. [DOI] [PMC free article] [PubMed] [Google Scholar]
- World Health Organization (WHO) Section 8.4.1 In Guidelines for the treatment of malaria. 2nd. World Health Organization; 2011. – Rev 1. [Google Scholar]
- Yule GU. A mathematical theory of evolution based on the conclusions of Dr. J. C. Willis. Philos Trans R Soc London B. 1925;213:21–87. [Google Scholar]
Associated Data
This section collects any data citations, data availability statements, or supplementary materials included in this article.