Abstract
Epidermal growth factor receptor (EGFR) is widely used as a biomarker for pathological grading and therapeutic targeting of human cancers. This study investigates expression, spatial distribution as well as the endocytosis of EGFR in single breast cancer cells using surface-enhanced Raman spectroscopy (SERS). By incubating anti-EGFR antibody conjugated SERS nanoprobes with an EGFR-over-expressing cancer cell line, A431, EGFR localization was measured over time and found to be located primarily at the cell surface. To further validate the constructed SERS probes, we applied this SERS probes to detect the EGFR expression on breast cancer cells (MDA-MB-435, MDA-MB-231) and their counterpart cell lines in which EGFR expression was down-regulated by breast cancer metastasis suppressor 1 (BRMS1). The results showed that SERS method not only confirms immunoblot data measuring EGFR levels, but also adds new insights regarding EGFR localization and internalization in living cells which is impossible in immunoblot method. Thus, SERS provides a powerful new tool to measure biomarkers in living cancer cells.
Keywords: Breast cancer cells, Raman line profiling, Raman depth mapping
1. Introduction
Epidermal growth factor receptor (EGFR), a receptor tyrosine kinase, is overexpressed in a variety of human cancers, including all breast cancer subtypes [1]. Overexpression of EGFR in breast cancer is generally associated with poor prognosis and high recurrence rates [2]. Since EGFR status is related to cancer progression, there has been extensive research to develop agents targeting EGFR and its corresponding signaling pathways [3–5]. Therefore, improved methods to quantify and measure function of EGFR in breast cancer cells could improve diagnosis and treatment of breast cancer.
Currently, the most commonly used methods to assess EGFR status in clinical cancer specimens are immunohistochemistry and immunofluorescence staining [6–8]. Quantification can be done using immunoblotting. However, these methods either need cell fixation (immunohistochemistry and immunoblotting), or face the problem of photobleaching (immunofluorescence), rendering them non-suitable for measuring dynamic alterations of cell receptors and ligands.
Surface-enhanced Raman spectroscopy (SERS) is a powerful analytical tool in biological applications which has attracted considerable attention recently. SERS offers extremely high enhancement and turns the weak inelastic scattering effect of photons into a structurally sensitive nanoscale probe [9]. In turn, one can realize ultrasensitive levels of detection and non-invasive tagging of specific bioanalytes in living cells and animals [10]. A key to the SERS technique is the metal nanoparticle (NP, e.g., AuNP or AgNP) encoded with sensitive Raman reporter molecules followed by the coating of mono- or multi-layer protective polymers (e.g., silica, polyelectrolyte and PEG) which improve stability and biocompatibility [11–14]. Several studies have reported using SERS probes to target cancer cells in vitro or in vivo [11,14–19], including measurement of EGFR [11,15,19]. However, very little SERS studies were focused on EGFR cellular distribution, EGFR-mediated bioprocess, and how EGFR is regulated by metastasis suppressors.
Metastasis suppressors are a relatively recently described family of molecules that suppress the development of cancer metastasis without blocking primary tumor growth (reviewed in [20]). Of the approximately 30 metastasis suppressors (genes) identified to date, BRMS1 has been well characterized for its ability to regulate molecules that alter cellular response to microenvironmental signals which can be different between orthotopic sites (i.e., the mammary gland for breast cancer) and ectopic sites (i.e., sites of metastasis) [21], thought to explain why metastasis suppressors allow primary tumor growth, but not metastatic colonization. BRMS1 regulates EGFR [21] and osteopontin [22] expression, phosphoinositide [23], NFκB [24] and PKA [25] signaling, connexin expression and gap junctional intercellular communication [20,26], all of which play significant roles in cancer progression. The mechanism by which BRMS1 does these myriad things is thought to be as part of SIN3 histone deacetylase regulation of chromatin structure [27].
Understanding how BRMS1 directly impacts cellular responses to signals from the microenvironment is thought to be key to defining the critical mechanisms of action. Unfortunately, the tools to measure ligand-receptor or antibody–antigen interactions are suboptimal for this purpose. Therefore, we designed a SERS probe based on polyelectrolyte-coated gold nanorods (GNRs) to specifically recognize and detect EGFR molecules (via antibody–antigen interaction) on the cell surface of breast cancer cells. Using an EGFR over-expressing cell line (e.g., A341), we validated the ability of the antibody-conjugated SERS probe to measure EGFR distribution and internalization on single cancer cells. Then, using BRMS1-expressing cells and comparing them to their parental breast cancer counterparts, we demonstrated that our constructed SERS is able to distinguish EGFR levels in different cancer cells and to provide spatial information of EGFR expressed on single cancer cell surface.
2. Materials and methods
2.1. Materials
Ultrapure water (18 MΩ cm−1) was used in this work. All chemicals were purchased from commercial source and were used as received: gold nanorods (5.1 × 10¹¹ particles mL−1, Nanopartz Inc., USA), monoclonal anti-EGFR antibody (Invitrogen). A431 cell line was obtained from American Type Culture Collection (ATCC). MDA-MB-435 (435), MDA-MB-231 (231), MDA-MB-435 expressing BRMS1 (435BRMS1) and MDA-MB-231 expressing BRMS1 (231BRMS1) were described previously [21]. Cell culture media and supplies were purchased from Thermo Fisher Scientific Inc. (Waltham, MA). Other chemicals were purchased from Sigma–Aldrich (St. Louis, MO) at the highest available purity.
2.2. Instrumentation
The morphology of the gold nanorods (GNRs) SERS probe was determined by a FEI Titan 80–300 transmission electron microscope (TEM) in a bright-field mode. Extinction spectra of the GNRs were taken by an Agilent Cary 60 UV–vis spectrophotometer controlled by Cary WinUV software. Dark field images of cell samples were obtained by using an Olympus IX71 Inverted Microscope equipped with an oil-immersed dark field condenser (NA = 1.5) and a 100× objective lens. Images were acquired using DPController software (Olympus).
2.3. Preparation of the SERS probe
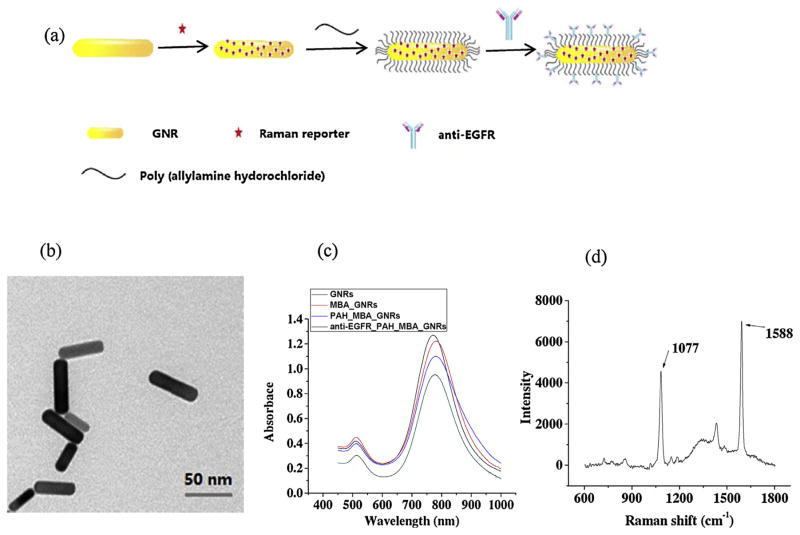
As shown in Fig. 1a, the synthesis of the SERS probe includes three steps: (1) bare GNRs and Raman reporter molecules 4-mercaptobenzoic acid (MBA) were mixed together with a molar ratio of 1:10,000, conjugating the reporter molecules onto GNRs through Au-S interaction; (2) polyallylamine hydrochloride (PAH) solution (28 mg mL−1, 200 μL) and NaCl solution (1 mM, 100 μL) were added to 1 mL of GNRs solution containing 1 nM MBA-GNRs and reacted for 3 h; and (3) after removing the excess PAH by centrifugation, monoclonal antibody anti-EGFR (0.21 mg mL−1, 10 μL) was added to the solution and incubated for 1 h. Excess antibody was removed by centrifugation. The SERS probe was stable for several days at 4 °C in solution.
Fig. 1.
(a) Schematic illustration of the fabrication of the gold nanorods-based, antibody-functionalized SERS probe. (b–d) Characterizations of the SERS probe. (b) TEM image of the bare gold nanorods, scale bar is 50 nm. (c) Extinction spectra of the GNRs at each step of the coating process. (d) SERS spectrum of the antibody-functionalized gold nanorods with 4-MBA as the reporter molecules. GNR: gold nanorod; 4-MBA: 4-mercaptobenzoic acid.
2.4. Cell culture
Cell lines were grown in a mixture of Dulbecco’s-modified Eagle’s medium (DMEM) and Ham’s F-12 medium (1:1) supplemented with 5% fetal bovine serum (Atlanta Biologicals, Atlanta, GA) in a humidified atmosphere at 37 °C with 5% CO2. Cells were at 80–90% confluence when used for experiments.
2.5. Immunoblotting
Cells were rinsed twice with ice-cold PBS and lysed in a buffer containing 25 mM Tris–HCl (pH 7.4), β-glycerol phosphate (50 mM), EDTA (0.5 mM), glycerol (5%), triton X-100 (0.1%), sodium orthovanadate (1 mM), benzamidine (1 mM), and a protease inhibitor cocktail containing aprotinin, leupeptin, and phenyl-methylsulfonyl fluoride (Roche, Indianapolis, IN). Protein concentration was determined using a BCA assay (Pierce, Rockford, IL). Protein was denatured with Laemmli’s buffer at 95 °C for 5 min and lysate (50 μg) was loaded to each well. Proteins were separated using 10% SDS-PAGE gel electrophoresis and resolved proteins were transferred to PVDF before incubating in Tris-buffered saline containing Tween-20 (0.05%) and fat-free dry milk (5%) for 1 h at room temperature. Membranes were incubated with primary antibodies to EGFR (Cell Signaling, Danvers, MA) β-Actin (Sigma, St. Louis, MO) and BRMS1 overnight at 4 °C and subsequently with HRP-conjugated secondary antibody at room temperature for 1 h. Signals were visualized using ECL (Pierce, Rockford, IL) following manufacturer’s instructions.
2.6. Immunofluorescence imaging
To evaluate EGFR localization, MDA-MB-435/231 and 435BRMS1/231BRMS1 cells grown on coverslips for 24 h were fixed using 4% para-formaldehyde (Electron Microscopy Sciences, Hatfield, PA) for 20 min, and permeabilized using 0.1% Triton X-100 (Union Carbide Corporation, Texas City, TX) for 10 min. After blocking with 5% BSA in PBS, cells were incubated with anti-EGFR antibody conjugated with Alexia Fluor 555 at 1:50 dilution (Life technologies, Carlsbad, CA) in 5% BSA solution overnight at 4 °C. After washing the cells thrice with PBS, the cover slips were mounted using Vectashield mounting solution containing the nuclear counter-stain 4′,6-diamidino-2-phenylindole (Vector laboratories Inc., Burlingame, CA). Images were collected under a Nikon inverted epifluorescence microscope. Representative images were combined, and processed using ImageJ software.
2.7. SERS measurement on living cancer cells
Cells were used at a density of 0.5 × 10⁵ cells per milliliter. Media (2 mL) containing cells were placed on a cleaned magnesium fluoride (MgF2) optical window (United Crystals Co., Port Washington, NY) in order to minimize background in Raman measurement. Cells cultured on MgF2 were incubated with the antibody conjugated SERS probes for different time (1.5, 3, 4.5 and 6 h) and washed with PBS to remove non-adsorbed probes prior to Raman measurements.
Raman spectra were measured by a Renishaw inVia Raman system (controlled by WiRE 3.3 software, Renishaw, UK) connected to a Leica microscope (Leica DMLM, Leica microsystems, USA) equipped with a 785 nm near-IR laser that was focused through a 63 × water immersion objective (NA = 0.90, Leica Microsystems). The instrument was calibrated with silicon (Raman peak centered at 520.5 cm−1). Raman spectra (600 and 1800 cm−1) were recorded using 1 accumulation per 10 s laser exposure (1% laser intensity (3 mW) static mode). For Raman line and depth profiling, multiple spectra were acquired at different locations with constant intervals (line: 3 μm; depth: 1.5 μm). Spectral smoothing, baseline subtraction and Raman mapping generation were performed using Renishaw WiRE 3.3 software. The processed spectra were exported to Origin Pro 8.5 software (OriginLab Corp., USA) for statistical analysis.
3. Results and discussion
3.1. Characterization of the SERS probe
Fig. 1a illustrates preparation of the MBA-encoded, PAH-coated, and anti-EGFR functionalized GNRs as the SERS probes. The size and morphology of the SERS probes were visualized by TEM (Fig. 1b). The successful coating of PAH and antibody was confirmed by a thin dim film on the surface of GNRs and the slight red-shift of the maximum plasmon peaks (Fig. 1c). MBA was used as a Raman reporter molecule to optimize SERS sensitivity due to its strong affinity to Au surface and simple SERS spectrum. The PAH molecule, a polyelectrolyte with positive charge, plays an important role by, not only preventing GNR aggregation, but also providing biocompatibility to the SERS probes (see supporting information, Fig. S1). Compared with other polymer coatings, such as thiol-PEG and silica, polyelectrolyte coating simplified the process, and more importantly, avoided adsorption competition with Raman reporters [14,28]. Taken together, these conditions were expected to provide higher SERS sensitivity.
Fig. 1c shows the stepwise extinction spectra of the GNR during the preparation process. The longitudinal plasmon resonance band for bare GNR is located at ca. 770 nm, which is related to the 3.7 aspect ratio of the nanorods (Fig. 1b). The nanorod longitudinal plasmon band (770 nm) is favorable in this work because it overlaps, in part, with the excitation laser source (785 nm), providing 10× surface enhancement than substrates whose Plasmon bands do not overlap with the excitation source [29]. After coating with MBA, PAH and antibody, the longitudinal plasmon band maxima red-shifted 5 nm, which is thought to be due to changes in local refractive index. Red shifts were also reported previously [14,30,31]. A typical SERS spectrum of the MBA-linked SERS probe is shown in Fig. 1d. The two highest Raman peaks (1077 and 1588 cm−1) were observed and could be assigned to the ring breathing and axial deformation modes of MBA, respectively [32,33]. Since the peak at 1077 cm−1 was the most stable and reproducible characteristic band for the reporter, MBA, it was used for further Raman analysis in this study.
3.2. Detection of EGFR on single A431 cells
SERS has been widely applied since 1970s when it’s reported that molecular adsorption onto a roughened noble metal surface led to electromagnetic and chemical enhancement mechanisms [34,35]. Using a molecule with an intense and distinguishable Raman signature as a reporter molecule for sensing and quantification is called extrinsic SERS (reviewed in [36]). In the presented work, the extrinsic SERS strategy is used – we are trying to detect cell surface receptor EGFR using anti-EGFR antibody targeted SERS nanoprobes, conjugated with MBA as reporter molecule, and track the EGFR localization by measuring the specific Raman signature of MBA.
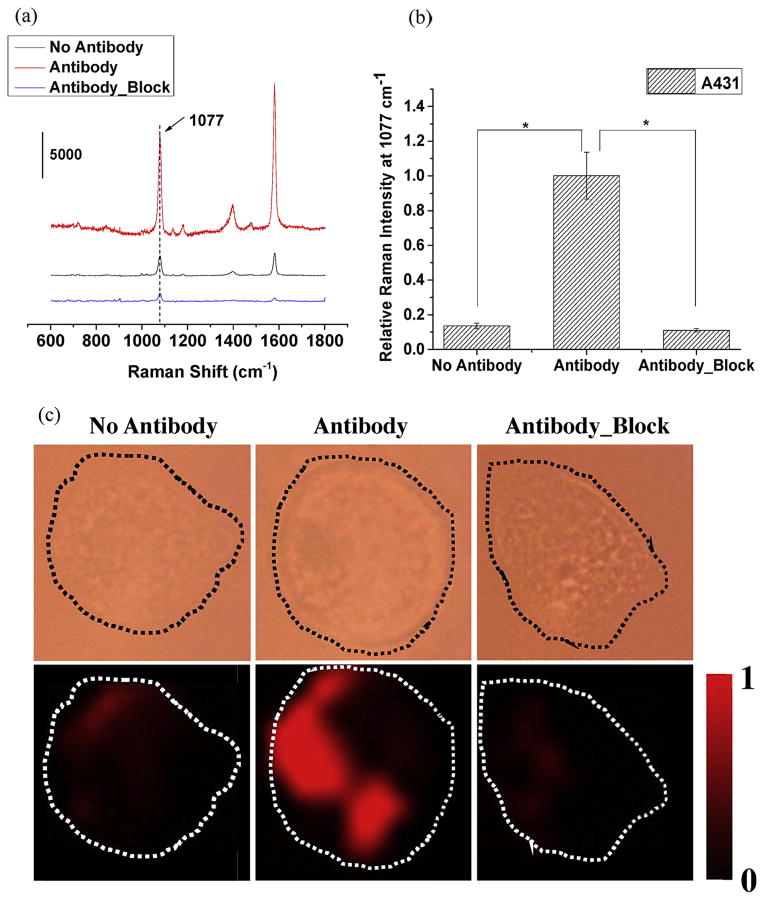
In order to investigate whether the anti-EGFR functionalized SERS probe can successfully detect the expression of EGFR on cells, A431, which highly expresses EGFR [37–39], was used (Fig. 2). The SERS probe were incubated with A431 cells under three different conditions: (1) cells were incubated with SERS probes without anti-EGFR antibody conjugation for 1.5 h at 37 °C (“No Antibody”, representing non-specific interaction); (2) cells were incubated with anti-EGFR antibody-conjugated SERS probes for 1.5 h at 37 °C (“Antibody”); (3) cells were pre-blocked with free anti-EGFR antibody for 1 h before incubation with the antibody-conjugated probe for 1.5 h (“Antibody_Block”). Typical SERS spectra for the three groups are shown in Fig. 2a. “Antibody group” shows two major intense peaks at 1077 cm−1 and 1588 cm−1, while the peak intensities are very low in “No Antibody” group and “Antibody_Block” group. The Raman intensities at 1077 cm−1 for “Antibody” group was significantly higher (P <0.001, n = 60) than the other two treatment groups (Fig. 2b), demonstrating the specificity of the antibody-antigen interaction. SERS mapping images revealed intense signals in “Antibody” group but significantly less in the other two conditions (Fig. 2c). Thus, the findings confirm that SERS specifically recognizes EGFR on A431 cells by antibody–antigen interactions.
Fig. 2.
Performance assessment of constructed SERS probe. (a) Typical SERS spectra, (b) normalized average Raman intensities at 1077 cm−1 (curve numbers, n = 60), and (c) typical single-cell bright-field and corresponding SERS mapping images of A431 cells incubated with (1) SERS probes without anti-EGFR antibody conjugation (No Antibody); (2) anti-EGFR antibody-conjugated SERS probes; (3) cells were blocked with free anti-EGFR antibody molecules prior to the incubation with antibody-conjugated SERS probes (Antibody_Block). Raman spectral images were created by the selection of peak 1077 cm−1. The intensities were normalized between the lowest (0) and highest (1) color values. Image size: 30 × 30 μm2. *P <0.001.
3.3. Local distribution and depth profiling of EGFR on single A431 cells
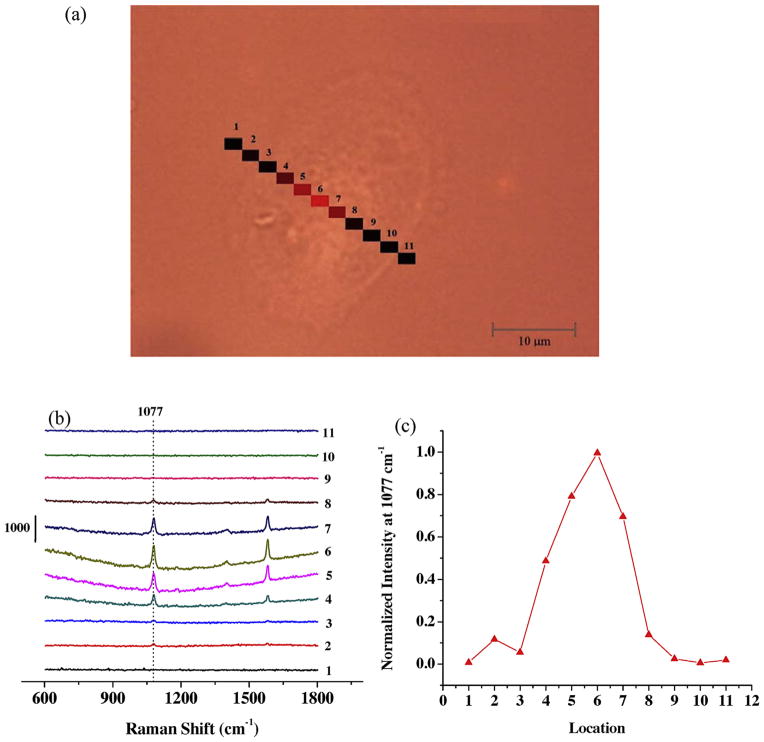
The spatial distribution of EGFR on single A431 cell surface was also studied. Fig. 3 shows the Raman line profiling spectra when the laser spot was scanning over different locations on a single A431 cell. Eleven separated locations across the cell were measured along a straight line (Fig. 3a). Only at central locations (#4–7) were there distinguishable SERS bands (Fig. 3b). Fig. 3c shows normalized SERS intensity at 1077 cm−1 at all 11 points on the cell surface. This Raman line profiling shows that EGFR markers were not homogeneously distributed on the cell surface, and seem mainly located on the central region of the cell surface of this selected cell. This kind of EGFR distribution had also been reported in some other studies, especially when EGF had been introduced [40,41].
Fig. 3.
Raman line profiling of SERS probes bind to single A431 cell surface. (a) Image of an A431 cell showing 11 different locations with Raman measurements. (b) Raman profiles of the 11 points shown in (a). (c) Normalized Raman intensities at 1077 cm−1 at those eleven different locations.
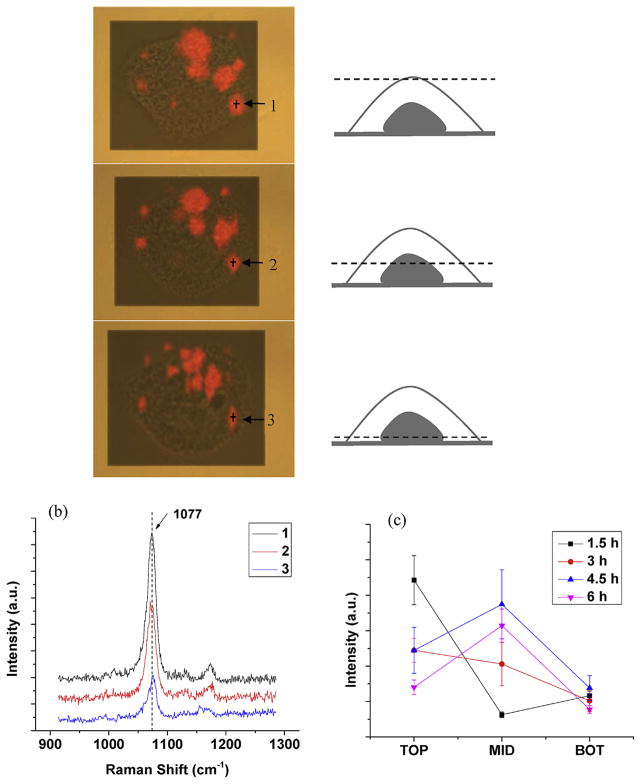
To study antibody-functionalized gold nanoparticles are internalized via receptor-mediated endocytosis [42,43], a confocal Raman setting was applied to detect the SERS spectra collected at depth levels ranging from 0 (top, upper cell surface), 3 μm (middle, middle surface of the cell), to 6 μm(bottom, lower surface of the cell)(Fig. 4). At 3 h incubation of the SERS probes with A431 cells, Raman streamline mapping (at 1077 cm−1) of the same cells at three different depths (0, 3, and 6 μm) were captured sequentially (Fig. 4a). Red areas in the mapping images represent the presence of the EGFR molecules in single A431 cells. Raman spectra at an EGFR aggregate at different depths (points1–3, Fig. 4a) are shown in Fig. 4b. It shows the highest peak intensity at the apical surface and lowest at the basal cell membrane, indicating that majority of the GNRs has still yet to be internalized at 3 h incubation. To further study the EGFR-mediated endocytosis of nanoparticle, we measured the Raman peak intensities at EGFR aggregates at top, middle and bottom of the cells with 1.5, 3, 4.5 and 6 h incubation of SERS probes. As shown in Fig. 4c, at 1–3 h incubation, the highest peak intensities are at the top surface of the cells, indicating that the internalization level is low; while at 4–6 h incubation, the highest intensities are at the middle, which means most of the GNRs are internalized into the cells. As reported, the process of EGFR mediated endocytosis is strongly influenced by the applied targeting ligands [44]. Here we used monoclonal antibody as the targeting ligand, which is much slower than the EGF targeted EGFR endocytosis [34]. This is because EGF can activate the receptor signaling, whereas the antibody binding is unable to lead to considerable downstream receptor activation. Fluorescence live/dead imaging test was conducted to prove that cells remained high viability (>95%) after incubation with SERS probes for 1.5, 3, 4.5 and 6 h (Fig. S1).
Fig. 4.
Raman depth profiling of SERS probes bound to single A431 cell surface. (a) Raman streamline mapping (at 1077 cm−1) of a living A431 cell. Three images (top, middle, and bottom) were respectively obtained at three different depths (0, 3 and 6 μm), when the cells were incubated with the SERS probes for 3 h. (b) The typical SERS spectra measured on the single cell shown in (a) at locations 1–3 with different depths. (c) Raman intensities (1077 cm−1) at different depths with 1.5, 3, 4.5 and 6 h incubation times, n = 90, Error bar: SE of mean. Image size: 52 × 39 μm2.
3.4. BRMS1-regulated EGFR expression on MDA-MB-435 and MDA-MB-231 breast cancer cells
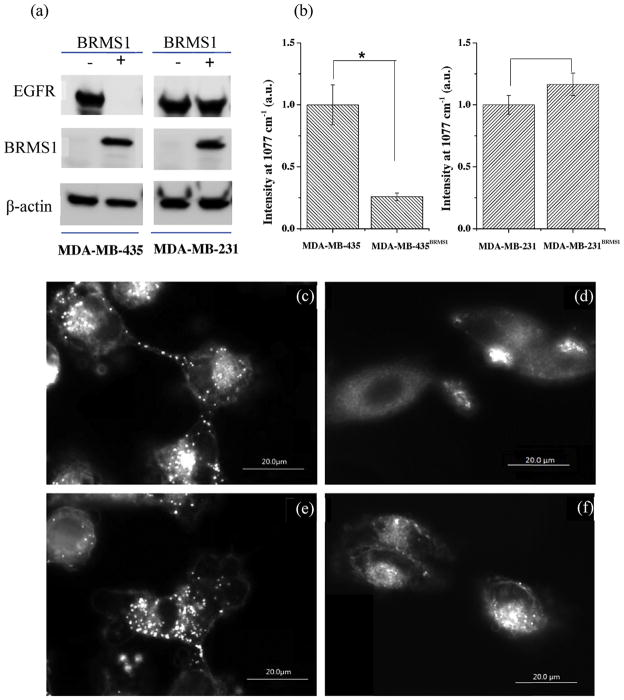
EGFR was significantly down-regulated in BRMS1-expressing human breast cancer cell lines as previously reported [21]. In this report, the immunoblot results showed that reduction of EGFR in 231BRMS1 cells was not as dramatic as previously reported. Nonetheless, the complete loss of EGFR in 435BRMS1 cells was readily apparent by immunoblot (Fig. 5a). Using SERS probe to measure EGFR (Fig. 5b), 435BRMS1 cells have significantly (P <0.001, n = 60) lower levels than parental 435 cells. The results are not significantly different when comparing 231 and 231BRMS1 cells (P > 0.05, n = 60). The SERS results are essentially consistent with traditional western blot data (Fig. 5a). However, SERS mapping provides the spatial distribution of EGFR at the single cell level that western blot does not have. Dark-field microscopic imaging was also done (Fig. 5c–f) since GNR scatter light intensely and they are much brighter than cells in the dark field [45,46]. The presence of many bright spots on 435 cells (Fig. 5c) reflects abundant EGFR expressed, while the abundance of SERS-positive spots is negligible on 435BRSM1 cells (Fig. 5d). The numbers of bright spots in 231 cells are not readily distinguishable than those observed in 231BRMS1 cells, consistent with the western blot results. Based on the dark field images and SERS spectra in living cells, the constructed SERS probes can be utilized as multimodal cell imaging sensors.
Fig. 5.
Comparison of EGFR detection by (a) immunoblot and (b) SERS on MDA-MB-435 and MDA-MB-231 breast cancer cells, and their BRMS1 expressing cell lines MDA-MB-435BRMS1 and MDA-MB-231BRMS1. (c–f) Dark field images of the SERS probes on MDA-MB-435 and MDA-MB-231 cells with (c, e) and without (d, f) BRMS1 expression. *P <0.001. n = 60, number of spectra collected.
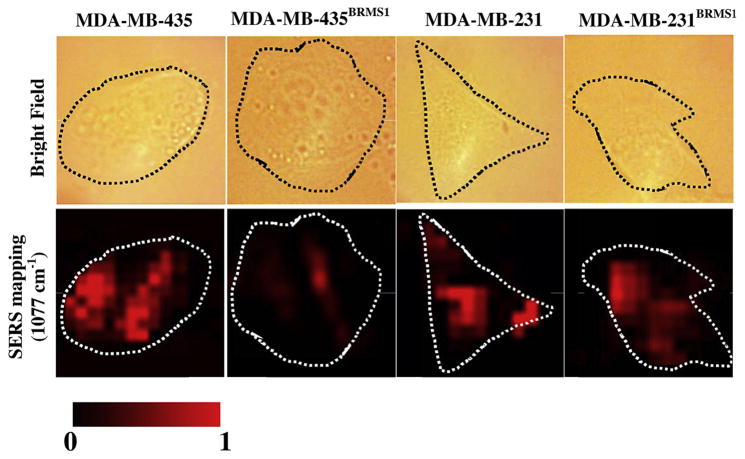
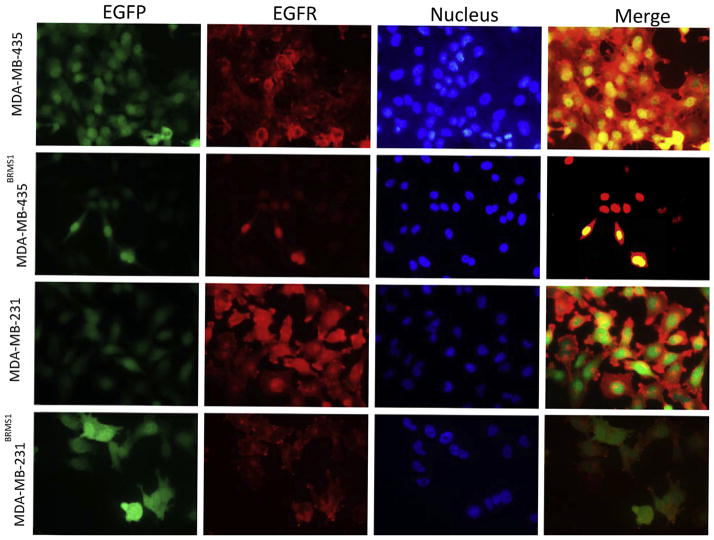
Recognition of EGFR molecules and analysis of their distribution on single cells was done by SERS mapping at 1077 cm−1 comparing 231 and 435 cells with their BRMS1-expressing counterparts (Fig. 6). Bright field images (upper panel) and their corresponding SERS maps (lower panel) were simultaneously recorded. EGFR was heterogeneously distributed on the plasma membrane. To further validate the observations from SERS method, 435, 231, 435BRMS1 and 231BRMS1 cells were labeled with anti-EGFR antibody conjugated to Alexia Fluor 555 to measure EGFR localization using immunofluorescence (IF) imaging. As presented in Fig. 7, the IF images confirmed the down-regulation of EGFR expression by BRMS1 gene in MDA-MB-435 and MDA-MB-231 cells as our SERS results suggested. The consistency between SERS and IF results indicates SERS is a tool as powerful as IF to detect cellular receptors as single-cell level. Moreover, SERS possesses potential advantages over fluorescence in multiplex imaging of cell receptors due to much narrower spectroscopic bands of Raman spectra.
Fig. 6.
Bright field and SERS mapping (1077 cm−1) images of four breast cancer cell lines: 435, 435BRMS1, 231 and 231BRMS1. The intensities were normalized between the lowest (0) and the highest (1) color values for each pair of 435 vs. 435BRMS1, and 231 vs. 231BRMS1. Mapping size for all images is 30 × 30 μm2.
Fig. 7.
Immune-fluorescence images for showing the expression of EGFR in MDA-MB-435, MDA-MB-435BRMS1, MDA-MB-231 and MDA-MB-231BRMS1 cells. First column: EGFP; second column: EGFR; third column: nucleus; fourth column: merge of first three columns.
4. Conclusions
We developed a GNR-based SERS probe that allows live-cell targeting and imaging of EGFR, a widely recognized breast cancer marker. The probe successfully detected EGFR and distinguished heterogeneity in its distribution on the plasma membrane of cells growing in culture. Furthermore, using Raman depth mapping, internalization of the SERS probes could be monitored temporally and spatially. Data using the SERS probes are consistent with standard detection methods, but affords the capability to measure dynamic changes molecules in living cells. Thus, our SERS probes can be used as a noninvasive sensing agent for detection of spatial distribution and dynamic change of EGFR on living breast cancer cells at the single cell level, which is a significantly complement to the traditional biochemical approaches like immunoblotting and immunofluorescence. This work also demonstrated the potential of using SERS to investigate EGFR-involved physiological process such as EGFR-mediated nanoparticle uptake and EGFR–EGFR interaction. Our future work is to further validate the specificity of this SERS probe in detection of EGFR at cellular level by using EGFR knock out cells, and to study multiple cell surface receptors and their interactions by using different Raman reporter labeling; besides, using tip-enhanced Raman spectroscopy (TERS) would be alternative option allowing us to achieve single-molecular detection of cell receptors at nanoscale cell surface.
Supplementary Material
HIGHLIGHTS.
Gold nanorods based SERS probe was successfully developed for biomarker detection.
Cancer biomarker EGFR was detected on single cancer cells.
SERS probe was applied to detect EGFR expression in four cancer cell lines.
SERS offers noninvasive and dynamic imaging modality for biosystems.
Acknowledgments
We thank Kurt Langworthy for the help of TEM imaging of gold nanorods. This work is supported by CDMRP award W81XWH-10-1-0668(AZ), U.S. National Cancer Institute RO1-CA87728 (DRW), Susan G. Komen for the Cure SAC11037 (DRW) and the National Foundation for Cancer Research-Center for Metastasis Research (DRW).
Abbreviations
- SERS
surface-enhanced Raman spectroscopy
- EGFR
epidermal growth factor receptor
- BRMS1
breast cancer metastasis supressor 1
Appendix A. Supplementary data
Supplementary data associated with this article can be found, in the online version, at http://dx.doi.org/10.1016/j.aca.2014.06.036.
References
- 1.Masuda H, et al. Role of epidermal growth factor receptor in breast cancer. Breast Cancer Res Treat. 2012;136(2):331–345. doi: 10.1007/s10549-012-2289-9. [DOI] [PMC free article] [PubMed] [Google Scholar]
- 2.Sainsbury JRC, et al. Epidermal-growth-factor receptor status as predictor of early recurrence of and death from breast-cancer. Lancet. 1987;1(8547):1398–1402. doi: 10.1016/s0140-6736(87)90593-9. [DOI] [PubMed] [Google Scholar]
- 3.Grunwald V, Hidalgo M. Developing inhibitors of the epidermal growth factor receptor for cancer treatment. J Natl Cancer Inst. 2003;95(12):851–867. doi: 10.1093/jnci/95.12.851. [DOI] [PubMed] [Google Scholar]
- 4.Chen G, et al. Targeting the epidermal growth factor receptor in non-small cell lung cancer cells: the effect of combining RNA interference with tyrosine kinase inhibitors or cetuximab. BMC Medicine. 2012;10:28. doi: 10.1186/1741-7015-10-28. [DOI] [PMC free article] [PubMed] [Google Scholar]
- 5.Siena S, et al. Biomarkers predicting clinical outcome of epidermal growth factor receptor-targeted therapy in metastatic colorectal cancer. J Natl Cancer Inst. 2009;101(19):1308–1324. doi: 10.1093/jnci/djp280. [DOI] [PMC free article] [PubMed] [Google Scholar]
- 6.Muller S, et al. Distinctive E-cadherin and epidermal growth factor receptor expression in metastatic and nonmetastatic head and neck squamous cell carcinoma – predictive and prognostic correlation. Cancer. 2008;113(1):97–107. doi: 10.1002/cncr.23557. [DOI] [PubMed] [Google Scholar]
- 7.Psyrri A, et al. Effect of epidermal growth factor receptor expression level on survival in patients with epithelial ovarian cancer. Clin Cancer Res. 2005;11(24):8637–8643. doi: 10.1158/1078-0432.CCR-05-1436. [DOI] [PubMed] [Google Scholar]
- 8.Yang XQ, et al. Quantum dot-based quantitative immunofluorescence detection and spectrum analysis of epidermal growth factor receptor in breast cancer tissue arrays. Int J Nanomedicine. 2011;6:2265–2273. doi: 10.2147/IJN.S24161. [DOI] [PMC free article] [PubMed] [Google Scholar]
- 9.Kneipp J, Kneipp H, Kneipp K. SERS – a single-molecule and nanoscale tool for bioanalytics. Chem Soc Rev. 2008;37(5):1052–1060. doi: 10.1039/b708459p. [DOI] [PubMed] [Google Scholar]
- 10.Alvarez-Puebla RA, Liz-Marzan LM. Sers-based diagnosis and biodetection. Small. 2010;6(5):604–610. doi: 10.1002/smll.200901820. [DOI] [PubMed] [Google Scholar]
- 11.Maiti KK, et al. Development of biocompatible SERS nanotag with increased stability by chemisorption of reporter molecule for in vivo cancer detection. Biosen Bioelectron. 2010;26(2):398–403. doi: 10.1016/j.bios.2010.07.123. [DOI] [PubMed] [Google Scholar]
- 12.von Maltzahn G, et al. Sers-coded gold nanorods as a multifunctional platform for densely multiplexed near-infrared imaging and photothermal heating. Adv Mater. 2009;21(31):3175–3180. doi: 10.1002/adma.200803464. [DOI] [PMC free article] [PubMed] [Google Scholar]
- 13.Zavaleta CL, et al. Multiplexed imaging of surface enhanced Raman scattering nanotags in living mice using noninvasive Raman spectroscopy. Proc Natl Acad Sci U S A. 2009;106(32):13511–13516. doi: 10.1073/pnas.0813327106. [DOI] [PMC free article] [PubMed] [Google Scholar]
- 14.Jiang L, et al. Raman reporter-coated gold nanorods and their applications in multimodal optical imaging of cancer cells. Anal Bioanal Chem. 2011;400(9):2793–2800. doi: 10.1007/s00216-011-4894-6. [DOI] [PubMed] [Google Scholar]
- 15.Qian XM, et al. In vivo tumor targeting and spectroscopic detection with surface-enhanced Raman nanoparticle tags. Nat Biotechnol. 2008;26(1):83–90. doi: 10.1038/nbt1377. [DOI] [PubMed] [Google Scholar]
- 16.Kennedy DC, et al. SERS detection and boron delivery to cancer cells using carborane labelled nanoparticles. Chem Commun. 2009;(44):6750–6752. doi: 10.1039/b916561d. [DOI] [PubMed] [Google Scholar]
- 17.Wu P, et al. Aptamer-guided silver–gold bimetallic nanostructures with highly active surface-enhanced raman scattering for specific detection and near-infrared photothermal therapy of human breast cancer cells. Anal Chem. 2012;84(18):7692–7699. doi: 10.1021/ac3015164. [DOI] [PubMed] [Google Scholar]
- 18.Yang J, et al. Distinguishing breast cancer cells using surface-enhanced Raman scattering. Anal Bioanal Chem. 2012;402(3):1093–1100. doi: 10.1007/s00216-011-5577-z. [DOI] [PubMed] [Google Scholar]
- 19.Wang X, et al. Detection of circulating tumor cells in human peripheral blood using surface-enhanced raman scattering nanoparticles. Cancer Res. 2011;71(5):1526–1532. doi: 10.1158/0008-5472.CAN-10-3069. [DOI] [PMC free article] [PubMed] [Google Scholar]
- 20.Eccles SA, Welch DR. Metastasis: recent discoveries and novel treatment strategies. Lancet. 2007;369(9574):1742–1757. doi: 10.1016/S0140-6736(07)60781-8. [DOI] [PMC free article] [PubMed] [Google Scholar]
- 21.Vaidya KS, et al. Breast cancer metastasis suppressor-1 differentially modulates growth factor signaling. J Biol Chem. 2008;283(42):28354–28360. doi: 10.1074/jbc.M710068200. [DOI] [PMC free article] [PubMed] [Google Scholar]
- 22.Samant RS, et al. Breast cancer metastasis suppressor I (BRMSI) inhibits osteopontin transcription by abrogating NF-kappa B activation. Mol Cancer. 2007;6:6. doi: 10.1186/1476-4598-6-6. [DOI] [PMC free article] [PubMed] [Google Scholar]
- 23.DeWald DB, et al. Metastasis suppression by breast cancer metastasis suppressor 1 involves reduction of phosphoinositide signaling in MDA-MB-435 breast carcinoma cells. Cancer Res. 2005;65(3):713–717. [PubMed] [Google Scholar]
- 24.Cicek M, et al. Breast cancer metastasis suppressor 1 inhibits gene expression by targeting nuclear factor-kappa B activity. Cancer Res. 2005;65(9):3586–3595. doi: 10.1158/0008-5472.CAN-04-3139. [DOI] [PubMed] [Google Scholar]
- 25.Bodenstine TM, et al. Homotypic gap junctional communication associated with metastasis suppression increases with PKA activity and is unaffected by PI3K inhibition. Cancer Res. 2010;70(23):10002–10011. doi: 10.1158/0008-5472.CAN-10-2606. [DOI] [PMC free article] [PubMed] [Google Scholar]
- 26.Saunders MM, et al. Breast cancer metastatic potential correlates with a breakdown in homospecific and heterospecific gap junctional intercellular communication. Cancer Res. 2001;61(5):1765–1767. [PubMed] [Google Scholar]
- 27.Hurst DR, Welch DR. Unraveling the enigmatic complexities of BRMS1-mediated metastasis suppression. FEBS Lett. 2011;585(20):3185–3190. doi: 10.1016/j.febslet.2011.07.045. [DOI] [PMC free article] [PubMed] [Google Scholar]
- 28.Tan XB, et al. Polyvinylpyrrolidone- (PVP-) coated silver aggregates for high performance surface-enhanced Raman scattering in living cells. Nanotechnology. 2009;20(4):445102. doi: 10.1088/0957-4484/20/44/445102. [DOI] [PubMed] [Google Scholar]
- 29.Orendorff CJ, et al. Aspect ratio dependence on surface enhanced Raman scattering using silver and gold nanorod substrates. Phys Chem Chem Phys. 2006;8(1):165–170. doi: 10.1039/b512573a. [DOI] [PubMed] [Google Scholar]
- 30.Ding H, et al. Gold nanorods coated with multilayer polyelectrolyte as contrast agents for multimodal imaging. J Phys Chem C. 2007;111(34):12552–12557. [Google Scholar]
- 31.Gole A, Murphy CJ. Polyelectrolyte-coated gold nanorods: synthesis, characterization and immobilization. Chem Mater. 2005;17(6):1325–1330. [Google Scholar]
- 32.Bishnoi SW, et al. All-optical nanoscale pH meter. Nano Lett. 2006;6(8):1687–1692. doi: 10.1021/nl060865w. [DOI] [PubMed] [Google Scholar]
- 33.Michota A, Bukowska J. Surface-enhanced Raman scattering (SERS) of 4-mercaptobenzoic acid on silver and gold substrates. J Raman Spectrosc. 2003;34(1):21–25. [Google Scholar]
- 34.Albrecht MG, Creighton JA. Anomalously intense Raman-spectra of pyridine at a silver electrode. J Am Chem Soc. 1977;99(15):5215–5217. [Google Scholar]
- 35.Jeanmaire DL, Van Duyne RP. Surface Raman spectroelectrochemistry: Part I. Heterocyclic, aromatic, and aliphatic amines adsorbed on the anodized silver electrode. J Electroanal Chem Interfacial Electrochem. 1977;84(1):1–20. [Google Scholar]
- 36.Bantz KC, et al. Recent progress in SERS biosensing. Phys Chem Chem Phys. 2011;13(24):11551–11567. doi: 10.1039/c0cp01841d. [DOI] [PMC free article] [PubMed] [Google Scholar]
- 37.Novy Z, et al. A comparison of in vitro methods for determining the membrane receptor expression in cell lines. Nucl Med Biol. 2012;39(7):893–896. doi: 10.1016/j.nucmedbio.2012.02.007. [DOI] [PubMed] [Google Scholar]
- 38.Linassier C, et al. Mechanisms of action in Nih-3t3Cells of genistein, an inhibitor of EGF receptor tyrosine kinase-activity. Biochem Pharmacol. 1990;39(1):187–193. doi: 10.1016/0006-2952(90)90664-7. [DOI] [PubMed] [Google Scholar]
- 39.Akiyama T, et al. Genistein, a specific inhibitor of tyrosine-specific protein-kinases. J Biol Chem. 1987;262(12):5592–5595. [PubMed] [Google Scholar]
- 40.Merlin J, et al. Galectin-3 regulates MUC1 and EGFR cellular distribution and EGFR downstream pathways in pancreatic cancer cells. Oncogene. 2011;30(22):2514–2525. doi: 10.1038/onc.2010.631. [DOI] [PubMed] [Google Scholar]
- 41.Bitler BG, Goverdhan A, Schroeder JA. MUC1 regulates nuclear localization and function of the epidermal growth factor receptor. J Cell Sci. 2010;123(Pt 10):1716–1723. doi: 10.1242/jcs.062661. [DOI] [PMC free article] [PubMed] [Google Scholar]
- 42.Nel AE, et al. Understanding biophysicochemical interactions at the nano-bio interface. Nature Mater. 2009;8(7):543–557. doi: 10.1038/nmat2442. [DOI] [PubMed] [Google Scholar]
- 43.Lynch I, Dawson KA. Protein-nanoparticle interactions. Nano Today. 2008;3(1–2):40–47. [Google Scholar]
- 44.Mickler FM, et al. Tuning nanoparticle uptake: live-cell imaging reveals two distinct endocytosis mechanisms mediated by natural and artificial EGFR targeting ligand. Nano Lett. 2012;12(7):3417–3423. doi: 10.1021/nl300395q. [DOI] [PubMed] [Google Scholar]
- 45.Huang XH, et al. Cancer cell imaging and photothermal therapy in the near-infrared region by using gold nanorods. J Am Chem Soc. 2006;128(6):2115–2120. doi: 10.1021/ja057254a. [DOI] [PubMed] [Google Scholar]
- 46.Huang XH, et al. Cancer cells assemble and align gold nanorods conjugated to antibodies to produce highly enhanced, sharp, and polarized surface Raman spectra: a potential cancer diagnostic marker. Nano Lett. 2007;7(6):1591–1597. doi: 10.1021/nl070472c. [DOI] [PubMed] [Google Scholar]
Associated Data
This section collects any data citations, data availability statements, or supplementary materials included in this article.


