Abstract
Cystic kidney diseases are a global public health burden, affecting over 12 million people1. Although much is known about the genetics of kidney development and disease, the cellular mechanisms driving normal kidney tubule elongation remain unclear 2,3. Here, we used in vivo imaging to demonstrate for the first time that mediolaterally-oriented cell intercalation is fundamental to vertebrate kidney morphogenesis. Surprisingly, kidney tubule elongation is driven in large part by a myosin-dependent, multi-cellular rosette-based mechanism, previously only described in Drosophila. In contrast to Drosophila, however, non-canonical Wnt/PCP signaling is required to control rosette topology and orientation during vertebrate kidney tubule elongation. These data resolve longstanding questions concerning the role of PCP signaling in the developing kidney and moreover establish rosette-based intercalation as a deeply conserved cellular engine for epithelial morphogenesis.
An outstanding challenge is to understand how the dynamic behavior of individual cells, acting collectively, remodels the developing kidney tubule epithelium and how defects in this process lead to cystogenesis. While recent advances in imaging have begun to elucidate the mechanisms of branching morphogenesis in the kidney 4, a similar understanding of tubule elongation has not emerged. Mechanisms proposed for tubule elongation include convergent extension cell movements 5,6 and oriented cell divisions 7. However, debate continues because tubule elongation is an inherently dynamic process, and prior studies have relied upon static images from fixed tissue 5-7. A related, and unanswered question in both normal kidney morphogenesis and the pathogenesis of kidney cysts concerns the role of the planar cell polarity (PCP) signaling system 5,8. PCP signaling is of particular interest because it has been shown to govern both convergent extension and oriented cell division in a variety of biological contexts 9. In light of these two outstanding problems, we undertook to discern the mechanisms by which PCP signaling controls the dynamic behavior of kidney tubule epithelial cells during vertebrate development.
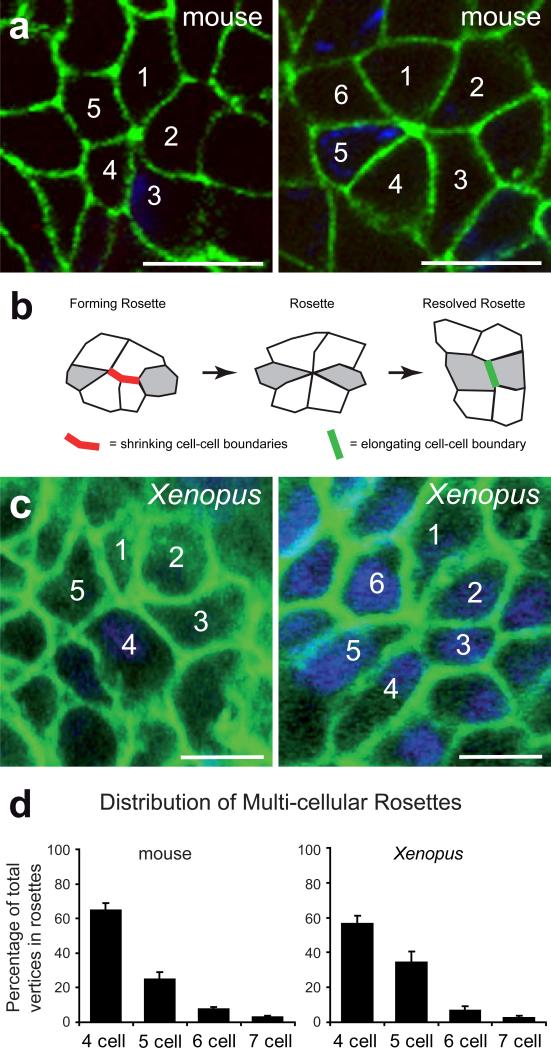
In a previous study, we proposed that PCP-mediated convergent extension drives kidney tubule elongation 5, but the cellular mechanism by which this convergent extension may occur remained unknown. E-cadherin immunostaining of developing mice at E15.5 identified the presence of multi-cellular rosettes in the kidney tubule collecting duct epithelium (Fig. 1a). Such multi-cellular rosettes have been observed previously in vertebrate epithelia, but their function has remained unknown 10,11. By contrast, the function of multi-cellular rosettes has been well defined in the Drosophila germ band epithelium, where such rosettes are essential for the cell rearrangements that drive convergent extension 12. In that tissue, concerted shrinkage of mediolateral cell-cell boundaries leads to the formation of multi-cellular rosettes, which then resolve at a perpendicular angle. Thus, cells are repositioned in such a way as to elongate and narrow the tissue (Fig. 1b) 12.
Figure 1. Multi-cellular rosettes are conserved in mammalian kidney development.
(a) E-cadherin immunostaining (green) of E15.5 mouse kidney collecting ducts demonstrates the presence of multi-cellular rosettes. Scale bar, 10 μm. (b) Diagram of rosette formation and resolution during morphogenesis of Drosophila germ bad extension. (c) Immunostaining of fixed Xenopus tubules at stage 37 (anti-memGFP, green; DAPI blue) also detects rosettes. Scale bar, 10 μm. (d) The quantitative analysis of the fraction of vertices in rosette formation in mouse and Xenopus kidneys shows a similar distribution of rosette composition in both vertebrate species (Xenopus: n=96 rosettes in 7 embroys; mouse: n=263 rosettes in 3 embryos, collecting ducts; error bars: SEM).
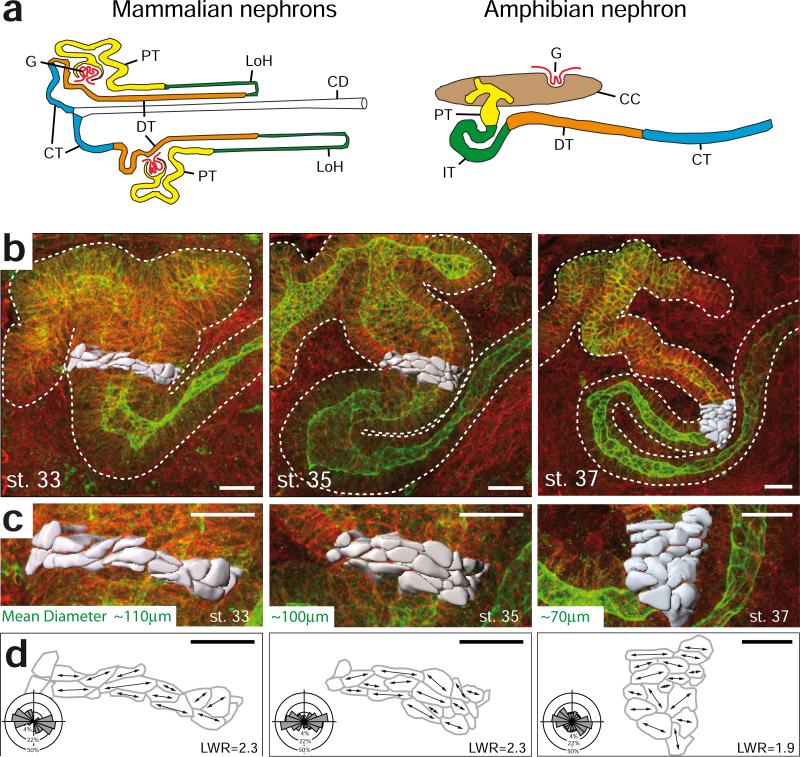
Determining the function multi-cellular rosettes in the kidney tubule epithelium requires dynamic analysis and live imaging of nephron elongation at single-cell resolution. To meet this challenge, we exploited a vertebrate animal model in which the molecular patterning of the embryonic nephron is highly conserved compared to mammals 13,14, and in which the large size of tissues and cells has consistently allowed exceptional access to individual cell behaviors in vivo 15-17. The embryonic kidney of the frog Xenopus consists of only a single, giant nephron (Fig. 2a), and its structural and functional segmentation compares well with mammalian nephrons (Ref. 14 and Supplementary Fig. 1). Moreover, the tissue architecture of Xenopus kidney tubules during elongation reflects that of the mammalian kidney; cells align mediolaterally, and the number of cells spanning the tubular circumference decreases as the tubule elongates (Fig. 2b-d; Supplementary Fig. 2; Supplementary Movie 1). Importantly, multi-cellular rosettes form in the Xenopus kidney tubules, and the number of cells per rosette was similar between Xenopus and mouse (Fig. 1c,d). The parallels in functional segmentation, cellular architecture, and rosette topology suggest that Xenopus will be a useful model for studying the dynamics of kidney tubule elongation.
Figure 2. Elongation of vertebrate kidney tubules by mediolateral cell intercalation.
(a) Diagram depicting the structural similarities between the mammalian and amphibian nephron segments: Glomerulus (G), proximal tubule (PT, yellow), Loop of Henle (LoH, green), distal tubule (DT, orange), connecting tubule (CT, blue), collecting duct (CD, white), intermediate tubule (IT, green), coelomic cavity (CC, brown). The Figure was adapted with permission from 14 . (b) The morphology of the developing renal tubule of Xenopus is visualized by staining for β-catenin (red; cell borders) and tomato-lectin (green; tubule epithelium) (scale bar = 20 μm). 20 cells in the intermediate tubule are volume rendered based on the cell borders using 3D visualization software (gray). (c) Enlarged view of volume-rendered cells as depicted in (b) (scale bar = 20 μm). (d) Depiction of the cell outlines at the basal surface of the tubule. Arrows in the traced cells indicate the longest diameter at the basal side. Rose plots show that the angular distribution is biased towards the medial-lateral axis with a length-to-width ratio (LWR) between 1.9 and 2.3. (top: proximal; bottom: distal) (n=42 cells in 3 to 4 embryos of each stage). The outer circle represents 50%, the middle circle 22% and the inner circle 4% of total observations (scale bar = 20 μm).
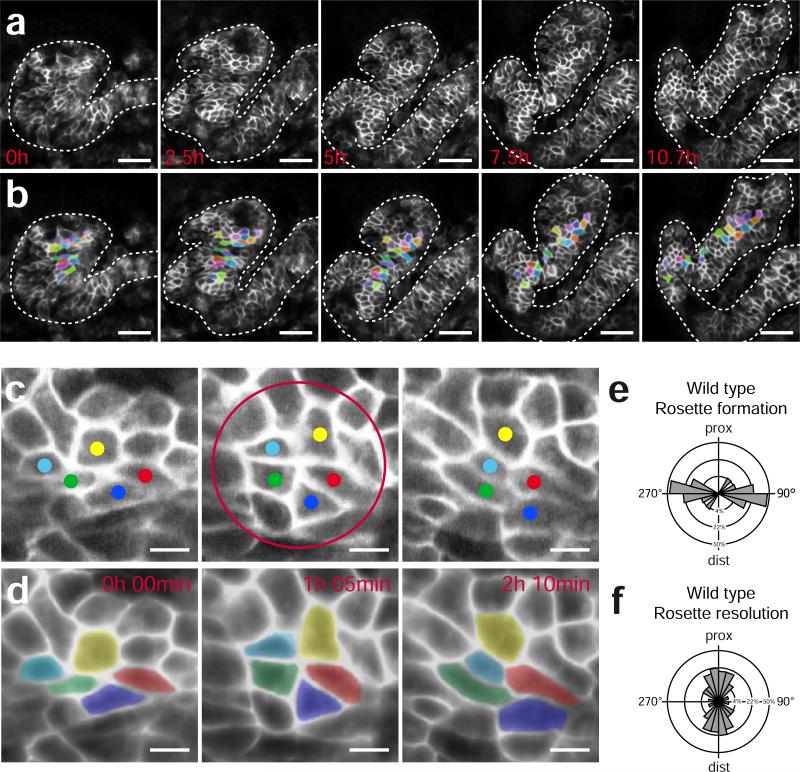
We therefore developed methods for in vivo imaging of kidney tubule elongation in Xenopus by combining targeted expression of a membrane-tethered GFP, confocal microscopy, and custom software for image processing and analysis (see Supplementary Fig. 3 and Supplementary Information). Using this method, individual cells within the nephron could be consistently identified and tracked over long periods of time in vivo (Fig. 3a; Supplementary Movie 2; Supplementary Fig. 4). We observed that cells within the elongating nephron underwent repeated rounds of intercalation (interdigitation) along the axis perpendicular to the elongating tubule. Such mediolateral cell intercalations were most apparent when rows of roughly adjacent cells were marked and followed over time (Fig. 3b, Supplementary Movies 3,4). While suggested by previous work with fixed mammalian tissue 5, these results provide the first direct demonstration that vertebrate kidney tubules elongate by convergent extension and that this convergent extension is driven by planar polarized mediolateral cell intercalation.
Figure 3. Morphogenetic movements of renal tubule cells employs rosette formation.
(a) Time-lapse confocal imaging and tracking of individual tubule cells demonstrate convergent extension movements within the developing kidney tubule of Xenopus laevis (see also Supplementary Movies 2 and 3). Scale bar, 50 μm. (b) Cells were segmented and colored to visualize cell rearrangement over the course of 10.7 hours. (c) Layer extracted still images of a forming and resolving rosette (red circle) from time lapse recordings (top: proximal; bottom distal) (see also Supplementary Movies 2 and 3). Scale bar, 10 μm. (d) Corresponding images, filtered and colored, demonstrating rosette formation and resolution. (e) Rosettes form predominantly in a medial-lateral angle. (f) Resolution is biased towards a proximal-distal angle. Rose plots demonstrate the angular distribution of 33 forming and resolving rosettes in 3 tubules (p<0.01, Mardia-Watson-Wheeler test). The outer circle represents 50%, the middle circle 22% and the inner circle 4% of total observations.
Importantly, our time-lapse data also confirmed that the multi-cellular rosettes observed in fixed tissue are, in fact, dynamic structures (Fig. 3c,d, Supplementary Movie 5). In Drosophila, such dynamic rosettes form and resolve in perpendicular orientation, thus driving the narrowing and elongation of the germ band (Fig. 1b) 12. Consistent with a similar, causal role in morphogenesis of kidney tubules, the angle of rosettes we observed was strongly biased mediolaterally, while the angle of rosette resolution was strongly biased perpendicularly, along the proximodistal axis (Fig. 3e,f). These data provide the first demonstration that multi-cellular rosette formation and resolution is a deeply conserved cellular mechanism associated with epithelial convergent extension in both insects and vertebrates.
In addition to multi-cellular rosettes, elongation of the Drosophila germ band is also driven in part by lower-order (4-cell) polarized junctional remodelling events, termed “type 1 to 3 transitions” 18,19 (Supplementary Fig. 5a). We observed similar 4-cell transitions in elongating kidney tubules, but in contrast to the multi-cellular rosettes, the orientation of these transitions was not polarized at the stages observed (Supplementary Fig. 5b,c). In Drosophila, type 1 to 3 transitions predominate early during germ band elongation, with multi-cellular rosettes predominating at later stages 12; however in vivo imaging at earlier stages of kidney development in Xenopus proved impossible due to the higher tissue opacity. Our data therefore suggest a key role for multi-cellular rosettes at the stages examined, though we cannot rule out a role for type 1 to 3 transitions earlier in development. These results are especially interesting because they suggest that multi-cellular rosette formation and 4-cell transitions are under independent molecular control in the kidney tubules, consistent with recent data from Drosophila 20.
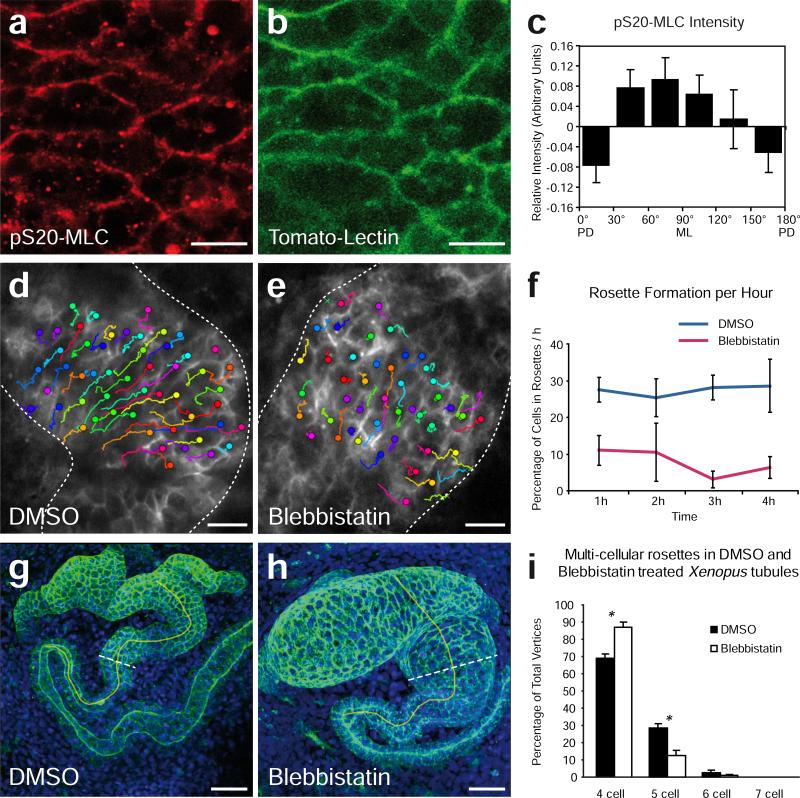
Our time-lapse data identify rosette behaviors in the developing vertebrate kidney that are strikingly similar to those observed in the Drosophila germ band. However, rosettes in Drosophila have been characterized by focusing on the apical surface, while for technical reasons, our imaging approach requires a focus on more basal regions. We therefore sought to perform mechanistic studies in order to advance our comparison of kidney tubule rosette behaviors with those in Drosophila (Fig. 4). Rosette-based intercalation in Drosophila requires the mediolaterally polarized action of non-muscle myosin II 12. Accordingly, immunostaining showed that active (phosphorylated) myosin II was likewise enriched specifically along mediolaterally-oriented cell-cell boundaries in the elongating kidney epithelium in vivo (Fig. 4a-c and Supplementary Fig. 6). Moreover, treatment with blebbistatin 21 dramatically inhibited both the number of multi-cellular rosettes (Fig. 4f and Supplementary Movies 6,7) and the topological complexity of rosettes (Fig. 4i). Importantly, these defects were associated with a failure of nephron morphogenesis (Fig 4g,h). Tubule length in blebbistatin-treated embryos was shorter than in controls, while tubule diameter and the number of cells spanning the tubule circumference were significantly greater, consistent with a defect in convergent extension (Supplementary Fig. 6). Apical-basal epithelium height was not significantly changed (Supplementary Fig. 6e), suggesting a specific role for myosin II in cell rearrangements. Finally, in vivo time-lapse imaging demonstrated that blebbistatin suppressed the mediolateral cell intercalations normally observed in kidney tubules at these stages (Fig. 4d,e, Supplementary Fig. 6f). Together, these data demonstrate that myosin-dependent, rosette-based cell intercalation is an ancient cellular mechanism for convergent extension and that it is employed by the elongating vertebrate nephron.
Figure 4. Inhibition of myosin interferes with cell movement in Xenopus tubule formation.
Immunostaining for (a) S20-phosphorylated myosin light chain (pS20-MLC) and (b) Lycopersicon Esculentum (Tomato) Lectin, which stains the membrane of tubule epithelial cells. Scale bar, 20 μm. (c) Densitometric analysis showed that the strongest signal of activated myosin light chain is detected at medio-laterally (ML) oriented cell junctions. Cell borders were categorized into six groups with angles between 0 and 180 degrees; pS20-MLC intensity was normalized against Tomato Lectin in ten kidney tubules, and depicted as bar graph (PD, posterodistal) (p=0.05, ANOVA, n=312 junctions, error bars: SEM). (d,e) Parallel in vivo time-lapse analysis of DMSO- versus blebbistatin-treated embryos shows the disrupted cell rearrangement during tubule morphogenesis. Colored tracks show the displacement of cells over time (up to three hours). Crosses indicate cells that could not be tracked to the last frame. Scale bar, 20 μm. (f) Quantification of the number of cells participating in newly formed higher order (5 or more cell-) rosettes. Rosette detection was aided by a computerized algorithm on filtered images (see Supplementary Movies 4 and 5). (p<0.001, t-test, n=4 embryos, 721 cells in DMSO , 1341 in blebbistatin treated group analyzed, error bars: SEM). (g,h) Treatment with blebbistatin between stage 33 and 37 (tomato-lectin-FITC, green; DAPI, blue) prevented elongation and narrowing of the renal tubule. Brocken lines indicate the position of the cross sections taken for measurements. The yellow line indicates the anatomical landmarks used for measuring tubule length (the fusion point of the nephrostomes to the anterior bending of the intermediate tubule) Scale bar, 50 μm. (i) The complexity of multi-cellular rosettes was reduced by Blebbistatin treatment in fixed Xenopus tubules (DMSO n=9, Blebbistatin n=10 tubules, * p<0,01, t-test, error bars: SEM)
This deep conservation of a rosette-based mechanism driving convergent extension is quite surprising, and is at odds with the observation that PCP signaling controls kidney tubule elongation 5,8,22, because mutations of core PCP proteins do NOT disrupt rosette-based cell intercalation in Drosophila 23. To initially explore the link between PCP signaling and multi-cellular rosette formation, we examined mice with a conditional deletion of Wnt9b in the kidney tubules. These mice display defects in PCP-mediated kidney tubule convergent extension 5, and strikingly, we found that they also displayed a significant reduction in the topological complexity of multicellular rosettes. In control kidneys, roughly 30% of observed rosettes contained 5 cells, 7% contained 6 cells, and 2% contained 7 cells (Fig. 1d and Supplementary Fig. 7a). Loss of Wnt9b completely eliminated 7-cell rosettes and reduced the numbers of 5-cell and 6-cell rosettes in the mouse kidney tubules; the number of 4-cell vertices increased correspondingly (Supplementary Fig. 7a). Because such reductions in the topological complexity of multi-cellular rosettes consistently correlate with defective tissue elongation in Drosophila 12,20, the similar correlation in mouse kidney tubules suggested a potential link between PCP, multi-cellular rosettes, and convergent extension.
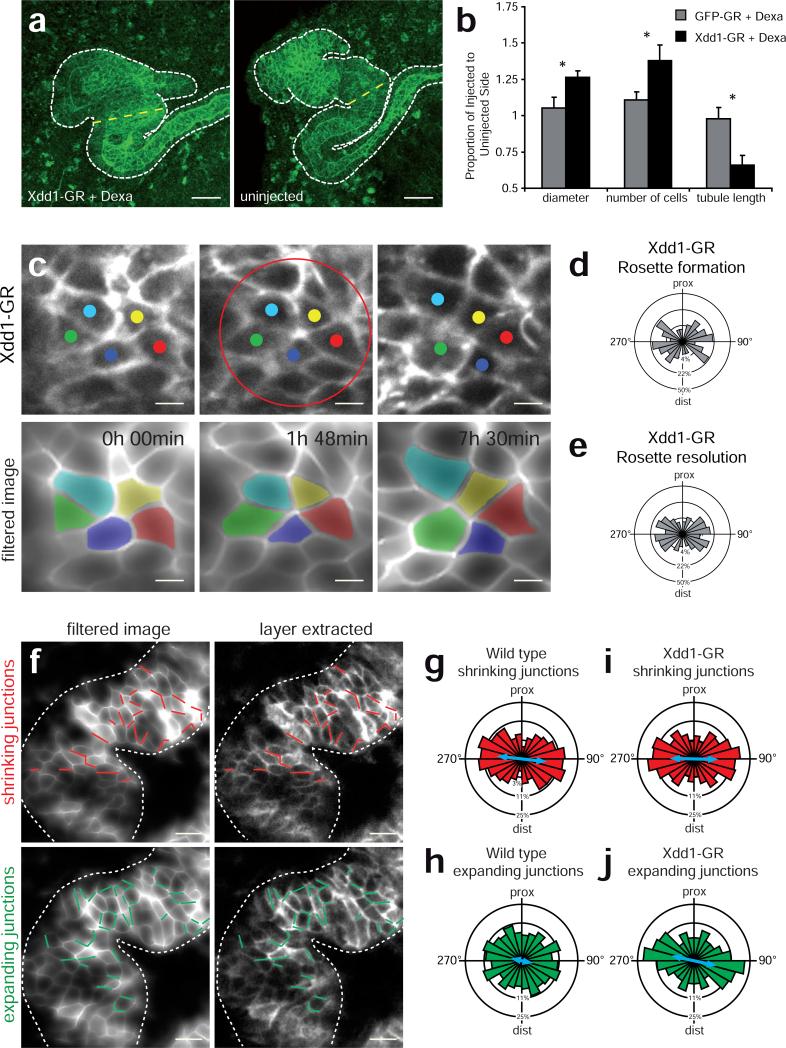
To further explore this hypothesis, we inhibited PCP signaling in the Xenopus kidney specifically during the period of tubule elongation using targeted expression of a hormone-inducible version of Xdd1, a PCP-specific dominant-negative form of Dishevelled-2 (Fig. 5 and Supplementary Fig. 8). This approach elicited a significant reduction in nephron elongation, as well as corresponding increases in tubule diameter and in the number of cells spanning the tubule circumference (Fig. 5a,b), defects that parallel those observed in Wnt9b mutant mice (Supplementary Fig. 9; Ref. 5). Importantly, expression of Xdd1 disrupted rosette topology in Xenopus in a manner mirroring loss of Wnt9b in the mouse (Supplementary Fig. 7a,b).
Figure 5. PCP signaling controls polarized resolution of multi-cellular rosettes in developing vertebrate kidney tubules.
(a) Expression of dexamethasone-inducible Xdd1 (Xdd1-GR) resulted in shorter and wider tubules than on the uninjected control side in Xenopus embryos. The uninjected side is shown as a mirror image. Scale bar, 50 μm. (b) Quantification of tubules shows a significantly larger diameter, an increased number of cells and decreased tubule length in treated embryos. (GFP-GR n=15, Xdd1-GF n=10 embryos; p< 0.05, t-test, error bars: SEM) (c) Time-lapse imaging of tubule cells shows that rosette formation and resolution is disrupted by Xdd1 (top panel) Filtered and colored images of rosette forming and resolving cells (bottom panel, see also Supplementary Movie 8). Top: proximal; bottom: distal; Scale bar, 10 μm. (d) Rose plot of angular distribution of forming and (e) of resolving rosettes. (n= 30 rosettes in 4 tubules). The outer circle represents 50%, the middle circle 22% and the inner circle 4% of total observations. (f) Analysis of junctional remodeling over a 30 min interval in a wild type tubule. Shrinking junctions are depicted in red (top panel). Expanding junctions are marked green (bottom panel). Scale bar, 20 μm. (g) The angular distribution of wild type shrinking junctions is mediolaterally biased. The blue arrow represents the length of the mean vector (r) (n=82 junctions in 3 embryos) (h) The distribution of expanding junctions is significantly less biased (p < 0,05, Mardia-Watson-Wheeler test) (n=96 junctions in 3 embryos). (i) In Xdd1 expressing tubules, shrinking junctions are mediolaterally biased (n=118 junctions in 3 embryos). (j) The distribution of expanding junctions in Xdd1 expressing cells is not random, but biased mediolaterally (n=116 junctions in 3 embryos). The circles represent 25%, 11% and 3% respectively in (g-j).
In light of the similar topology defects following PCP disruption in both animals, we turned again to live imaging in Xenopus to better understand the role of PCP signaling in the dynamic control of multi-cellular rosettes. In vivo imaging of the Xenopus kidney tubules showed that disruption of PCP signaling not only elicited defects in topology, but also disrupted the orientation of multi-cellular rosettes. After expression of Xdd1, the angle of rosette formation was significantly less biased in the mediolateral axis than were controls (Fig. 5d). Far more striking, however, was the observation that resolving rosettes completely failed to orient in the long axis of the tubule (Fig. 5e and Supplementary Movie 8). Indeed, most rosettes resolved in the same mediolateral orientation from which they formed (Fig. 5c).
In Drosophila, rosette formation occurs when a group of cells coordinately shrink their mediolaterally-oriented cell-cell boundaries, while rosette resolution involves coordinate elongation of proximodistally-oriented boundaries (Fig. 1a) 12. We therefore assessed the effect of PCP disruption on the orientation of shrinking and elongating cell-cell boundaries in the developing kidney tubule epithelium. In the nephron, as in Drosophila germ band epithelium 18,19, shrinking cell-cell boundaries were strongly oriented in the mediolateral axis (Fig. 5f,g), while expanding junctions were more randomly distributed, with many boundaries expanding proximodistally (Fig. 5f,h). Importantly, we found that Xdd1 expression did not significantly impact the orientation of shrinking boundaries but strongly suppressed any proximodistally-oriented boundary elongation (Fig. 5i,j).
In sum, the data here provide for the first time a dynamic demonstration of the cellular basis of vertebrate kidney tubule elongation. These results are significant for establishing the multi-cellular rosette mechanism for cell intercalation as a deeply conserved cellular engine for epithelial morphogenesis. Moreover, our data also show for the first time that, in vertebrates, this morphogenetic engine is under the control of an equally ancient molecular polarizing system, the PCP network. We find that in the kidney tubule epithelium, PCP proteins control both the topology of rosettes and also the ability of rosettes to resolve in an orientation perpendicular to their formation. These phenotypes suggest a role for PCP signaling in governing the action of myosin II, because we find that myosin II is essential for rosette formation in the kidney, as it is in the Drosophila epithelium. Indeed, PCP signaling has been previously linked to myosin II activation in Drosophila and C. elegans 24,25.
Finally, by demonstrating directly that vertebrate kidney tubules elongate by convergent-extension cell movements, our live imaging studies resolve an important and outstanding question in kidney morphogenesis. Our data strongly suggest that similar mechanisms act to drive kidney tubule elongation in Xenopus and mouse, and thus can explain the elongation of kidney tubules during prenatal stages when the orientation of cell divisions is not aligned 5. Thus, defects in rosette-based intercalation suggest a likely etiology for congenital kidney cyst formation associated with defective PCP. Finally, increased cell intercalations have been proposed to restore normal tubule diameter in mouse models with cysts arising from defective oriented cell division 6. As such, our new insights into the cellular basis of intercalation shed new light on a mechanism that could potentially be manipulated for therapeutic purposes.
ONLINE METHODS
Xenopus laevis culture and microinjections
Oocytes obtained from hormone induced Xenopus laevis females were fertilized in vitro. Embryos were cultured in 0.3x Marc's modified Ringer (MMR). Injections of mRNA were performed into blastomers C2 and C3 at the 8 to 32-cell stage. The inducible Xdd1 construct (Xdd1-GFP-GR) was cloned by inserting Xdd1 into a modified pCS2+MT-GR vector (a gift from Eric J. Bellefroid, Bruxels, Belgium), and by replacing the myc tag with GFP. To induce Xdd1 activation, embryos were cultured in 10μM dexamethasone in 0.2% ethanol in 0.3X MMR from stage 33 to 37. Plasmids were linearized with Not I; mRNA was in vitro transcribed using the SP6 mMessage mMachine® Kit (Ambion). The institutional animal committee and the local authorities (Regierungspräsidium Baden-Württemberg, Germany) approved all experiments.
Immunostaining and analysis
Xenopus Embryos were fixed at indicated stages in MEMFA and stained for anti β-Catenin (Santa Cruz, sc-7199), anti phospho-Histone H3 (Santa Cruz, sc-8656-R), anti-phospho S20 Myosin light chain (Abcam, ab2480), anti-rabbit conjugated to Alexa Fluor® 488 (Invitrogen), and anti-mouse conjugated to CY3 (Jackson ImmunoResearch) and fluorescein coupled Lycopersicon esculentum lectin (Vector Laboratories). For nuclear stain 4',6-diamidino-2-phenylindole (DAPI) was used. After dehydration in methanol embryos were cleared in Murray's clear (2 parts benzyl benzoate and 1 part benzyl alcohol) and imaged on an inverted Zeiss 5 LIVE DuoScan microscope using a 40x oil immersion objective. 3D reconstruction, cell rendering and optical cross sectioning were performed in Imaris Version 7.1 (Bitplane). Mice kidney tubules were processed and stained as described 5. The anti-E-cadherin (Rat, 1:500 Zymed) antibody was used to label cell membranes.
Time-lapse confocal imaging and image analysis
Embryos were treated with 0.0003% 1-Phenyl-2-thiourea (PTU) after hatching to inhibit pigment formation. Stage 35/36 embryos were incubated in 0.3X MMR containing 0.0003% PTU and 0.01% ethyl 3-aminobenzoate, methanesulfonic acid salt (MS-222) for time-lapse analysis. Embryos were kept in 2x9 well μ-Slides (ibidi) and confocal imaging was performed on an inverted Zeiss LSM 4 microscope equipped with a movable table and a 25x glycerol immersion objective (NA 0.8). The multi-time macro 26 and a customized macro for tracing moving objects were employed to correct for growth, sudden movement and for parallel recording of multiple embryos. For blebbistatin treatment, cells were labeled with memRFP to avoid cytotoxicity 27. DMSO 2% or 200μM blebbistatin in 2% DMSO was added 30 min prior to recording in 2 chamber slides (ibidi) for parallel imaging. Confocal stacks were acquired at 3 to 5 minute intervals. Huygens Professional (Scientific Volume Imaging) and Imaris (Bitplane) were used for image analysis in addition to customized algorithms.
A detailed description of the computer assisted image processing and analysis is provided in a Supplementary Note. Rosettes were defined as a configuration of at least 5 cells that share a vertex at a maximum length of 3 μm. A customized algorithm (see Supplementary Note) aided the semi-automated rosette detection. Participating cells were labeled and were followed forward and backwards to detect changes in the relative positioning of cells. The angle of the most distant cells was defined as formation and resolution angle and measured with ImageJ on snapshot images. For measurement of angles and length-width ratios ImageJ ((http://rsbweb.nih.gov/ij/) was used.
Statistical analysis
Statistical analysis was performed using SigmaStat (Systat Software). Circular statistics and rose plots were generated in Oriana 2.0 (Kovach Computing Service). The frequency of observations in rose plots is represented as the area of each wedge. The concentric circles correspond to the observed frequencies. The Mardia-Watson-Wheeler test determines the probability that two samples are from the same population of angular measurements. It was used to determine a difference between circular distributions with a significance level of smaller than 0.05. All experiments were repeated at least three times.
Supplementary Material
ACKNOWLEDGMENTS
We would like to thank A. Ewald for critical comments on the manuscript; A. Ley for excellent technical assistance, the Life Imaging Center (LIC) at the Centre of Systems Biology of the University Freiburg for the use of confocal microscopes technical support and in particular Shoajun Jin form the LIC for programming the tracking macro used in acquisition of some time lapse analysis; Margret Keuper for digital image analysis; Eric J. Bellefroid for providing the MT-GR plasmid. S.L. is supported by the DFG KFO 201. TJC is supported by grants from the March of Dimes, the US National Institutes of Health (1R01DK080004) and the UT Southwestern O'Brien Kidney Research Foundation (NIH P30DK079328). OR, KL and GW are supported by the Excellence Initiative of the German Federal and State Governments (EXC 294 - BIOSS). J.B.W is supported by the NIH/NIGMS, The March of Dimes, The Burroughs Wellcome Fund, and the UT Southwestern O'Brien Kidney Research Center (NIH P30DK079328). J.B.W. is an Early Career Scientist of the Howard Hughes Medical Institute. G.W. is supported by the DFG KFO 201, and by the European Community's Seventh Framework Program (grant agreement number 241955, SYSCILIA).
Footnotes
AUTHOR CONTRIBUTIONS
S.S.L., C.M.K, T.J.C, J.B.W. and G.W. designed the experiments, S.S.L., K.L, C.M.K and O.R. performed experiments, S.S.L., K.L., C.M.K, T.J.C, O.R., J.B.W. and G.W. analyzed the data and wrote the paper.
References
- 1.Torres VE, Harris PC, Pirson Y. Autosomal dominant polycystic kidney disease. Lancet. 2007;369:1287–301. doi: 10.1016/S0140-6736(07)60601-1. [DOI] [PubMed] [Google Scholar]
- 2.McNeill H. Planar cell polarity and the kidney. J Am Soc Nephrol. 2009;20:2104–11. doi: 10.1681/ASN.2008111173. [DOI] [PubMed] [Google Scholar]
- 3.Chapin HC, Caplan MJ. The cell biology of polycystic kidney disease. J Cell Biol. 2010;191:701–10. doi: 10.1083/jcb.201006173. [DOI] [PMC free article] [PubMed] [Google Scholar]
- 4.Costantini F. Renal branching morphogenesis: concepts, questions, and recent advances. Differentiation. 2006;74:402–21. doi: 10.1111/j.1432-0436.2006.00106.x. [DOI] [PubMed] [Google Scholar]
- 5.Karner CM, et al. Wnt9b signaling regulates planar cell polarity and kidney tubule morphogenesis. Nat Genet. 2009;41:793–9. doi: 10.1038/ng.400. [DOI] [PMC free article] [PubMed] [Google Scholar]
- 6.Nishio S, et al. Loss of oriented cell division does not initiate cyst formation. J Am Soc Nephrol. 2010;21:295–302. doi: 10.1681/ASN.2009060603. [DOI] [PMC free article] [PubMed] [Google Scholar]
- 7.Fischer E, et al. Defective planar cell polarity in polycystic kidney disease. Nat Genet. 2006;38:21–3. doi: 10.1038/ng1701. [DOI] [PubMed] [Google Scholar]
- 8.Saburi S, et al. Loss of Fat4 disrupts PCP signaling and oriented cell division and leads to cystic kidney disease. Nat Genet. 2008;40:1010–5. doi: 10.1038/ng.179. [DOI] [PubMed] [Google Scholar]
- 9.Goodrich LV, Strutt D. Principles of planar polarity in animal development. Development. 2011;138:1877–92. doi: 10.1242/dev.054080. [DOI] [PMC free article] [PubMed] [Google Scholar]
- 10.Nishimura T, Takeichi M. Shroom3-mediated recruitment of Rho kinases to the apical cell junctions regulates epithelial and neuroepithelial planar remodeling. Development. 2008;135:1493–502. doi: 10.1242/dev.019646. [DOI] [PubMed] [Google Scholar]
- 11.Wagstaff LJ, Bellett G, Mogensen MM, Munsterberg A. Multicellular rosette formation during cell ingression in the avian primitive streak. Dev Dyn. 2008;237:91–6. doi: 10.1002/dvdy.21390. [DOI] [PubMed] [Google Scholar]
- 12.Blankenship JT, Backovic ST, Sanny JS, Weitz O, Zallen JA. Multicellular rosette formation links planar cell polarity to tissue morphogenesis. Dev Cell. 2006;11:459–70. doi: 10.1016/j.devcel.2006.09.007. [DOI] [PubMed] [Google Scholar]
- 13.Jones EA. Xenopus: a prince among models for pronephric kidney development. J Am Soc Nephrol. 2005;16:313–21. doi: 10.1681/ASN.2004070617. [DOI] [PubMed] [Google Scholar]
- 14.Raciti D, et al. Organization of the pronephric kidney revealed by large-scale gene expression mapping. Genome Biol. 2008;9:R84. doi: 10.1186/gb-2008-9-5-r84. [DOI] [PMC free article] [PubMed] [Google Scholar]
- 15.Wallingford JB, et al. Dishevelled controls cell polarity during Xenopus gastrulation. Nature. 2000;405:81–5. doi: 10.1038/35011077. [DOI] [PubMed] [Google Scholar]
- 16.Kieserman EK, Glotzer M, Wallingford JB. Developmental regulation of central spindle assembly and cytokinesis during vertebrate embryogenesis. Curr Biol. 2008;18:116–23. doi: 10.1016/j.cub.2007.12.028. [DOI] [PubMed] [Google Scholar]
- 17.Kim SK, et al. Planar cell polarity acts through septins to control collective cell movement and ciliogenesis. Science. 2010;329:1337–40. doi: 10.1126/science.1191184. [DOI] [PMC free article] [PubMed] [Google Scholar]
- 18.Bertet C, Sulak L, Lecuit T. Myosin-dependent junction remodelling controls planar cell intercalation and axis elongation. Nature. 2004;429:667–71. doi: 10.1038/nature02590. [DOI] [PubMed] [Google Scholar]
- 19.Rauzi M, Lenne PF, Lecuit T. Planar polarized actomyosin contractile flows control epithelial junction remodelling. Nature. 2010;468:1110–4. doi: 10.1038/nature09566. [DOI] [PubMed] [Google Scholar]
- 20.Tamada M, Farrell DL, Zallen JA. Abl regulates planar polarized junctional dynamics through beta-catenin tyrosine phosphorylation. Dev Cell. 2012;22:309–19. doi: 10.1016/j.devcel.2011.12.025. [DOI] [PMC free article] [PubMed] [Google Scholar]
- 21.Straight AF, et al. Dissecting temporal and spatial control of cytokinesis with a myosin II Inhibitor. Science. 2003;299:1743–7. doi: 10.1126/science.1081412. [DOI] [PubMed] [Google Scholar]
- 22.Lienkamp S, et al. Inversin relays Frizzled-8 signals to promote proximal pronephros development. Proc Natl Acad Sci U S A. 2010;107:20388–93. doi: 10.1073/pnas.1013070107. [DOI] [PMC free article] [PubMed] [Google Scholar]
- 23.Zallen JA, Wieschaus E. Patterned gene expression directs bipolar planar polarity in Drosophila. Dev Cell. 2004;6:343–55. doi: 10.1016/s1534-5807(04)00060-7. [DOI] [PubMed] [Google Scholar]
- 24.Winter CG, et al. Drosophila Rho-associated kinase (Drok) links Frizzled-mediated planar cell polarity signaling to the actin cytoskeleton. Cell. 2001;105:81–91. doi: 10.1016/s0092-8674(01)00298-7. [DOI] [PubMed] [Google Scholar]
- 25.Lee JY, et al. Wnt/Frizzled signaling controls C. elegans gastrulation by activating actomyosin contractility. Curr Biol. 2006;16:1986–97. doi: 10.1016/j.cub.2006.08.090. [DOI] [PMC free article] [PubMed] [Google Scholar]
- 26.Rabut G, Ellenberg J. Automatic real-time three-dimensional cell tracking by fluorescence microscopy. Journal of microscopy. 2004;216:131–7. doi: 10.1111/j.0022-2720.2004.01404.x. [DOI] [PubMed] [Google Scholar]
- 27.Kolega J. Phototoxicity and photoinactivation of blebbistatin in UV and visible light. Biochemical and biophysical research communications. 2004;320:1020–5. doi: 10.1016/j.bbrc.2004.06.045. [DOI] [PubMed] [Google Scholar]
Associated Data
This section collects any data citations, data availability statements, or supplementary materials included in this article.


