Abstract
Background
Chromosome 17 abnormalities (C17 abns) are associated with poor outcome in leukemias including acute myeloid leukemia (AML). Recently, Monosomal karyotype (MK) was introduced as independent predictor of dismal outcome in AML. The additional prognostic impact of C-17 abns in patients with MK in a complex karyotype (CK) background is not clear.
Patients and Method
We conducted a retrospective analysis of 1086 patients with newly diagnosed AML treated between January 1998 and December 2007. Patients received treatment with one of the institution's frontline protocols.
Results
Four hundred eighty-three patients had CK. Among them, 370 patients (77%) had MK (CK-MK), and 195 patients (53%) had both MK and C 17 abns (CK-MK-C17 abns). Patients with CK-MK had significantly shorter overall survival (OS) rates compared to patients with CK without MK (4.4 m vs 8 m, respectively, P = 0.002). The median OS for patients with CK-C17 abns was shorter than patients without C17 abns (4 m vs 6.1m, respectively, P = 0.004). In a multivariate analysis, presence of MK among patients with CK was identified as an independent prognostic marker for OS. In addition, presence of C17 abns had significant negative impact on OS among patients with CK-MK (P = 0.04).
Conclusion
Among patients with CK-AML, MK was associated with poor outcomes. Additional presence of C17 abns further worsens the outcome in these particularly poor-risk patients with AML.
Keywords: chromosome 17, monosomal karyotype, complex cytogenetics, AML
Introduction
Acute myeloid leukemia (AML) is a heterogeneous hematopoietic stem cell disorder characterized by acquired genetic mutations; approximately 55% of adults with AML have an abnormal karyotype1. Chromosomal Karyotype remains the most important prognostic factor for predicting outcome and response to therapy in AML2-5.
AML patients with a complex karyotype (CK-AML) are generally considered an unfavorable subgroup in terms of overall outcome and response to chemotherapy (2). The optimal definition of CK-AML remains controversial; some groups define it as the presence of 3 or more abnormalities and others define it as at least 5 unrelated cytogenetic abnormalities3,4; however, the prognostic difference between 3, 4, and 5 cytogenetic abnormalities remains unresolved with some reports indicating that more chromosomal abnormalities lead to shorter overall survival (OS) and fewer responses to induction chemotherapy1,4.
Recently, the monosomal karyotype (MK), defined by the presence of at least 1 autosomal monosomy (AM, excluding isolated loss of a sex chromosome) and 1 structural chromosomal abnormality or at least 2 autosomal monosomies (in the absence of acute promyelocytic leukemia and core-binding factor AML), has been reported to be associated with dismal outcome in patients with AML (4-year OS rate 4-5%)5-8.
The presence of chromosome 17 abnormalities (C17 abns) is associated with poor outcome and resistance to chemotherapy in multiple hematologic malignancies, including AML1,9-13. The frequency of C17 abns in AML varies between 5-8% among patients with de novo AML and is close to 40% among patients with therapy-related AML14. Loss of function of tumor suppressor TP53 through deletion/mutation is thought to be the paramount reason for poor outcome among patients with C17 abns. Patients with chromosome 17p- abnormalities usually have loss of one allele of TP53 and mutation/loss of the other, alterations that are also commonly seen in patients with CK-AML12,13,15-18. Additionally, some patients with AML and other hematologic malignancies with trisomy 17 also express alterations in TP53 pathway19,20. On the other hand, TP53 is usually not mutated in patients with isochromosome 17q but outcome in these patients remains poor21, suggesting that the adverse impact of C17 abns may not be all related to TP53 loss/mutation.
Furthermore, C17 abns are most often associated with CK-AML13; but whether it is independently prognostic within the group of patients with CK-AML is unclear. Several studies have shown that Chromosome 17p is an independent risk factor even in patients who received stem cell transplant (SCT)for AML22,23. In a large retrospective analysis of AML patients with 17p deletion who received SCT in their first or second remission, the 3-year OS was 11% among patients who received SCT versus 6% among patient who treated with chemotherapy thus highlighting the fact that SCT does not substantially improve outcome in this poor-risk population23. On the other hand, Breems et al have shown that the adverse prognostic impact of MK is independent of abn(17p) and −5/del(5q)24. Furthermore, Allogeneic SCT has a positive effect on the survival probabilities of patients with AML-MK and is regarded as the preferred treatment option for these patients24.
Most patients with MK also have CK7 but within CK-AML, MK carries independent adverse prognosis. It is possible that the poor outcome associated with MK is derived mainly or at least in part from the poor prognostic impact of a limited set of autosomal abnormalities (such as del 5/del 5q, del 7/del 7q, or C17 abns) that are known to be associated with poor prognosis in patients with AML. In a large study of 1344 AML patients included on Southwest Oncology Group protocols, MK was found in 176 (13%) patients. Ninety-eight percent of MK cases were within the unfavorable cytogenetic risk category. Interestingly, all patients with chromosome 17p deletion were in the MK group and had very poor outcome (0% OS at 4 years)25.
In this study, we analyzed the clinical and prognostic impact of C17 abns including -17/-17p abnormalities and trisomy 17/add 17q on the outcome of AML patients with CK with or without MK.
Materials and Methods
Patients
A total of 1086 patients with newly diagnosed AML who presented to The University of Texas-MD Anderson Cancer Center between January 1998 and December 2007 were included. If they were eligible, the patients were offered treatment with one of the institution's frontline protocols, primarily based on age and performance status. This analysis includes all patients whose diagnosis conforms to the diagnosis of AML based on the 2008 World Health Organization criteria26. All induction studies that the patients participated in and included in this analysis were approved by the Institutional Review Board, and all patients provided written informed consent in accordance with the Declaration of Helsinki. Even though this review is retrospective, the data was collected prospectively as part of the Department of Leukemia database.
Definitions
CK was defined as the presence of at least 3 unrelated cytogenetic abnormalities9. MK was defined as 2 or more distinct monosomies or a single monosomy in the presence of other structural abnormalities as described previously5. C17 abns included monosomy 17 (53%), del 17 p (17%), add 17q (15%), trisomy 17 (3%) and t(?,17) (12%)[except, t(15,17)].
Complete remission (CR), complete remission with incomplete platelet recovery (CRp), complete remission with incomplete hematologic recovery (CRi), and relapse were based on the International Working Group criteria27. OS was calculated form the time of diagnosis to the time of death or last follow up. Event free survival (EFS) was measured from the time of diagnosis to the date of induction treatment failure, or relapse from remission or death from any cause; patients not known to have any of these events were censored on the last follow up date.
AML therapy
The frontline induction chemotherapy regimens used are shown in Table 1. In general, patients under the age of 60 years were treated with the high-dose cytarabine (HDAC) regimen (cytarabine dose 3- 10 g/m2) that was frontline at time of patient enrollment while patients above the age of 60 years were mainly treated with non-HDAC regimen. Three hundred forty patients (70%) received a treatment with HDAC based regimens combined with either anthracycline or nonanthracycline chemotherapy (including fludarabine, clofarabine, topotecan, and/or troxacitabine) Table 1.
Table 1. Induction treatment regimens.
| Treatment regimen | No. of patients (%) 483 |
|---|---|
| High dose cytarabine based regimens | 340 (70) |
| Idarubicin/cytarabine | 151 (44) |
| Daunorubicin/cytarabine | 26 (9) |
| Cyclophosphamide/cytarabine/topotecan | 45 (13) |
| Fludarabine/cytarabine +/- idarubicin | 45 (13) |
| Clofarabine/cytarabine | 16 (5) |
| Topotecan/cytarabine | 14 (4) |
| Miscellaneous high dose cytarabine based regimens | 43 (12) |
| Other regimens | 143 (30) |
| Hypomethelating agents +/- other drugs | 44 (31) |
| Clofarabine based regimens | 35 (24) |
| Gemtuzumab ozogamicin + interleukin 11 | 21 (15) |
| Miscellaneous | 43 (30) |
Cytogenetic analysis
Conventional cytogenetic analyses were performed on bone marrow samples obtained at diagnosis by culturing bone marrow cells for 24-48 hours using standard techniques. An abnormality was considered clonal when at least 2 metaphases had the same abnormalities, in accordance with the International System of Human Cytogenetic Nomenclature (ISCN 2005)28.
Statistical analysis
Differences among groups were analyzed by using the Fisher's exact test for categorical variables and the Mann-Whitney U test for continuous variables. OS and EFS were analyzed by using the Kaplan-Meier method, and survival curves were compared using the log-rank test. Univariate and multivariate Cox proportional hazards regression analysis was used to model the relationship between potential prognostic factors and survival (OS and EFS). Confidence interval (CI) estimation for the survival curves was based on the cumulative hazard function, using the Greenwood formula for standard error estimation. All 2-sided P values less than 0.05 were considered statistically significant. All statistical analyses were performed using STATA/SE version 12.1 statistical software (Stata Corp. LP, College Station, TX).
Results
Patient characteristics
A total of 483 (44%) patients had CK-AML and were the focus of this analysis. Among them, 370 patients (77%) had MK (CK-MK), and 195 patients (53%) had both MK and C17 abns (CK-MK-C17 abns) [only 7 (2%) patients had CK and C17 abns without MK]. The clinical characteristics at presentation and response to induction chemotherapy for patients with CK are summarized in Table 2. The median age of this group was 64 years (range, 13-86). The overall response rate to induction chemotherapy was 40%. Among the 340 patients (70%) who received induction chemotherapy with HDAC based regimens, 152 (44%) responded (achieved CR, CRp, or CRi) compared to only 26% response rate among patients who did not receive HDAC based regimens (P < 0.002), Table 2. Interestingly, patients ≤ 60 years old had a higher response rate to HDAC based regimens compared to patients > 60 years (50% versus 32%, P < 0.001).
Table 2. Clinical characteristics at presentation in patients with complex karyotype (CK) and those with CK and monosomal karyotype (CK-MK).
| Characteristic | All patients no. (%) |
Presence of MK | no. of monosomies* | ||||
|---|---|---|---|---|---|---|---|
|
| |||||||
| CK-MK no. (%) |
CK-No-MK no. (%) |
P value | MK-1 no. (%) |
MK ≥2 no. (%) |
P value | ||
| Total | 483 | 370 (77) | 113 (23) | 82 (22) | 288 (78) | ||
| Median age, years (range) | 64 (18-86) | 64 (18-86) | 65 (18-84) | 0.71 | 61.5 (18-85) | 65 (20-86) | 0.048 |
| Sex | 0.78 | 0.34 | |||||
| Male | 204 (42) | 155 (42) | 49 (43) | 40 (49) | 115 (40) | ||
| Female | 279 (58) | 215 (58) | 64 (57) | 42 (51) | 173 (60) | ||
| Median white blood cell count × 109/L (range) | 3.6 (0.3-162.5) | 3.2 (0.3-162.5) | 5.1 (0.7-133.1) | 0.008 | 3.4 (0.8-162.5) | 3.1 (0.31-22.2) | 0.089 |
| Median hemoglobin level g/dL (range) | 7.9 (2-15) | 7.9 (2-15) | 8 (3-12.1) | 0.20 | 8.1 (2-15) | 7.8 (2.5-14.2) | 0.075 |
| Median platelet count ×103/μL (range) | 42 (4-597) | 40 (4-597) | 53 (6-463) | 0.027 | 44.5 (4-597) | 39 (4-395) | 0.14 |
| Median peripheral blood blast percentage (range) | 33 (0-97) | 31 (0-97) | 45 (7-95) | <0.001 | 35 (1-92%) | 30 (0-97) | 0.179 |
| Response to induction chemotherapy† | 191 (40) | 134 (37) | 54 (48) | 0.04 | 28 (34) | 106 (37) | 0.17 |
| Treatment with HDACˆ based regimens | 0.99 | 0.53 | |||||
| Yes | 340 (70) | 228 (62) | 70 (62) | 59 (72) | 207 (72) | ||
| No | 143 (30) | 142 (38) | 43 (38) | 23 (28) | 81 (28) | ||
| Response to treatment with HDACˆ based regimens | 152 (44) | 107 (47) | 45 (64) | 0.002 | 24 (41) | 82 (40) | 0.51 |
| Response to treatment with other regimens | 37 (26) | 28 (20) | 9 (21) | 0.165 | 4 (17) | 24 (30) | 0.265 |
MK-1: CK-MK patients with 1 autosomal monosomy; MK ≥2: CK-MK patients with 2 or more autosomal monosomies.
Complete remission, complete remission with incomplete platelet recovery, or complete remission with incomplete hematologic recovery.
HDAC: high dose cytarabine.
Patients with CK-MK versus CK-No-MK
A total of 370 patients had CK-MK and 113 patients had CK without MK (CK-No-MK). Both groups were of comparable age (median age 64 vs 65 years; P = 0.71). CK-MK patients had lower white blood cell count (P = 0.008), lower platelets count (P = 0.02) and lower bone marrow blasts (P <0.001) at presentation, Table 2. The overall response rate to induction chemotherapy was higher among patients with CK-No-MK compared to CK-MK patients (48% vs 34%, respectively, P = 0.04). Furthermore, the response rate for induction chemotherapy with HDAC based regimens was higher in CK-No-MK group compared to CK-MK (64% vs 47 %, respectively, P = 0.002), Table 2. In addition, CK-MK patients who were treated with HDAC based regimes achieved higher response rate compared to patients treated with other regimens (47% vs 20%, respectively, P <0.001). In addition, patients with CK-MK who treated with hypomethylating based regimens achieved similar response rate compared to CK-No-MK (48% vs 45%, respectively).
Eighty-two of the CK-MK patients (22%) had 1 AM (MK-1) and 288 (78%) had 2 AM (MK ≥ 2). The number of AMs was not related to the clinical characteristics at presentation and did not affect the response to induction chemotherapy among CK-MK patients except for age, patients with 1AM were younger (P = 0.048), Table 2.
Patients with CK-C17 abns versus CK-No C17 abns
A total of 202 patients had CK-C17abns and 281 had CK without C17 abns. Patients with CK-C17 abns had lower hemoglobin levels at presentation than patients with CK-No-C17abns (P = 0.03); however, the median white blood cell counts (P = 0.58), platelet counts (P = 0.12), and peripheral blast percentages (P = 0.62) were all similar between the two groups, Table 3. The overall response rate to induction chemotherapy with HDAC based regimens and other regimens was also similar between both groups Table 3.
Table 3. Patient characteristics at presentation in patients with complex karyotype (CK) and monosomal karyotype (MK) (CK-MK), with or without chromosome 17 abnormalities (C17 abns).
| Characteristic | CK only | CK- MK | ||||
|---|---|---|---|---|---|---|
|
| ||||||
| CK-C17 abns, no. (%) | CK-No-C17 abns no. (%) | P value | CK-MK-C17 abns, no. (%) | CK-MK-No-C17 abns, no. (%) | P value | |
| Total | 202 (42) | 281 (58) | 195 (53) | 175 (47) | ||
| Median age, years (range) | 64 (21-85) | 64 (13-86) | 0.72 | 64 (21-85) | 64 (13-86) | 0.77 |
| Sex | 0.32 | 0.59 | ||||
| Male | 80 (40) | 124 (44) | 77 (40) | 78 (45) | ||
| Female | 122 (60) | 157 (56) | 118 (60) | 97 (55) | ||
| Median white blood cell count ×109/L, (range) | 3.3 (0.4-142.8) | 3.8 (0.3-162.5) | 0.58 | 3.3 (0.4-142.8) | 3 (0.3-162.5) | 0.31 |
| Median hemoglobin level g/dL (range) | 7.8 (3.7-12.5) | 8.2 (2-15) | 0.03 | 7.8 (3.7-12.5) | 8 (2-15) | 0.06 |
| Median platelet count ×103/μL (range) | 40 (4-395) | 46 (4-597) | 0.12 | 39 (4-395) | 42 (4-597) | 0.54 |
| Median peripheral blood blast percentage (range) | 32 (1-97) | 33 (0-95) | 0.62 | 32 (1-97) | 30 (0-92) | 0.05 |
| Response to induction chemotherapy* | 75 (37) | 113 (40) | 0.57 | 73 (37) | 61 (35) | 0.15 |
| Treatment with high-dose cytarabine-based regimens | 0.03 | |||||
| Yes | 155 (77) | 185 (69) | 150 (77) | 116 (66) | 0.04 | |
| No | 47 (23) | 96 (31) | 45 (23) | 59 (34) | ||
| Response to treatment with HDACˆ based regimens | 62 (40) | 91 (49) | 0.17 | 61 (40) | 46 (40) | 0.09 |
| Response to treatment with other regimens | 14 (30) | 23 (24) | 0.35 | 13 (29) | 15 (25) | 0.47 |
Complete remission, complete remission with incomplete platelet recovery, or complete remission with incomplete hematologic recovery.
HDAC: high dose cytarabine.
Patients with CK-MK-C17 abns versus CK-MK-No-C17 abns
A total of 195 patients had CK-MK- C17 abns and 175 were CK- MK without C17abns (CK-MK-No-C 17 abns). The presence of C17 abns in CK-MK group did impact neither the clinical characteristics at presentation nor the response to induction chemotherapy compared to patients with CK-MK-No-C 17 abns, Table 3. There was a trend among patients with CK-MK-C17 abnormalities towards higher response rate to induction chemotherapy with HDAC based regimens compared to other regimens but it was not statistically significant (40% vs 29%, respectively, P = 0.08). Furthermore, patients with CK-MK-C17 abn had a similar response to treatment with hypomethylating based regimens compared to CK-MK-No-C 17 abns (50% vs 48%, respectively).
Survival and Multivariate analysis
With median follow-up of 43.7 months (range, 4-72.3), the median OS for the entire CK group was 4.9 months (m) (range, 4.3 - 8 m) with 5-years OS rate of 4%. The median EFS was 1.97 m (range, 1.8-2.27 m) with 5-years EFS rate of 2.7%. Patients with CK-MK had significantly shorter OS compared to patients with CK-Non-MK (4.4 m vs 8 m, respectively, P=0.002) (Figure 1); however, EFS were similar between the two groups (1.8 m vs 2.7 m, respectively, P = 0.079; Figure 1). Furthermore, among patients with CK-MK, patients with 2 or more AM had lower OS (P = 0.011) and a statistically non-significant trend towards shorter EFS (P = 0.08) compared to patients with only 1 AM.
Figure 1.
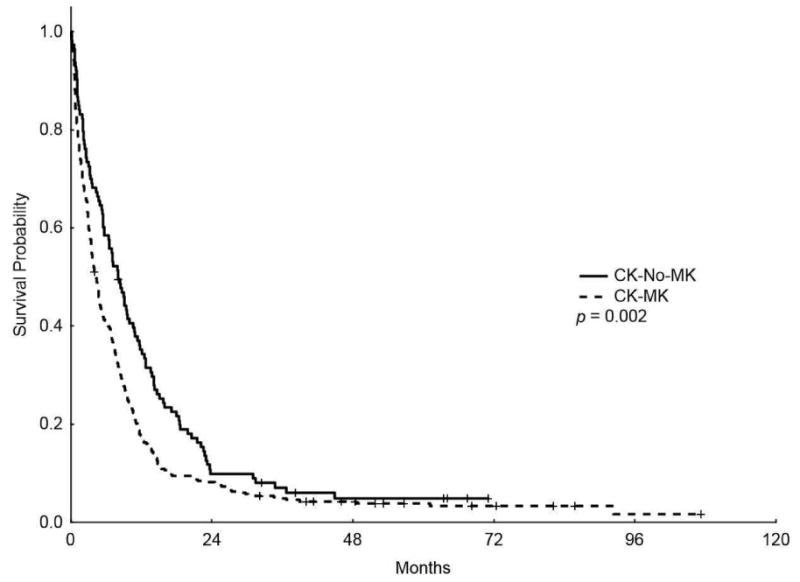
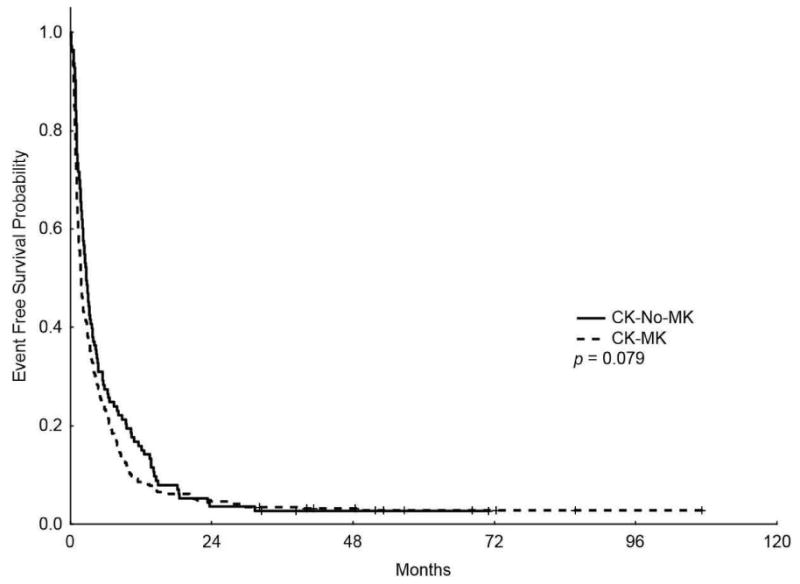
Kaplan-Meier overall survival (A) and event-free survival (B) curves for patients with complex karyotype and monosomal karyotype (CK-MK) and patients with CK without MK (CK-No-MK)
The median OS for patients with CK-C17 abns was lower than patients with CK-No-C17 abns (4 m vs 6.1m, respectively, P = 0.004; Figure 2) (5-years OS rate of 2.7% vs 5.3%, respectively) and the median EFS was also lower in patients with CK-C17 abns (1.83 m vs 2.1m, respectively, P = 0.032; Figure 2) (5-years EFS 1.9% vs 3.5%, respectively).
Figure 2.
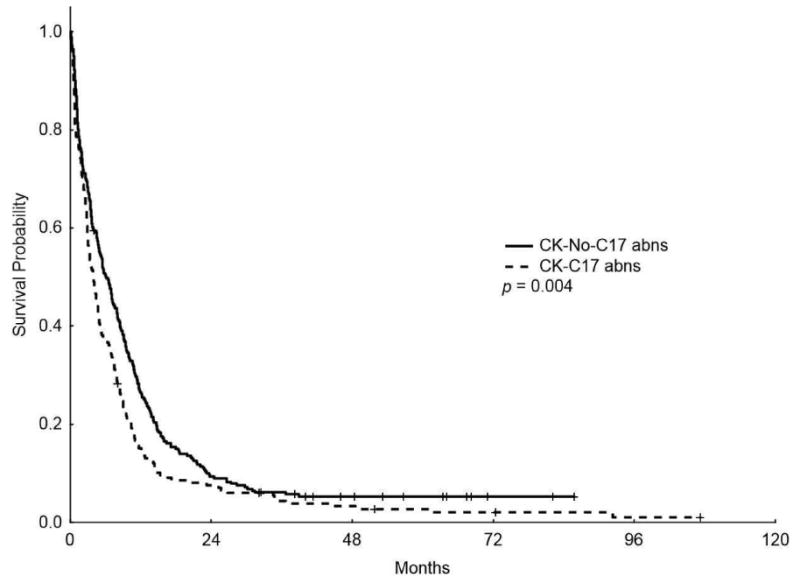
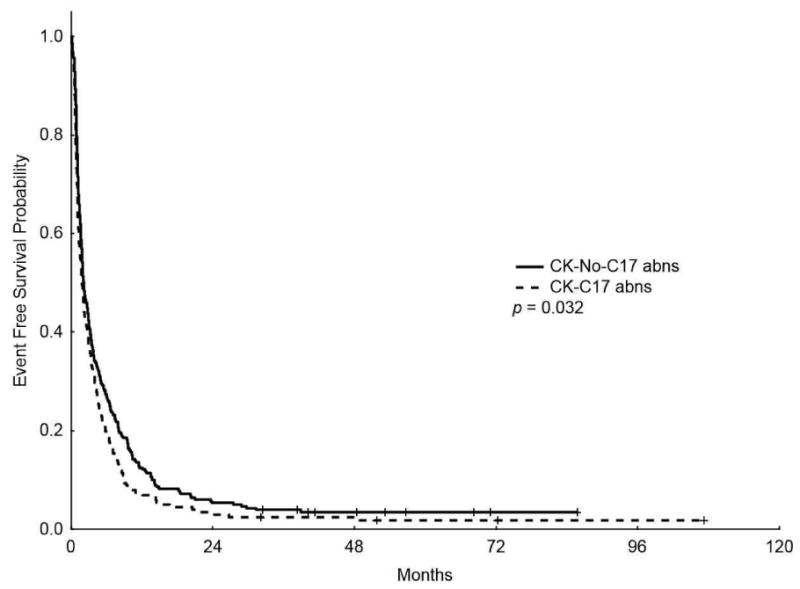
Kaplan-Meier overall survival (A) and event-free survival (B) curves for patients with complex karyotype and chromosome 17 abnormalities (CK-C17 abns) and patients without chromosome 17 abnormalities (CK-No-C17 abns)
In addition, the median OS for patients with CK-MK-C17 abns was lower than patients with CK-MK without C17 abns (3.9 m vs 4.9 m, respectively, P = 0.046; Figure 3) (5-years OS rate of 2.9% vs 5.2%, respectively); however, the median EFS was similar between the two groups (1.83 m vs 1.83 m, P = 0.136, respectively) (5-years EFS rate of 1.92% vs 2.9%, respectively).
Figure 3.
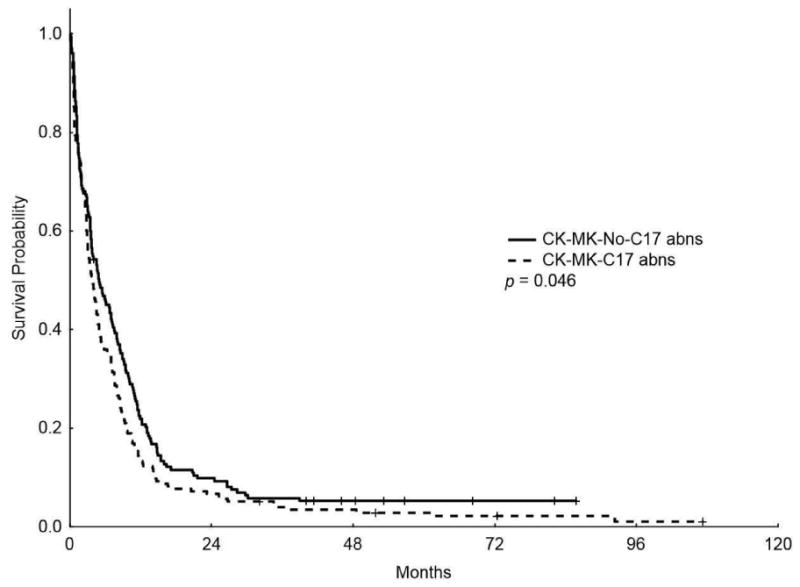
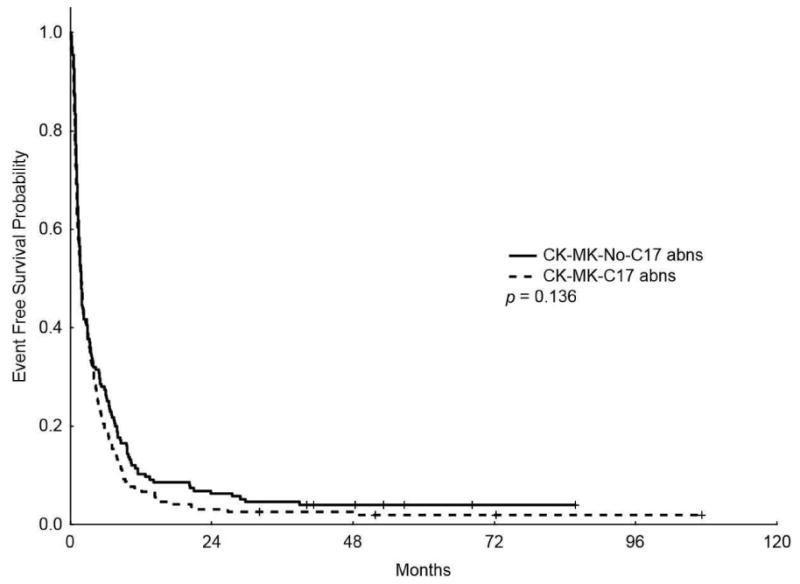
Kaplan-Meier overall survival (A) and event-free survival (B) curves for patients with complex karyotype, monosomal karyotype, and chromosome 17 abnormalities (CK-MK-C17 abns) and patients with complex karyotype and monosomal karyotype without chromosome 17 abnormalities (CK-MK-No-C17 abns)
In a multivariate analysis including the prognostic variables of age, performance status, presence of MK (yes/no) and C17 abns (yes/no), white blood cell count at presentation, and response to induction chemotherapy, the presence of MK among patients with CK was an independent prognostic indicator for shorter OS (hazard ratio [HR] 1.62, 95% CI 1.27-2.06, P < 0.001) but not for EFS (HR 1.07, 95% CI 0.85-1.36, P = 0.56; Table 4). Although the presence of C17 abns among all patients with CK did not impact the OS (HR 1.18, 95% CI 0.97-1.44, P = 0.11) nor the EFS (HR 1.20, 95% CI 0.98-1.46, P = 0.07), it has significant negative impact on OS (HR 1.25, 95% CI 1.01-1.54, P = 0.04) but not EFS (HR 1.21, 95% CI 0.98-1.50, P = 0.07) among patients with CK-MK, Table 4.
Table 4. Multivariate analysis of factors affecting overall survival (OS) and event-free survival (EFS) among patients with complex karyotype.
| Variable | OS | EFS | ||||
|---|---|---|---|---|---|---|
|
| ||||||
| Hazard ratio | 95% confidence interval | P value | Hazard ratio | 95% confidence interval | P value | |
| Chromosome 17 abnormalities | 1.18 | 0.97-1.44 | 0.106 | 1.20 | 0.98-1.46 | 0.075 |
| Monosomal karyotype | 1.60 | 1.26-2.04 | <0.001 | 1.07 | 0.85-1.36 | 0.562 |
| Performance status | 1.81 | 1.46-2.24 | <0.001 | 1.73 | 1.40-2.14 | <0.001 |
| Response to chemotherapy* | 0.44 | 0.36-0.54 | <0.001 | 0.15 | 0.12-0.19 | <0.001 |
| White blood cell count at presentation (<10 vs >10) | 1.00 | 1.00-1.01 | 0.013 | 1.01 | 1.00-1.01 | <0.001 |
| Age (<60 vs > 60) | 1.02 | 1.01-1.02 | <0.001 | 1.01 | 1.00-1.01 | <0.001 |
Complete remission, complete remission with incomplete platelet recovery, or complete remission with incomplete hematologic recovery.
Discussion
In this study, we evaluated the prognostic impact of C17 abns, alone or in concurrence with MK, as an independent risk factor for outcome in patients with CK-AML. The frequency of C17 abns among patients with CK-AML and the fact that C17 abns were seen rarely in patients with CK-AML without MK are consistent with other reports7. This suggests that in patients with CK-AML, C17 abns are most commonly associated with other autosomal monosomies or structural abnormalities and are rarely found as an isolated abnormality. This negative impact of C17 abns in CK-MK could be derived from the association with TP53 alterations 12,13,15-18. In an array-based genomic profiling of 234 CK-AML patients, TP53 alterations were found in 80% of CK-MK patients compared to 42% in CK-AML without MK (P<0.001) by conventional cytogenetics and 79% versus 66% (P = 0.07) by using SNP array-based genomic profiling18. Thus TP53 alterations seem to be frequently detected in CK-AML with use of sensitive methods, irrespective of the presence of C17 abns. Furthermore, the adverse impact of C17 abns within this group may not be all attributable to TP53 alterations.
Although the overall response rate to induction chemotherapy was low in patients with CK-MK, treatment with HDAC based regimens was associated with higher repose rate compared to other regimens; nevertheless, the overall outcome remains very poor. This may resonate with a recent study that has shown an improvement in the OS of patients with CK-MK (HR 0.58, 95% CI 0.37–0.91, P = 0.02) when they were treated with HDAC based regimen (defined as a total dose of cytarabine 10 g/m2 in the first cycle and 16 g/m2 in the second cycle) compared to lower dosage of cytarabine (total dose of 1.4 g/m2 in the first cycle and 12 g/m2 in the second cycle)29. In that context, age may need to be further considered, as shown in our analysis, that remission rate was worse when patients older than 60 years treated with HDAC.
Breems et al reported that MK was an independent risk factor for very dismal outcome in patients with AML, with OS rates of 3-4% over 4 years5. The majority of their MK patients had also CK; however, patients with MK who did not have CK, had the same very poor prognosis as all patients with MK (4-year OS rate 9% vs 3%, P = 0.61) suggesting that MK is a better prognostic indicator than CK. Furthermore, the outcome was similar among patients with CK who had 3 or more abnormalities compared with patients who had 5 or more abnormalities. In addition, the poor prognosis associated with MK in their study was not related to the presence of distinct chromosomal abnormalities such as del 5 or del 75. Our results also corroborate the finding that outcome among patients with CK-MK is significantly inferior to that of patients with CK who do not have MK (HR 1.62, 95% CI 1.27-2.06, P < 0.001). The potential negative impact of C17 abns was lost in multivariate analysis of patients with CK when MK is in the model. This is likely because of the fact that almost all patients with C17 abns were in the group with CK-MK. However, C17 abns retained the negative prognostic value within the group of patients with CK-MK, suggesting that the adverse prognostic effect of MK may be derived at least in part from the presence of C17 abns and that C17 abns further define a subgroup with dismal prognosis within the CK-MK AML patients.
Kayser et al reported a higher age at diagnosis, lower hemoglobin levels, lower median white blood cell counts, and a lower percentage of blasts in the peripheral blood and bone marrow, as well as a lower complete remission rate, among patients with MK compared with Non-MK7. For the most part, our findings are consistent. In addition, patients with CK-MK in their study had similar complete remission rates to those of patients with CK-Non-MK (33% vs 45%; P = 0.056), which is again consistent with our findings. The fact that despite similar CR rates, patients with CK-MK have worse OS than those with CK-non MK, suggests that better post-remission strategies are needed to improve outcome in this group while the search continues for regimens to improve CR rates in general among patients with CK-AML.
Interestingly, patients with CK-MK who were treated with hypomethylating agents based regimens had good response to treatment regardless of their C17 abn status suggesting that this approach may help improve the overall outcome of these patients. Furthermore, and based on recent reports from our group and others, agents like clofarabine and hypomethylating agents (decitabine and 5-azacitidine) need to be investigated among this group of patients30,31.
In conclusion, our analysis corroborates the adverse prognostic impact of MK in patients with CK-AML. Presence of C17 abns within the group of patients with CK-MK AML defines a subgroup with significantly dismal prognosis. Although intensification of induction regimens may produce higher response rate, the overall outcome remains very poor among patients with CK-MK with or without C17 abns and enrolling these patients in trials with innovative induction and post-induction regimens is imperative to improve their outcome.
Footnotes
Disclosures: The authors declare no financial conflicts of interest
Publisher's Disclaimer: This is a PDF file of an unedited manuscript that has been accepted for publication. As a service to our customers we are providing this early version of the manuscript. The manuscript will undergo copyediting, typesetting, and review of the resulting proof before it is published in its final citable form. Please note that during the production process errors may be discovered which could affect the content, and all legal disclaimers that apply to the journal pertain.
References
- 1.Grimwade D, Hills RK, Moorman AV, et al. Refinement of cytogenetic classification in acute myeloid leukemia: determination of prognostic significance of rare recurring chromosomal abnormalities among 5876 younger adult patients treated in the United Kingdom Medical Research Council trials. Blood. 2010;116:354–65. doi: 10.1182/blood-2009-11-254441. [DOI] [PubMed] [Google Scholar]
- 2.Mrozek K, Heerema NA, Bloomfield CD. Cytogenetics in acute leukemia. Blood Rev. 2004;18:115–36. doi: 10.1016/S0268-960X(03)00040-7. [DOI] [PubMed] [Google Scholar]
- 3.Schoch C, Haferlach T, Haase D, et al. Patients with de novo acute myeloid leukaemia and complex karyotype aberrations show a poor prognosis despite intensive treatment: a study of 90 patients. Br J Haematol. 2001;112:118–26. doi: 10.1046/j.1365-2141.2001.02511.x. [DOI] [PubMed] [Google Scholar]
- 4.Visani G, Bernasconi P, Boni M, et al. The prognostic value of cytogenetics is reinforced by the kind of induction/consolidation therapy in influencing the outcome of acute myeloid leukemia--analysis of 848 patients. Leukemia. 2001;15:903–9. doi: 10.1038/sj.leu.2402142. [DOI] [PubMed] [Google Scholar]
- 5.Breems DA, Van Putten WL, De Greef GE, et al. Monosomal karyotype in acute myeloid leukemia: a better indicator of poor prognosis than a complex karyotype. J Clin Oncol. 2008;26:4791–7. doi: 10.1200/JCO.2008.16.0259. [DOI] [PubMed] [Google Scholar]
- 6.Haferlach C, Alpermann T, Schnittger S, et al. Prognostic value of monosomal karyotype in comparison to complex aberrant karyotype in acute myeloid leukemia: a study on 824 cases with aberrant karyotype. Blood. 2012;119:2122–5. doi: 10.1182/blood-2011-10-385781. [DOI] [PubMed] [Google Scholar]
- 7.Kayser S, Zucknick M, Dohner K, et al. Monosomal karyotype in adult acute myeloid leukemia: prognostic impact and outcome after different treatment strategies. Blood. 2012;119:551–8. doi: 10.1182/blood-2011-07-367508. [DOI] [PubMed] [Google Scholar]
- 8.Ahn HK, Jang JH, Kim K, et al. Monosomal karyotype in acute myeloid leukemia predicts adverse treatment outcome and associates with high functional multidrug resistance activity. Am J Hematol. 2012;87:37–41. doi: 10.1002/ajh.22193. [DOI] [PubMed] [Google Scholar]
- 9.Mrozek K. Cytogenetic, molecular genetic, and clinical characteristics of acute myeloid leukemia with a complex karyotype. Semin Oncol. 2008;35:365–77. doi: 10.1053/j.seminoncol.2008.04.007. [DOI] [PMC free article] [PubMed] [Google Scholar]
- 10.Delgado J, Espinet B, Oliveira AC, et al. Chronic lymphocytic leukaemia with 17p deletion: a retrospective analysis of prognostic factors and therapy results. Br J Haematol. 2012 doi: 10.1111/j.1365-2141.2011.09000.x. [DOI] [PubMed] [Google Scholar]
- 11.Avet-Loiseau H, Attal M, Campion L, et al. Long-term analysis of the IFM 99 trials for myeloma: cytogenetic abnormalities [t(4;14), del(17p), 1q gains] play a major role in defining long-term survival. J Clin Oncol. 2012;30:1949–52. doi: 10.1200/JCO.2011.36.5726. [DOI] [PubMed] [Google Scholar]
- 12.Soenen V, Preudhomme C, Roumier C, Daudignon A, Lai JL, Fenaux P. 17p Deletion in acute myeloid leukemia and myelodysplastic syndrome. Analysis of breakpoints and deleted segments by fluorescence in situ. Blood. 1998;91:1008–15. [PubMed] [Google Scholar]
- 13.Seifert H, Mohr B, Thiede C, et al. The prognostic impact of 17p (p53) deletion in 2272 adults with acute myeloid leukemia. Leukemia. 2009;23:656–63. doi: 10.1038/leu.2008.375. [DOI] [PubMed] [Google Scholar]
- 14.Nahi H, Lehmann S, Bengtzen S, et al. Chromosomal aberrations in 17p predict in vitro drug resistance and short overall survival in acute myeloid leukemia. Leuk Lymphoma. 2008;49:508–16. doi: 10.1080/10428190701861645. [DOI] [PubMed] [Google Scholar]
- 15.Fenaux P, Preudhomme C, Quiquandon I, et al. Mutations of the P53 gene in acute myeloid leukaemia. Br J Haematol. 1992;80:178–83. doi: 10.1111/j.1365-2141.1992.tb08897.x. [DOI] [PubMed] [Google Scholar]
- 16.Haferlach C, Dicker F, Herholz H, Schnittger S, Kern W, Haferlach T. Mutations of the TP53 gene in acute myeloid leukemia are strongly associated with a complex aberrant karyotype. Leukemia. 2008;22:1539–41. doi: 10.1038/leu.2008.143. [DOI] [PubMed] [Google Scholar]
- 17.Bowen D, Groves MJ, Burnett AK, et al. TP53 gene mutation is frequent in patients with acute myeloid leukemia and complex karyotype, and is associated with very poor prognosis. Leukemia. 2009;23:203–6. doi: 10.1038/leu.2008.173. [DOI] [PubMed] [Google Scholar]
- 18.Rucker FG, Schlenk RF, Bullinger L, et al. TP53 alterations in acute myeloid leukemia with complex karyotype correlate with specific copy number alterations, monosomal karyotype, and dismal outcome. Blood. 2012;119:2114–21. doi: 10.1182/blood-2011-08-375758. [DOI] [PubMed] [Google Scholar]
- 19.Slingerland JM, Minden MD, Benchimol S. Mutation of the p53 gene in human acute myelogenous leukemia. Blood. 1991;77:1500–7. [PubMed] [Google Scholar]
- 20.Drach J, Ackermann J, Fritz E, et al. Presence of a p53 gene deletion in patients with multiple myeloma predicts for short survival after conventional-dose chemotherapy. Blood. 1998;92:802–9. [PubMed] [Google Scholar]
- 21.Kanagal-Shamanna R, Bueso-Ramos CE, Barkoh B, et al. Myeloid neoplasms with isolated isochromosome 17q represent a clinicopathologic entity associated with myelodysplastic/myeloproliferative features, a high risk of leukemic transformation, and wild-type TP53. Cancer. 2012;118:2879–88. doi: 10.1002/cncr.26537. [DOI] [PubMed] [Google Scholar]
- 22.Middeke JM, Beelen D, Stadler M, et al. Outcome of high-risk acute myeloid leukemia after allogeneic hematopoietic cell transplantation: negative impact of abnl(17p) and -5/5q. Blood. 2012;120:2521–8. doi: 10.1182/blood-2012-03-417972. [DOI] [PubMed] [Google Scholar]
- 23.Mohr B, Schetelig J, Schafer-Eckart K, et al. Impact of allogeneic haematopoietic stem cell transplantation in patients with abnl(17p) acute myeloid leukaemia. British journal of haematology. 2013;161:237–44. doi: 10.1111/bjh.12253. [DOI] [PubMed] [Google Scholar]
- 24.Breems DA, Van Putten WL, Lowenberg B. The impact of abn(17p) and monosomy -5/del(5q) on the prognostic value of the monosomal karyotype in acute myeloid leukemia. Blood. 2013;121:3056–7. doi: 10.1182/blood-2013-01-475012. [DOI] [PubMed] [Google Scholar]
- 25.Medeiros BC, Othus M, Fang M, Roulston D, Appelbaum FR. Prognostic impact of monosomal karyotype in young adult and elderly acute myeloid leukemia: the Southwest Oncology Group (SWOG) experience. Blood. 2010;116:2224–8. doi: 10.1182/blood-2010-02-270330. [DOI] [PMC free article] [PubMed] [Google Scholar]
- 26.Vardiman JW, Thiele J, Arber DA, et al. The 2008 revision of the World Health Organization (WHO) classification of myeloid neoplasms and acute leukemia: rationale and important changes. Blood. 2009;114:937–51. doi: 10.1182/blood-2009-03-209262. [DOI] [PubMed] [Google Scholar]
- 27.Cheson BD, Bennett JM, Kopecky KJ, et al. Revised recommendations of the International Working Group for Diagnosis, Standardization of Response Criteria, Treatment Outcomes, and Reporting Standards for Therapeutic Trials in Acute Myeloid Leukemia. J Clin Oncol. 2003;21:4642–9. doi: 10.1200/JCO.2003.04.036. [DOI] [PubMed] [Google Scholar]
- 28.Shaffer LG, T N, editors. ISCN 2005: An International System for Human Cytogenetic Nomenclature. Basel, Switzerland: S. Karger; 2005. [Google Scholar]
- 29.Lowenberg B, Pabst T, Vellenga E, et al. Cytarabine dose for acute myeloid leukemia. N Engl J Med. 2011;364:1027–36. doi: 10.1056/NEJMoa1010222. [DOI] [PubMed] [Google Scholar]
- 30.Faderl S, Ferrajoli A, Wierda W, et al. Clofarabine combinations as acute myeloid leukemia salvage therapy. Cancer. 2008;113:2090–6. doi: 10.1002/cncr.23816. [DOI] [PMC free article] [PubMed] [Google Scholar]
- 31.Quintas-Cardama A, Ravandi F, Liu-Dumlao T, et al. Epigenetic therapy is associated with similar survival compared with intensive chemotherapy in older patients with newly diagnosed acute myeloid leukemia. Blood. 2012;120:4840–5. doi: 10.1182/blood-2012-06-436055. [DOI] [PMC free article] [PubMed] [Google Scholar]


