Abstract
The electron density map of polyoma virus capsid crystals solved at 22.5 Å resolution by molecular replacement [Rayment, Baker, Caspar & Murakami (1982). Nature (London), 295, 110–115] shows that the 72 capsomeres that form the polyoma capsid are all pentamers. An extensive series of refinement calculations were undertaken to demonstrate the validity of this unexpected result. This report describes the details of the data collection, structure determination and the tests of the methods applied. The refinement calculations demonstrate that the refined phases are insensitive to the initial phasing model for a wide variety of models. They also show that it is vital to include in the refinement calculations interpolated values for the unrecorded data. A variety of tests demonstrate that the all-pentamer structure of the polyoma capsid is determined by the diffraction amplitudes and the self-consistent constraint that the 72 capsomeres are arranged with icosahedral symmetry within a well defined limiting envelope.
Introduction
Crystals of the icosahedrally symmetric polyoma virus capsids give clear X-ray diffraction patterns to a resolution of at least 8 A. We have solved the crystal structure of the 495 Å diameter capsid to a resolution of 22.5 Å by refinement of low-resolution models using the fivefold noncrystallographic symmetry present in the diffraction data (Rayment, Baker, Caspar & Murakami, 1982). The calculated electron density map clearly shows that the 72 capsomeres that form the polyoma capsid are all pentamers. This experimental result contradicts the theory of quasi-equivalence in virus particle design (Caspar & Klug, 1962) which predicts that the 60 hexavalent capsomeres in the T = 7d icosahedral surface lattice should be hexamers while only the 12 pentavalent capsomeres should be pentamers. Extensive tests of the refinement method, using structure factor amplitudes calculated from models as trial data, demonstrate that the iterative real-space symmetry averaging of the solvent-flattened maps obtained with initial phases from trial models can reliably converge to the structure corresponding to the starting data (Rayment, 1983). Starting with real data, however, there is the possibility that experimental artifacts may limit the reliability of the refinement method. The objective of this paper is to establish that refinement of polyoma capsid diffraction data leads to the correct structure.
Strategy for structure determination
The strategy adopted for solving the structure consisted of calculating an initial set of phases from a model built from a knowledge of the coarse surface structure and particle diameter of the virus and refining these phases by imposing the constraints of noncrystallographic symmetry and solvent flattening. This approach is similar to that used to determine the structure of southern bean mosaic virus to 22.5 Å resolution (Johnson, Akimoto, Suck, Rayment & Rossmann, 1976). This strategy was tested by performing an extensive series of model calculations in which the observed polyoma data were replaced by a model native data set (Rayment, 1983). These model calculations showed that the refinement strategy can, with careful use, result in a set of phases close to their true values, free from the bias of the starting model.
It was not considered practical to attempt to derive initial phases by isomorphous replacement because of the difficulty of locating the heavy-atom sites. The asymmetric unit of the icosahedrally symmetric virus (1/60 of the structure) was expected to contain seven chemically identical subunits of the major coat protein, assuming 420 subunits in the particle. In this case, a single site substitution of the major coat protein would introduce seven noncrystallographically independent heavy-atom sites in the icosahedral asymmetric unit of the virus or a total of 35 in the crystallographic asymmetric unit (space-group symmetry 123). With 360 subunits, corresponding to the 72 pentamer structure, there would be 6 independent sites in the icosahedral asymmetric unit and 30 in the crystallographic unit. At high resolution, it is unlikely that the Patterson function from crystals with such large numbers of independent heavy-atom sites could be interpreted. At low resolution, the Patterson function certainly could not be solved.
The approach adopted by Harrison & Jack (1975) for finding the heavy-atom sites in TBSV was not attempted. They were able to determine the heavy-atom sites in a PtC16 derivative of TBSV using phases derived from solution scattering in conjunction with the phases generated from a three-dimensional reconstruction of negatively stained electron micrographs and the differences in X-ray intensities between two data sets collected from crystals at different ionic strength. This direct method for obtaining phase information was not followed for two reasons. Firstly, it involves collecting at least two data sets at differing solvent densities which involves considerably more work even if the crystals were stable in high and low electron density solvents. Secondly, the phases obtained would have to be refined by molecular replacement and the model calculations show that the refinement method can refine phases which differ considerably from their true values. This implies that the effort involved in collecting salt differences would not yield a better set of starting phases than those obtained from model building.
The initial reason for solving the structure of polyoma virus at low resolution was to generate a set of phases that could be used to locate the positions of heavy atoms in an isomorphous derivative. Observing the pentameric nature of the hexavalent morphological unit was an unexpected outcome of this low-resolution study. It is planned to use a single isomorphous derivative in conjunction with noncrystallographic averaging to solve the structure of polyoma virus to at least 6 Å resolution. A search is in progress for a suitable heavy-atom derivative which will provide more detailed information about the pentameric substructure of the morphological units.
Data collection
Polyoma virus capsids of the Sp-34 strain were isolated as described previously (Murakami, 1963). The preparation used for growing the crystals consisted predominantly of the major capsid protein VP1 and only a small amount of VP2 and VP3 compared with the intact virion. All crystals used in the data collection were grown from the same preparation in order to eliminate systematic errors introduced by variations between different samples. Crystals in the rhombic dodecahedral form (Adolph, Caspar, Hollingshead, Lattman & Phillips, 1979) were grown by equilibrating a solution of polyoma virus capsids at 4 mg ml−1 in 0 02 M tris pH 9 5 and 0 17 M sodium sulfate against 0.55 M sodium sulfate by vapor diffusion. The crystals grew over a period of one month at 297 K. The vapor-diffusion boxes had a tendency to lose water over several months, thus raising the sodium sulfate concentration. Consequently, prior to use in a diffraction experiment, the crystals were re-equilibrated against a solution of 0.55 M sodium sulfate and 0.02 M tris at pH 9.5 for ∼7 d. After this period the crystals could be washed with the equilibrating solution without visible damage or a reduction in the order of the crystals as measured by X-ray diffraction. This treatment ensured that there would be no systematic errors caused by salt differences introduced in the measurement of the very-low-resolution data (spacings >100 Å).
Diffraction data were collected to 22.5 Å resolution by conventional screened precession photography using a precession camera (Charles Supper Co., Natick, MA, USA) fitted with a helium path and a crystal-to-film distance of 150 mm. The width of the annulus on the layer-line screen was 1 mm. The data were recorded on Kodak No-screen film (Eastman Kodak Co., Rochester, NY, USA) using Cu Ka radiation from an Elliott GX6 rotating-anode X-ray generator operated at 30 kV, 40 mA, using a 0.2 mm focal cup and two perpendicular-focusing mirrors (Harrison, 1968; Phillips & Rayment, 1982). Each precession photograph was obtained from a different crystal, mounted in a thin-walled quartz capillary and required a 48 h exposure.
In order to minimize the absorption effects the crystals used for each zone were chosen such that in their final orientation they would give diffraction from an approximately flat plate. The crystals were held in place by a thin plastic film prepared in situ as the crystals were mounted (Rayment, Johnson & Suck, 1977). This was necessary to prevent the crystals, which were left very wet, from slipping in the capillary. Crystals were optically oriented on a goniometer and allowed to stabilize for several days before diffraction photographs were obtained.
The high symmetry of the crystal lattice allows a high proportion of the data to be collected on comparatively few photographs. 1481 (94.5%) of the possible 1567 independent reflections to 22.5 Å resolution were recorded on nine zero-level (µ = 2°, four films per pack) and five upper-level (µ = 1.5°, three films per pack) photographs. The measured zones, together with the number of unique reflections, are shown in Table 1.*
Table 1.
Polyoma capsid 22.5 Å precession data
| Zone | [100] | [110] | [110] | [111] | [120] | [120] | [123] | [123] | [210] | [210] | [211] | [221] | [311] | [311] |
|---|---|---|---|---|---|---|---|---|---|---|---|---|---|---|
| Level | 0 | 0 | 1 | 0 | 0 | 1 | 0 | 1 | 0 | 1 | 0 | 0 | 0 | 2 |
| Precession angle (°) | 2.0 | 2.0 | 1.5 | 2.0 | 2.0 | 1.5 | 2.0 | 1.5 | 2.0 | 1.5 | 2.0 | 2.0 | 2.0 | 1.5 |
| Nunique ideal | 251 | 214 | 216 | 193 | 120 | 183 | 141 | 237 | 120 | 183 | 210 | 153 | 279 | 387 |
| Nunique measured | 244 | 185 | 203 | 188 | 114 | 174 | 126 | 227 | 114 | 173 | 186 | 143 | 267 | 358 |
| Overlaps | 107 | 107 | 159 | 106 | 85 | 147 | 111 | 208 | 89 | 142 | 149 | 114 | 195 | 299 |
| Rfilm pack | 11.8 | 5.9 | 11.8 | 10.5 | 10.5 | 7.0 | 6.2 | 6.8 | 10.6 | 5.3 | 8.9 | 13.0 | 5.5 | 14.2 |
| Rsym | 7.0 | 2.9 | 11.9 | 6.7 | 5.3 | 12.8 | 4.6 | 8.1 | 4.0 | 8.1 | 4.3 | 6.5 | 3.9 | 14.0 |
| Rmerge | 7.2 | 4.8 | 13.7 | 5.5 | 4.6 | 7.5 | 3.5 | 6.5 | 4.2 | 7.0 | 8.7 | 6.3 | 3.7 | 12.4 |
Total unique reflections measured: 1481 out of 1567 total possible.
Overall R factor: 5.7% (1205 overlaps).
The films were examined by densitometer at 50 µm scanning raster on an Optronics P1000 Photoscan rotating-drum scanner and processed using a modified version of the Harvard SCAN11 precession-film-scanning program (Harrison & Jack, 1975). Each film was prescanned and displayed in 256 gray levels on a TV monitor (Grinnell Systems Corp., Santa Clara, CA, USA). A screen cursor was used to pick out several reference spots for refinement of the film orientation and lattice coordinates. The intensity of each reflection was measured by integration. On most films the reflections were no larger than 350 µm in diameter which resulted in well resolved reflections. On a typical film an area of 7 × 7 raster steps was integrated to obtain the reflection intensity. An estimate of the background was obtained by measuring the values of 50 points located around the perimeter of a 13 × 13 box centered on the reflection.
Optical densities measured on the Optronics film scanner were corrected for non-linearities between developed film grains and X-ray photons. The calibration wedge was prepared using an X-ray photon detector to monitor the exposure of a test film (Phillips & Phillips, 1983).
Different films within one film pack, symmetry-related reflections within one pack and different film planes were successively scaled together by the method of Hamilton, Rollett & Sparks (1965). Statistically ill determined measurements within each group of symmetry-equivalent reflections were rejected before their average was computed using the contrast-matching technique of Weissman & Stauffacher (1983). This technique was used both in the symmetry-equivalent scaling within one film pack and in the overall plane–plane scaling. Those very weak reflections which were observed to have a negative value for their intensity as measured in the film were carried with their negative values through the scaling process. These reflections were given a value of zero in the final data set. This strategy ensured that the correct average value for a very weak reflection was obtained if multiple measurements were available. Setting negative intensities to zero before the final scaling results in a systematic positive error in the very weak data.
The statistics for the film-pack, symmetry-equivalent and plane–plane scaling are summarized in Table 1. In general the zero-level precession photographs have better scaling statistics than the weaker upper-level zones. It was found that an optical-density calibration wedge prepared under the same conditions that applied for the diffraction photographs significantly improved the scaling.
Derivation of initial phases by model building
Initial phases were obtained from models based on information available from electron microscopy and small-angle X-ray diffraction. The first electron micrographs of negatively stained polyoma virus showed that the surface was composed of a number of doughnut-shaped morphological units (Wildy, Stoker, Macpherson & Horne, 1960). Initial estimates suggested that there were 42 morphological units on the surface of the virus. Klug (1965) showed that the correct number is 72. These are arranged on a T = 7d icosahedral surface lattice (Caspar & Klug, 1962). The three-dimensional image reconstruction of negatively stained particles (Finch, 1974) confirmed the T = 7d distribution of the morphological units and gave a good estimate of the coordinates of the hexavalent morphological unit on the surface lattice. In addition, the image reconstruction suggested that the size and extent of the morphological units were the same for both the hexavalent and pentavalent units. The exact size of the morphological units could not be determined because the extent of shrinkage of the particle on the grid was unknown and because the choice of contrast level was arbitrary.
Small-angle-scattering experiments on the capsid showed that the inner and outer diameters of the hollow particles were about 330 and 500 Å, respectively. These estimates were not very accurate because the diffraction patterns indicated that solutions were inhomogeneous. An accurate estimate of the outer diameter of the particle was obtained from consideration of the packing constraints in the 123 unit cell (Adolph, Caspar, Hollingshead, Lattman & Phillips, 1979). This indicated a packing diameter of ∼500 Å.
This structural information was used to construct a model from which structure factors were calculated. The model was built in the form of an electron density map in the same unit cell as that in which the virus crystallizes (Rayment, 1983). The initial model consisted of 72 hollow cylindrical capsomeres on a spherical shell. The location and dimensions of the morphological unit were adjusted until the lowest R factor between the calculated and observed data was attained. The R factor was defined as R = ∑ | |Fo| − |Fc||/∑|Fo|, where |Fo| and |Fc| are the observed and calculated amplitudes.
The models which gave the best fit were built from cylindrical morphological units about 40 Å high and 80 Å in diameter with a 35 Å diameter axial hole. These units were placed on a spherical shell extending between radii of 180 and 200 Å. Details of the refinement of phases from this model have been described previously (Rayment, Baker, Caspar & Murakami, 1982). Because the refined structure from these starting phases showed that all 72 morphological units contain five copies of the major coat protein, phases from other models were tried in order to assess whether the starting phases could bias the final result. Numerous sets of phases were tested which may be placed into two classes: (a) phases from a detailed model which contains unfounded assumptions about the substructure of the morphological units; (b) phases from a rudimentary model built assuming as little information as possible about the virus structure. Phases from all of the models that were generated refined towards the same phase set: that which produces the image with pentameric morphological units.
The effect and treatment of the unrecorded data
The polyoma capsid data set contains measurements for 94% of the data out to 22.5 Å resolution. The eight lowest-order reflections with spacings greater than 150 Å were not measured. The distribution of the higher-order unrecorded data is fairly even with respect to resolution. Even though a high percentage of the data has been measured the absence of a small portion of the data was found to inhibit severely the phase refinement. This problem was overcome by including calculated values for the unmeasured reflections which were generated by imposing the noncrystallographic constraints on the observed structure factors. A systematic series of model calculations have clearly demonstrated the validity of this approach (Rayment, 1983).
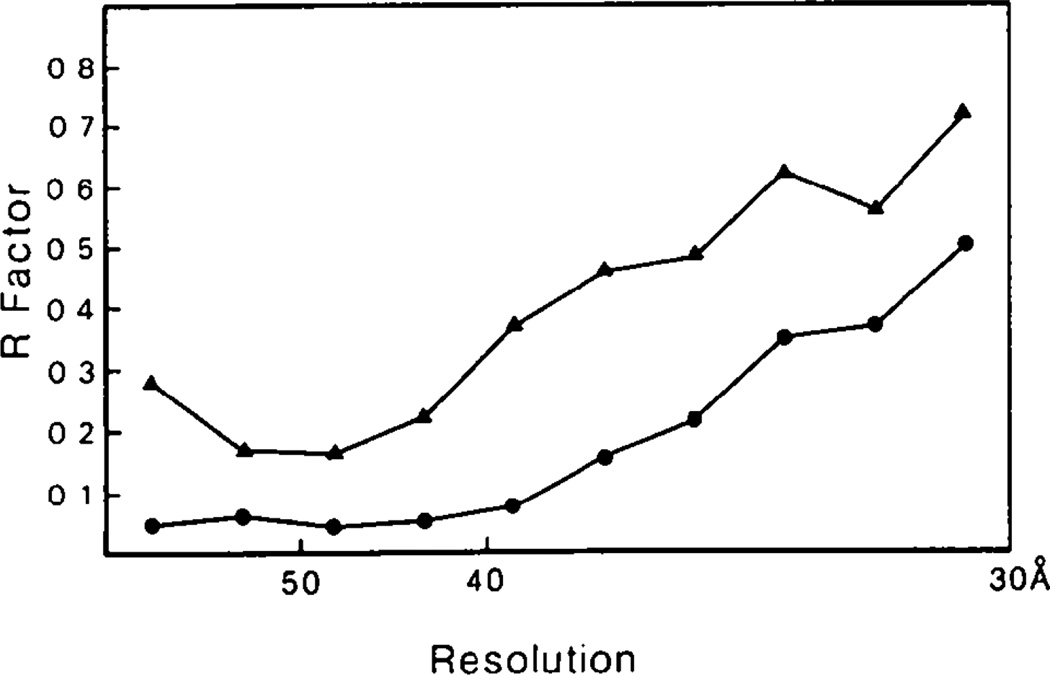
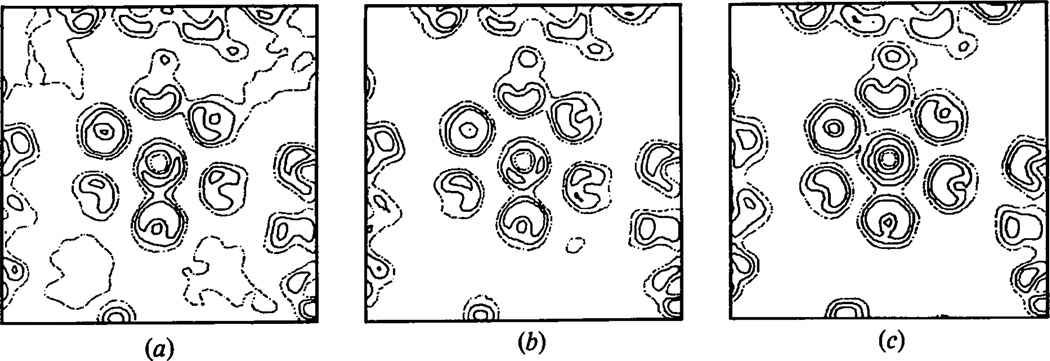
A comparison of the results obtained by ignoring or compensating for the unrecorded data is shown in Fig. 1. Initial phases were obtained from the model built incorporating information from the three-dimensional image reconstruction, solution scattering and crystal packing considerations. The model parameters were adjusted to improve the fit with the observed diffraction data (Rayment, Baker, Caspar & Murakami, 1982). When compensation for the unrecorded data was not made, refinement of the phases was complete after four cycles. At this point the R factor between the calculated and observed structure factor amplitudes was 30%. One section through the resultant electron density map before and after averaging is shown in Figs. 2(a) and 2(b). The maps were calculated on an arbitrary scale such that the maximum density value in the complete three-dimensional map was 200. The maps shown were contoured at levels of 0., 60. and 120. The average solvent density on this scale was −32. This value is necessarily negative because F(000) was not included in the Fourier calculation (Rayment, 1983). The map section corresponds to a plane perpendicular to the axis of a hexavalent unit 220 Å from the center of the virus capsid. If the calculated values for the unrecorded data are included in ten additional cycles of phase refinement, the final R factor drops to 10.0%. The same section through the final electron density map is shown in Fig. 2(c). Comparison of these maps showed that failure to compensate for the unrecorded data results in a significantly different electron density distribution in the hexavalent morphological unit.
Fig. 1.
The distribution of R factor with resolution for refinement with (●) and without (▲) inclusion of calculated values for the unmeasured data. Inclusion of the calculated values gives a significant improvement in the quality of the refinement.
Fig. 2.
The effect of ignoring the unmeasured data on the phase refinement at 30 Å resolution. The maps are perpendicular to the axis of a hexavalent morphological unit sectioned 215 Å from the particle center. The width of the map sections is 472 Å. (a) Final unaveraged and (b) averaged map calculated using phases refined only including the observed polyoma capsid data; (c) the unaveraged map calculated from phases refined including calculated values for the unmeasured data.
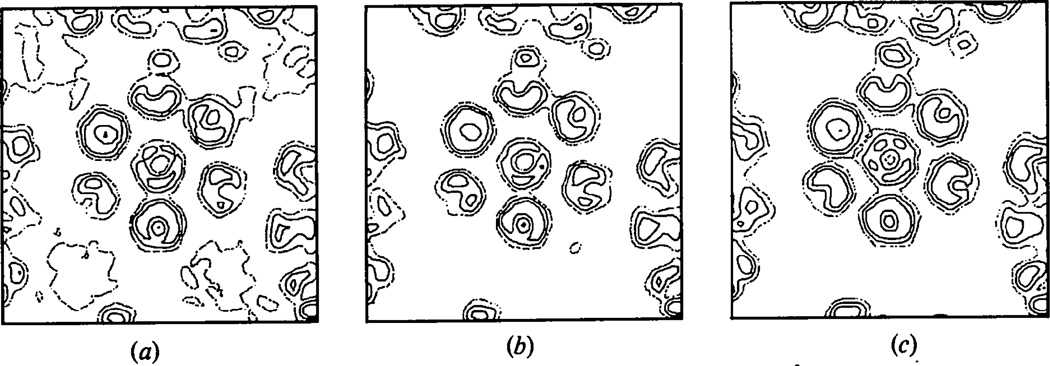
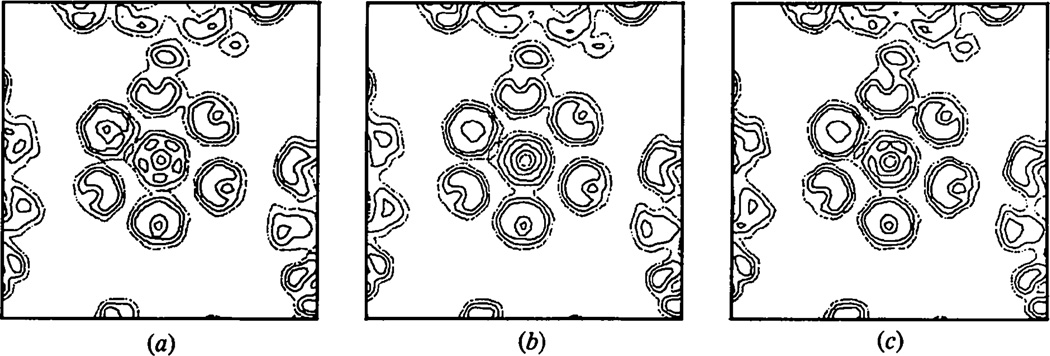
The unrecorded data also affect the success of the phase extension. Fig. 3(a) and (b) shows a section through a hexavalent unit in the final unaveraged and averaged electron density map obtained by phase extension from 30 to 22.5 Å resolution without compensating for the unmeasured data. The final R factor between the calculated and observed amplitudes was 32%. For comparison the same section through the refined map obtained by including the calculated values for the missing data is shown in Fig. 3(c) for which the R factor was 10.0%. Failure to compensate for the small portion of the data that is unrecorded clearly leads to an ambiguous electron density map. In this case, it is difficult to interpret the substructure of the hexavalent morphological units. However, the sizes of the pentavalent and hexavalent capsomeres in the average map generated without compensating for the unrecorded reflections still correspond closely to each other even though the map is noisier than that obtained by interpolating the missing data.
Fig. 3.
The effect of ignoring the unmeasured data on the phase extension from 30 to 22.5 Å resolution. (a) Final unaveraged and (b) averaged map phase-extended without compensating for the unmeasured data. (c) Unaveraged map after phase extension including calculated values for the unrecorded data.
It is difficult to prove categorically that the calculated values for the missing data are close to their true values without measuring them. An alternative demonstration can be obtained by removing terms from the data set whose amplitudes have been measured. These reflections can then constitute a test of the fidelity of the calculated values for the actually unrecorded data. Thus, an additional random 6% (88 terms) of the observed data was removed between 22.5 and 150 Å resolution. The remaining 88% of the data were combined with the phases from the optimum model described earlier. The phases to 30 Å resolution were refined for two cycles using only the 88% of the data now considered measured; in succeeding cycles the calculated values for the missing data were included in the refinement. After a total of 15 cycles of refinement to 30 Å resolution the R factor between the calculated and the 88% observed amplitudes included in the calculation was 10.9%. By comparison, the R factor between the calculated and observed values for the 6% that were removed was 16%: a convincing demonstration of the reliability of the calculated values generated for the unrecorded reflections by symmetry averaging.
The refined phases were used as the basis for initiating phase extension with the reduced data set from 30 to 22.5 Å resolution. In this case the exclusion of 6% of the data that had been measured gave slower convergence. The resolution of the refinement was extended from 30 to 22.5 Å in steps of (1/572 Å) every third cycle. After 30 cycles of extension and refinement, the R factor between the 88% of the data actually included and their calculated values was 14.6%. The overall R factor to 22.5 Å resolution between the calculated and observed values for the 6% which had been removed was 16.9%: again, a convincing demonstration of the validity of including calculated values for the unrecorded reflections.
It was found that the exact cycle in which the calculated values for the unrecorded reflections were included was not important as long as they were not included in the first cycle. In the first cycle, the phases and amplitudes for the missing data come directly from the model. Inclusion of these terms, especially the very large centric low-resolution reflections, could lock the phases into an incorrect set which would not converge. This problem arises because the phases of the unmeasured very-low-resolution terms are very sensitive to the radial electron density distribution. It is difficult to derive a set of model phases and amplitudes which accurately reflect the real radial density distribution when those terms most sensitive to it have not been measured.
Refinement of phases from detailed models
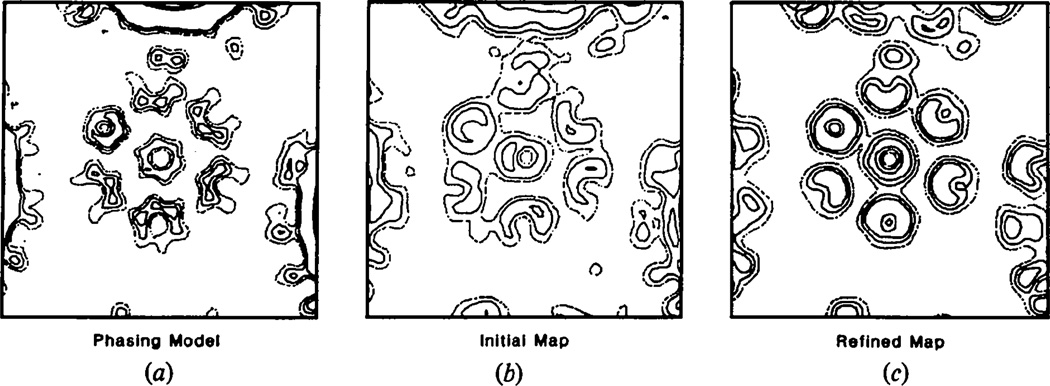
There is no a priori method of predicting with absolute assurance the substructure of the morphological units. Building substructure into the morphological units of the initial phasing models is consequently not justified. Nevertheless, because the refinement of phases from a reasonable model yielded a structure with all morphological units pentameric, it must be shown that phases from models built with sixfold substructure in their hexavalent units also refine to the all-pentamer structure. To test this, a model was constructed in which the 60 hexavalent morphological units were built from six small solid cylinders of density, 13 Å in diameter, 40 Å long, located 24 Å from the hexavalent axis. The 12 pentavalent units were built in a similar way from five cylinders situated 19 Å from the icosahedral fivefold axes. These 72 morphological units rested on a concentric shell of density extending from 180–200 Å. One section through the hexavalent unit of this model at 30 Å resolution is shown in Fig. 4(a). At this resolution, although the hexameric substructure is not well resolved, the shape of the hexavalent morphological unit is clearly defined.
Fig. 4.
Refinement of phases from a 420-subunit model at 30 Å resolution. The maps are perpendicular to the axis of a hexavalent morphological unit sectioned 215 Å from the particle center. (a) The 420-subunit phasing model, (b) combination of the phases from the 420-subunit model with the observed amplitudes and (c) combination of the final refined phases with the observed polyoma capsid diffraction amplitudes including calculated values for the unrecorded data.
The phases from this 420-subunit model were combined with the observed data to 30 Å using the weighting scheme described later. One section of the resultant noisy map is shown in Fig. 4(b). The R factor between the model and observed amplitudes was 59%, which is significantly worse than that of 50% between more reasonable models and the observed data.
Refinement of this phase set proceeded more slowly than the phases from the reasonable model. After 15 cycles the R factor between the observed and calculated structure factor amplitudes was 12.0%. An additional eight cycles of refinement were required before convergence (R = 9.6%) was attained. The overall r.m.s. phase change between the initial and final phases was 86°. One section of the refined map is shown in Fig. 4(c). This is indistinguishable from that obtained by refinement of the phases of the reasonable model (Fig. 2c). This similarity is also expressed by the small r.m.s. phase difference of 22° between the refined phase sets from the reasonable and 420-subunit models. It is clear that there is no sixfold character in the hexavalent unit.
The related refinement experiment in which the hexavalent capsomeres in the phasing model were built from five small cylinders of density was also performed. The initial R factor between the observed data and amplitudes from the 360-subunit model was 61%. Phases from this model also refined slowly, requiring 25 cycles of refinement before convergence was attained. The final R factor between the calculated and observed amplitudes was 10.0%. The final electron density map was indistinguishable from that obtained after refinement of phases from the 420-subunit model.
Refinement of phases from a rudimentary model
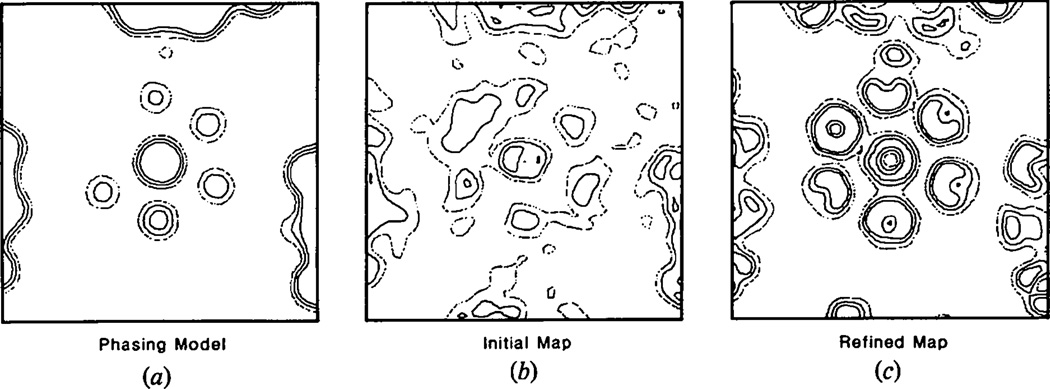
The rudimentary model consisted of 60 spherical morphological units 70 Å in diameter placed close to the location of the hexavalent axes of a T = 7d surface lattice. The centers of the spheres were placed 205 Å from the center of the particle. These spheres intersected a concentric shell of density extending from a radius of 180–200 Å. No density was placed on the 12 pentavalent locations. Although this model is rudimentary, the basic presumption that the particle has icosahedral symmetry is still maintained. The phases from the rudimentary model were combined with the observed amplitudes and used to calculate an electron density map. The initial R factor between the two sets of amplitudes was 65%. An illustration of the initial phase combination prior to averaging and solvent flattening is shown in Fig. 5(b). The map section corresponds to a plane perpendicular to the axis of a hexavalent unit 220 Å from the center of the virus capsid. The cross section of the unaveraged map shows that the initial combination is very noisy. Comparison of this initial map (Fig. 5b) with the same section from the phase model (Fig. 5a) clearly shows that the initial phases dominate the first density map.
Fig. 5.
Refinement of phases from a rudimentary model at 30 Å resolution. The maps are perpendicular to the axis of a hexavalent morphological unit, sectioned 220 Å from the particle center. (a) The rudimentary phasing model, (b) combination of the phases from the rudimentary model with the observed amplitudes and (c) combination of the final refined phases with the observed polyoma capsid diffraction amplitudes including calculated values for the unrecorded data.
Refinement of this set of phases proceeded far more slowly than those from the reasonable model described previously (Rayment, Baker, Caspar & Murakami, 1982). Whereas refinement in that case was essentially complete in 14 cycles refinement of the phases from the rudimentary model required 40 cycles of refinement before convergence was attained. The major reason for the slow convergence was the large number of centric reflections whose signs differed from the most consistent refined set. Strong centric reflections are resistant to sign changes. Consequently, it takes several cycles for a strong centric reflection with an incorrect sign to have its sign switched by its noncrystallographically related neighbors with the correct sign.
A section through the final refined map, shown in Fig. 5(c), is indistinguishable from the refined map obtained from the reasonable model shown in Fig. 2(c). The r.m.s. phase difference between the two refined phase sets was 26° with no significant differences in the centric reflections. The r.m.s. phase change between the starting and refined phase sets at 30 Å was 103°. This refinement is particularly interesting because the starting model has no density on the fivefold axes. The refinement constraints and weighting procedure allowed the phases to change so that the information in the amplitudes could be expressed.
Local-symmetry averaging
The refinement method assumed only that the capsid has icosahedral symmetry and that the solvent at the interior and exterior of the particle has uniform density. No assumptions were made concerning the size of the hexavalent morphological unit or its exact location in the icosahedral surface. Furthermore no symmetry was imposed upon the hexavalent capsomere. In the refined maps the hexavalent morphological unit exhibits clear fivefold substructure despite the expectation of sixfold substructure based on the principles of quasi-equivalence (Caspar & Klug, 1962). In the outer regions of the hexavalent morphological unit the arrangement of the substructure has almost regular fivefold symmetry. In the inner region there are still five distinctive features in the density but they are not symmetrically related by a local fivefold axis.
These features may be explained if the polyoma subunit protein contains two structural domains connected by a hinge region. One protruding domain could then form the external aspects of the morphological units, whereas the other domain could form the inner shell. This would then be analogous to the two-domain structure observed in tomato bushy stunt virus (Harrison, Olson, Schutt, Winkler & Bricogne, 1978) in which the three symmetrically distinct protruding domains with conserved bonding specificity form indistinguishable dimers. The nonequivalence in the structural assembly occurs between the inner domains which make up the shell. The protruding structural feature seen in the polyoma capsid appears to consist of a symmetric fivefold aggregation. On this assumption an additional series of calculations were carried out in which local fivefold and sixfold symmetry was imposed solely on the protruding density of the hexavalent morphological unit. The purpose of these calculations was to demonstrate that the fivefold substructure is a real feature present in the observed amplitudes.
Local-symmetry averaging was carried out simultaneously with the icosahedral averaging. This was accomplished by defining in the unaveraged map those map points which lay within the protruding part of the capsomere. For these points the quasi-related locations within that capsomere were generated. The icosahedral noncrystallographic symmetry was then applied to the set of quasi-related points to generate a list of density locations. The average of these values then gave simultaneously the icosahedral- and local-symmetry-averaged value.
The axis of the hexavalent morphological unit was determined by investigating the power spectrum as a function of position on sections perpendicular to the capsomere. The portion of each hexavalent capsomere which was locally averaged consisted of a cylindrical envelope 85 Å in diameter, extending radially from 200 to 245 Å. This volume represents 28% of the volume of the density contained within the envelope. Local five-and sixfold symmetry averaging was applied to an electron density map calculated using refined phases to 30 Å resolution. This resulted in two sets of calculated amplitudes whose R factors with respect to the observed data were 12.8 and 12.9% for the five- and sixfold local averaging respectively. Without the local-symmetry averaging the R factor was 10%. At 30 Å resolution there is little substructure evident in the capsomeres so that a distinction between the effect of local five- and sixfold averaging cannot be expected.
The local-symmetry averaging procedure was used to extend phases from 30 to 22.5 Å resolution. After 30 cycles of extension and refinement, the R factors between the calculated and observed amplitudes for the five- and sixfold local-symmetry averaging were 17.6 and 18.5% respectively, which should be compared with the R factor of 14% obtained by refinement with icosahedral constraints alone. The R factor rises with the imposition of local symmetry because an additional constraint has been applied to the phases. The fivefold local averaging gives a slightly lower R factor than the sixfold symmetry. Comparison of the electron density maps of the fivefold and sixfold local-symmetry-averaged maps (Fig. 6a,b) shows that the fivefold substructure in the capsomeres has been enhanced, whereas no sixfold substructure has been generated. Removal of the sixfold local-symmetry constraint on the phase refinement results in a rapid regeneration of the fivefold substructure in the hexavalent unit. After four cycles of conventional icosahedral noncrystallographic refinement, the fivefold substructure in the hexavalent unit has almost returned to that obtained by normal phase extension and refinement (Fig. 6c).
Fig. 6.
Phase extension from 30 to 22.5 Å resolution with concurrent imposition of (a) local fivefold and (b) local sixfold symmetry on the hexavalent morphological unit. The application of local fivefold symmetry enhances the substructure in the hexavalent unit whereas the sixfold symmetry results in a total loss of substructure. (c) Four cycles of conventional icosahedral refinement after the sixfold local averaging regenerate the fivefold substructure in the hexavalent unit.
The local-symmetry averaging demonstrates that the fivefold substructure observed in the icosahedrally averaged maps is a real feature of the diffraction amplitudes. The application of local fivefold symmetry on the protruding portion of the hexavalent unit cannot be considered as a genuine additional phase constraint because there is no requirement that the local symmetry is exact even if the five subunits are chemically identical. The small difference in R factor between the five- and sixfold symmetry averaging is an indication that the substructure at this resolution does not contribute substantially to the diffraction amplitudes. The major contribution to the amplitudes of the diffraction pattern still arises from the coarse density distribution of the capsomeres.
The effect of choice of envelope
The purpose of the envelope is to define which parts of the unit cell are to be symmetrically averaged. All other points are treated as solvent and set to a uniform density. Flattening the solvent regions places a powerful constraint on the low-resolution phases and is the basis of phase extension as shown by the model calculations (Rayment, 1983). Thus, the envelope chosen to enclose the virus capsid is a critical parameter in the phase refinement and extension.
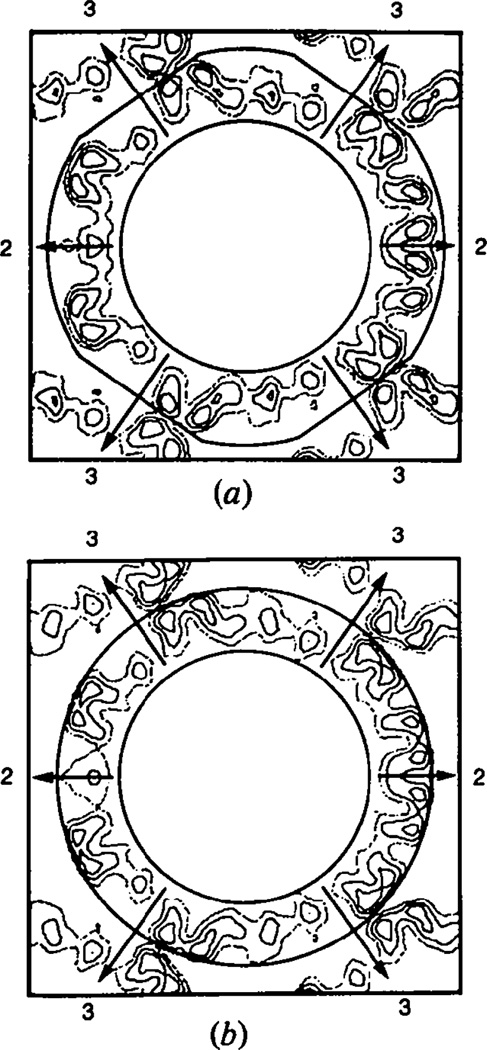
The envelope normally used in the phase refinement was a spherical shell extending from 165 to 260 Å truncated by planes perpendicular to the icosahedral threefold axis 247 Å from the virus center. These boundary planes bisect the line of contact between the virus particles along the crystallographic threefold axes. The intersection of this envelope with the central electron density section perpendicular to the [110] direction is shown in Fig. 7(a). The three hexavalent units adjacent to the crystallographic threefold axis contact tip to tip with the related set on the neighboring particle. This lack of interdigitation is a consequence of the T = 7 skew lattice upon which the capsomeres are located and because neighboring particles are related to one another by a simple centering translation (±½,±½,±½). Without knowing the actual surface morphology the envelope chosen represents the simplest nonoverlapping icosahedral envelope that can be packed into the 123 cell.
Fig. 7.
Sections perpendicular to the [110] direction through the middle of the capsid particle. The width of the section is 572 Å. (a) The envelope used for defining the boundaries of the particle in the phase refinement. (b) Application of a spherical envelope 495 Å in diameter which shows that such an envelope truncates the tips of the hexavalent and pentavalent morphological units.
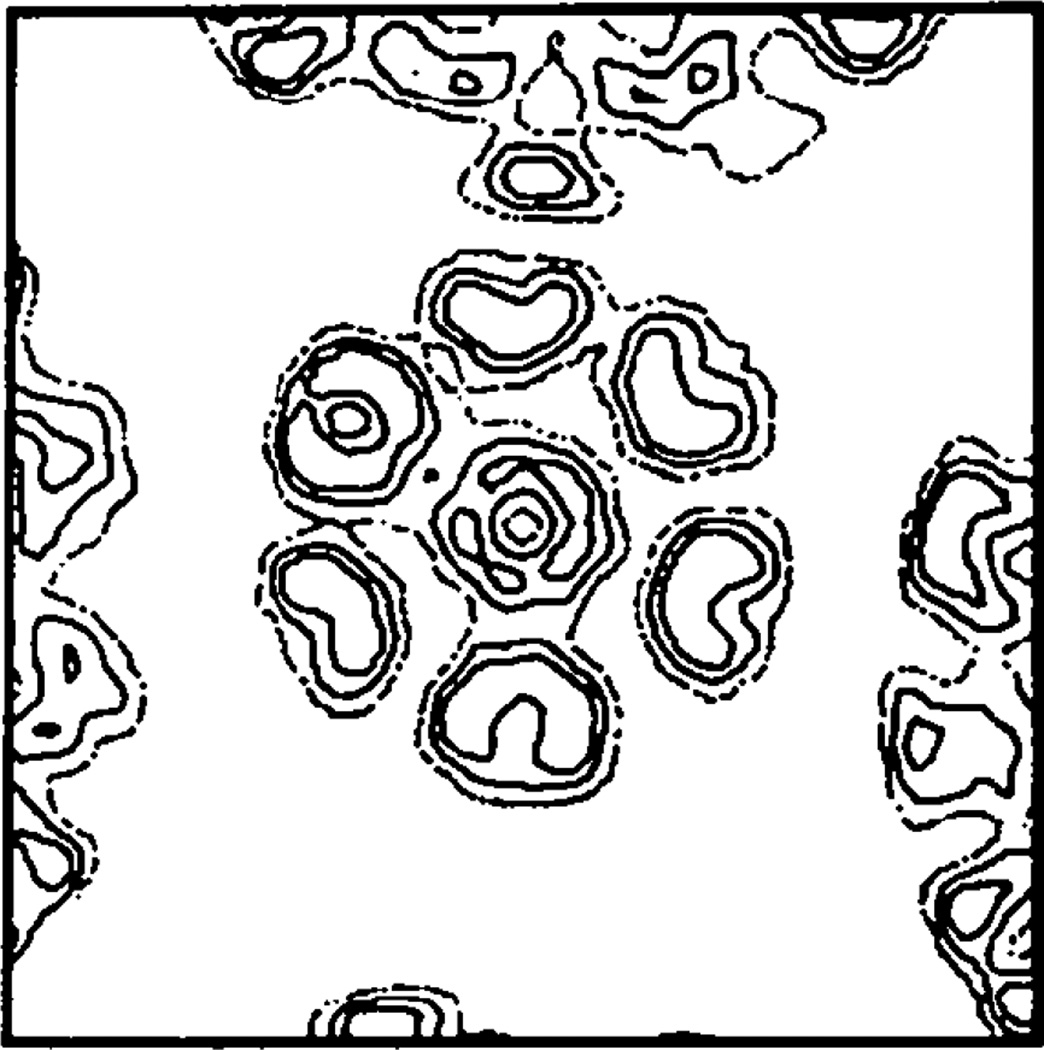
A variety of tests were performed with the observed data to demonstrate that the choice of envelope did not generate the all-pentamer structure observed for the capsid. As also shown by the model calculations described previously (Rayment, 1983) the best envelope was a compromise between maximizing the amount of solvent and containing all the density. The use of a very slack envelope (inner radius 65 Å, outer radius 260 Å) gave slow convergence with the best model phases and failed to converge with phases from the minimum-information model described earlier. In one series of refinements a simple spherical shell extending from a radius of 165 to 247 Å was used as the envelope. This represents the largest nonoverlapping shell that can be placed in the 123 cell; it does, however, truncate the outer 8 Å of the capsomeres. This envelope resulted in a higher R factor between the calculated and observed structure factor amplitudes for refinement at 30 Å resolution. For example, refinement of phases from the reasonable model refined to an R factor of 20% with an r.m.s. phase difference of 43° between these phases and the phases obtained for refinement of the same phases with the normal envelope. After 30 cycles of phase extension and refinement, the final R factor was 25% with an r.m.s. phase difference of 71°. Even though the R factor is higher than that obtained using the normal envelope the pentameric nature of the hexavalent morphological unit is still evident as shown in Fig. 8. The cross section of the virus capsid in Fig. 7(b) shows this spherical envelope superimposed on an unaveraged electron density map which clearly indicates that the density has been truncated.
Fig. 8.
The appearance of the substructure in the hexavalent morphological unit after phase refinement and extension using a spherical envelope 495 Å in diameter.
Weighting schemes
As noted by Bricogne (1976), it is desirable to weight each reflection in the map calculation according to the error in its phase. In this way reflections whose phases are correct will help refine those whose phase error is higher. Thus, the purpose of the weighting scheme is to enable the phases to change more freely and prevent the phase set from being trapped in a local minimum. Throughout the refinement of the model phases against the observed capsid diffraction data, the structure factors used in the map calculations were weighted using the formula w = e − (||Fo| − |Fc||/Fo|), where |Fo| and |Fc| are the observed and calculated structure factor amplitudes. This simple algorithm gave faster convergence than the scheme suggested by Sim (1960). A variety of other simple schemes were tried which all resulted in essentially the same final phase set.
Prior to calculating the weight for each reflection the calculated structure factor amplitudes were scaled to the observed data. Both a linear and an exponential scale factor were applied. The temperature-factor correction was necessary for two reasons. Firstly to correct for the loss of spectral power caused by the linear interpolation (Bricogne, 1976), and secondly because the weighting function itself has the effect of damping the contributions of the higher-resolution data to the original map calculation. This occurs because the phase information from the model is most accurate at low resolution so that the applied weights tend to decrease with increasing resolution.
Discussion
The test refinements on the model data described previously (Rayment, 1983) demonstrated that when a macromolecular aggregate has noncrystallographic symmetry and well defined boundaries it is possible to use the methods of molecular replacement to derive a reliable set of phases. These model calculations showed that a low R factor between the observed and refined amplitudes was consistent with a phase set that was close to the true phase set. From the model calculations it is clear that the refinement and phase-extension methods work. The major questions that remain regarding the validity of the refinement of the polyoma diffraction data concern the quality of the observed data and the extent to which these data embody the noncrystallographic constraints.
The refinement experiments on the polyoma capsid diffraction data described in this paper show that the refined phases are insensitive to the phasing model, and that the observed data are highly consistent with the applied constraints of symmetry averaging and solvent flattening. This is expressed statistically by the low R factors obtained for the phase refinement at 30 Å (∼10%) and subsequent phase extension to 22.5 Å resolution (∼ 14%). These values are consistent with the level of expectation established by the model refinements (Rayment, 1983).
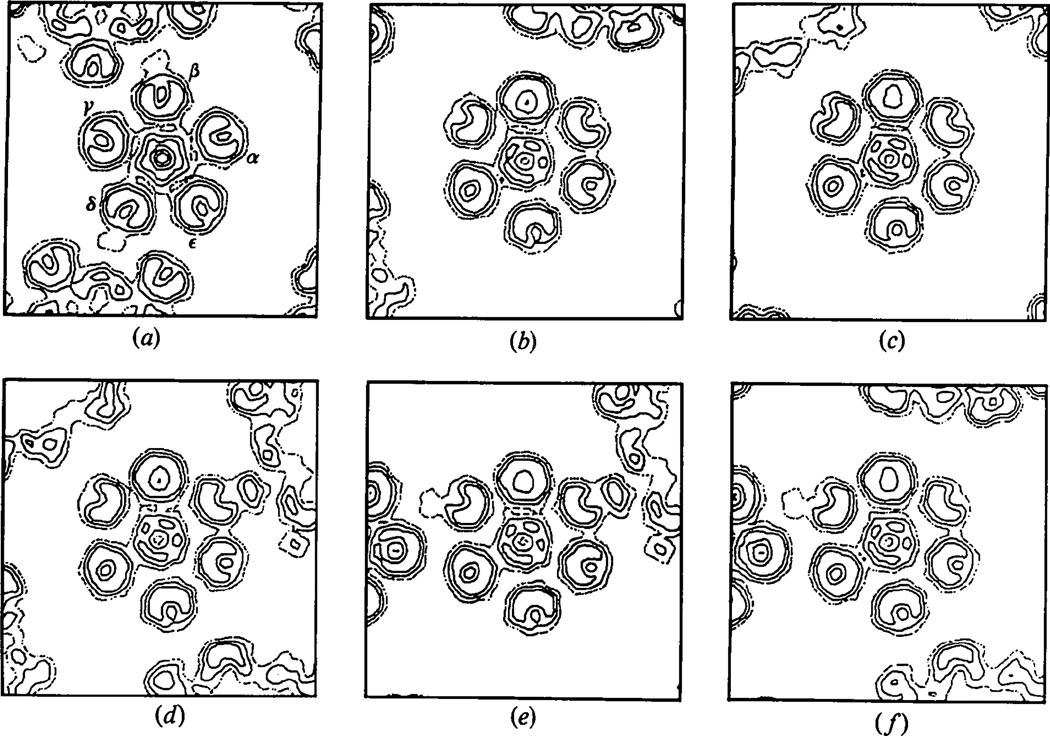
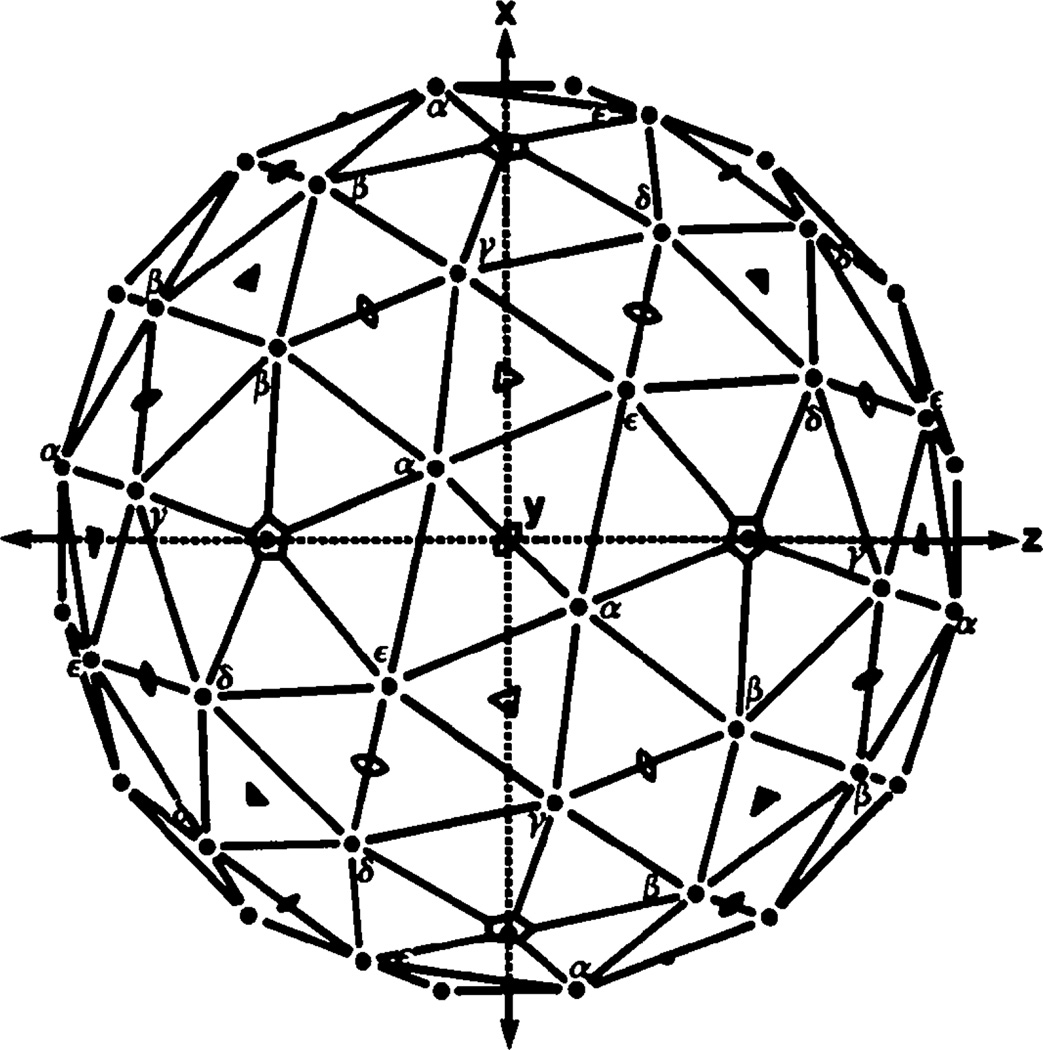
The fidelity of the noncrystallographic fivefold symmetry in the unaveraged electron density map calculated from refined phases is illustrated in Fig. 10 which shows corresponding views sectioned normal to the axes of the five crystallographically independent morphological units. Fig. 9 shows a representation of the T = 7d icosahedral surface lattice in which the crystallographically independent hexavalent units are denoted α, β, γ, δ and ε. Fig. 10(a) shows the view down a noncrystallographic fivefold axis sectioned 215 Å from the center of the particle, in which each of the crystallographically distinct hexavalent units has been classified. In Fig. 10(b)–10(f) the views sectioned normal to the axis of each of the hexavalent units have been oriented with the pentavalent morphological unit (the uppermost unit) in the same position for each view. These figures demonstrate that there are no distinguishable differences in the substructure of the hexavalent unit seen in the five independent views. This again shows that the diffraction data are consistent with the fivefold noncrystallographic symmetry of the icosahedral capsid structure.
Fig. 10.
Sections of the unaveraged (tetrahedrally symmetric) crystal density map displaying the noncrystallographic fivefold symmetry of the icosahedral capsid. All sections are 215 Å from the center of the particle. (a) Section normal to the noncrystallographic fivefold axis of the central particle, with the five hexavalent units around the pentavalent unit labeled as in Fig. 9. Units β and δ contact neighboring particles in the lattice seen at the top and bottom of this section. (b)–(f) Sections normal to the axes of the five crystallographically independent hexavalent units, oriented with the pentavalent unit (adjacent to the central hexavalent unit) at the top of each section. (b) β unit at center. (c) δ unit at center. (d), (e) and (f) α, γ and ε units at centers respectively. The sections through the five crystallographically distinct hexavalent units and the six adjacent capsomeres of the central particle are amost indistinguishable, but the way in which neighboring particles in the crystal are sectioned is different in each view. (In the five views some neighboring particles are sectioned the same way in pairs of sections.)
Fig. 9.
The T = 7d icosahedral surface lattice oriented as in the polyoma capsid cubic crystal lattice. The equivalent crystallographic twofold axes are along the x, y and z directions and the two classes of crystallographic threefold axes are marked by the open and filled triangles. The crystallographic asymmetric unit for the tetrahedral space group 123 consists of one pentavalent unit and five hexavalent units; in the icosahedral point group of the capsid the hexavalent units are, however, all equivalent. (The icosahedral asymmetric is ⅕ of the crystallographic one.) The five hexavalent units that occur in symmetrically different environments in the crystal lattice are marked α,β,γ,δ and ε. The β units in one capsid, adjacent to a crystallographic threefold axis, contact δ units of a neighboring capsid adjacent to the other class of crystallographic threefold axis. The α, γ and ε units, not involved in lattice contacts, are adjacent to and related by the single class of noncrystallographic threefold axis (open triangles located in the planes normal to the crystallographic twofold axes). This diagram provides a guide for the sections of the electron density map displayed in Fig. 10.
Fig. 7(a) shows the envelope used in the refinement superimposed on a section of the unaveraged refined electron density map. This demonstrates that the solvent regions of the refined map contain no spurious features and reflects that the information in the amplitudes is consistent with the constraint of solvent flattening.
Great care was taken when collecting the data to minimize the systematic errors of X-ray absorption, film non-linearity and crystal variation. The success of these efforts is expressed not only in the low scaling R factor (5.7% on intensity) but also in the low R factor between the observed and calculated amplitudes after phase refinement. The unambiguous pentameric substructure observed in the hexavalent unit is an indication of the quality of the data.
These refinement calculations again show the importance of compensating for the unmeasured data. They show that at low resolution it is essential to include calculations for unrecorded data in the refinement calculations. Failure to reconstruct the unmeasured data leads to a high R factor and confusing electron density maps.
All of the refinement experiments result in a final electron density map that shows pentameric substructure in all 72 capsomeres on the surface of the capsid. Attempts to impose local sixfold symmetry on the hexavalent unit resulted in a total loss of substructure in the hexavalent capsomeres. Upon removing the local sixfold symmetry the pentameric substructure rapidly returns to the hexavalent morphological unit. This is another demonstration that the pentameric substructure of the morphological units arises from information in the observed amplitudes and is not a result of the refinement procedure.
Conclusion
The structure determination of polyoma virus capsid at low resolution demonstrates the versatility of the molecular-replacement method. It is unlikely that the all-pentameric nature of the virus capsid could have been derived with confidence by any other approach available at this time. The refinement experiments described here show the necessity of compensating for the unmeasured data but, perhaps more significantly, the importance of the quality of the observed data.
The refinement calculations using phases from widely different starting models show the range of convergence for the refinement method and that the refined phases are determined by the observed data. This study establishes that reliable structural information can be obtained by careful use of model building and molecular replacement at low resolution.
Acknowledgments
We thank Drs W. T. Murakami, G. N. Phillips Jr, J. P. Fillers, D. J. DeRosier and W. C. Phillips for helpful discussions and technical assistance, J. DeRoy for X-ray-unit maintenance, C. Ingersoll for instrument design and modification, and the staff of the Brandeis University Computer Center for assistance with the refinement calculations on the Brandeis University PDP-10 computer. The molecular-replacement programs, together with many useful suggestions, were provided by Dr J. E. Johnson (Purdue University). The film-processing and image-display instrumentation linked to the PDP-11/40 were provided by NSF grant PCM79-22766. TSB was a Charles A. King Trust Research Fellow. This work was supported by a Young Investigators Research Grant CA27260 to IR and NCI Grant CA15468 to DLDC.
Footnotes
Sructure factors have been deposited with the Protein Data Bank, Brookhaven National Laboratory (Reference: R1VP1SF), and may be obtained in machine-readable form from the Protein Data Bank at Brookhaven or one of the affiliated centers at Cambridge, Melbourne or Osaka. The data have also been deposited with the British Library Lending Division as Supplementary Publication No. SUP 37010 (1 microfiche). Free copies may be obtained through The Executive Secretary, International Union of Crystallography, 5 Abbey Square, Chester CH1 2HU, England. At the request of the authors, the list of structure factors will remain privileged until 1 August 1987.
References
- Adolph KW, Caspar DLD, Hollingshead CJ, Lattman EE, Phillips WC. Science. 1979;203:1117–1119. doi: 10.1126/science.218286. [DOI] [PubMed] [Google Scholar]
- Bricogne G. Acta Cryst. 1976;A32:832–847. [Google Scholar]
- Caspar DLD, Klug A. Cold Spring Harbor Symp. Quant. Biol. 1962;27:1–24. doi: 10.1101/sqb.1962.027.001.005. [DOI] [PubMed] [Google Scholar]
- Finch JT. J. Gen. Virol. 1974;24:359–364. doi: 10.1099/0022-1317-24-2-359. [DOI] [PubMed] [Google Scholar]
- Hamilton WC, Rollett JS, Sparks RA. Acta Cryst. 1965;18:129–130. [Google Scholar]
- Harrison SC. J. Appl. Cryst. 1968;1:84–90. [Google Scholar]
- Harrison SC, Jack A. J. Mol. Biol. 1975;97:173–191. doi: 10.1016/s0022-2836(75)80033-7. [DOI] [PubMed] [Google Scholar]
- Harrison SC, Olson AJ, Schutt CE, Winkler FK, Bricogne G. Nature (London) 1978;276:368–373. doi: 10.1038/276368a0. [DOI] [PubMed] [Google Scholar]
- Johnson JE, Akimoto T, Suck D, Rayment I, Rossmann MG. Virology. 1976;75:394–400. doi: 10.1016/0042-6822(76)90038-6. [DOI] [PubMed] [Google Scholar]
- Klug A. J. Mol. Biol. 1965;11:424–431. doi: 10.1016/s0022-2836(65)80067-5. [DOI] [PubMed] [Google Scholar]
- Murakami WT. Science. 1963;142:56–57. doi: 10.1126/science.142.3588.56. [DOI] [PubMed] [Google Scholar]
- Phillips WC, Phillips GN., Jr In preparation. 1983 [Google Scholar]
- Phillips WC, Rayment I. J. Appl. Cryst. 1982;15:577. [Google Scholar]
- Rayment I. Acta Cryst. 1983;A39:102–116. [Google Scholar]
- Rayment I, Baker TS, Caspar DLD, Murakami WT. Nature (London) 1982;295:110–115. doi: 10.1038/295110a0. [DOI] [PMC free article] [PubMed] [Google Scholar]
- Rayment I, Johnson JE, Suck D. J. Appl. Cryst. 1977;10:365. [Google Scholar]
- Sim GA. Acta Cryst. 1960;12:813–815. [Google Scholar]
- Weissman L, Stauffacher C. Acta Cryst. 1983 Submitted. [Google Scholar]
- Wildy P, Stoker MGP, Macpherson IA, Horne RW. Virology. 1960;11:444–457. [Google Scholar]


