Abstract
Objective
Chemokine (C-X-C motif) receptor 3 (CXCR3) is a chemokine receptor involved in the regulation of immune cell trafficking and activation. Increased CXCR3 expression in the visceral adipose of obese humans and mice was observed. A pathophysiologic role for CXCR3 in diet-induced obesity (DIO) was hypothesized.
Methods
Wild-type (WT) C57B/L6J and chemokine receptor 3 knockout (CXCR3−/−) mice were fed a high-fat diet (HFD) for 20 weeks followed by assessment of glucose metabolism and visceral adipose tissue (VAT) inflammation.
Results
CXCR3−/− mice exhibited lower fasting glucose and improved glucose tolerance compared with WT-HFD mice, despite similar body mass. HFD-induced VAT innate and adaptive immune cell infiltration, including immature myeloid cells (CD11b+ F4/80lo Ly6C+), were markedly ameliorated in CXCR3−/− mice. In vitro IBIDI and in vivo migration assays demonstrated no CXCR3-mediated effect on macrophage or monocyte migration, respectively. CXCR3−/− macrophages, however, had a blunted response to interferon-γ, a TH1 cytokine that induces macrophage activation.
Conclusions
A previously unreported role for CXCR3 in the development of HFD-induced insulin resistance (IR) and VAT macrophage infiltration in mice was demonstrated. Our results support pharmaceutical targeting of the CXCR3 receptor as a potential treatment for obesity/IR.
Introduction
The role of visceral adipose inflammation in the development of insulin resistance (IR) in obesity is well-reported and is typified by dramatic increases in both adaptive and innate immune cell populations in mice and humans (1–5). Defining the contribution and interaction of resident visceral adipose tissue (VAT) T cells and macrophages and how these may play a role in IR is a topic of intense interest. T-cell infiltration is believed to represent a primary and early event in the initiation of adipose tissue inflammation and development of IR (3–5). Both CD4+ TH1 cells and CD8+ T cells play a sentinel role (4,5), while loss of regulatory (Treg) cells in the VAT is also believed to represent an equally important pathophysiologic change allowing for T-cell-mediated macrophage activation and recruitment (6). Chemokine receptor expression contributes to the preferential trafficking of various monocyte subsets to tissues under physiological and pathological conditions. CCR2- and CCR5-dependent trafficking of inflammatory monocytes to VAT is well described, with a loss of the receptor or corresponding cognate ligand, resulting in variable improvement in obesity and IR (7,8). The chemokine receptor, CXCR3, is highly expressed in T cells and is necessary for TH1 CD4+ and CD8+ effector cell maturation and activation in response to various triggers (9,10). CXCR3 has been shown to play an important role in regional amplification of T-cell mediated and innate immune inflammation through binding to its ligands, CXCL9, CXCL10, and CXCL11 (11). CXCR3 is also expressed by monocytes/macrophages and may play a role in macrophage activation (12,13) and in conditions such as arterial remodeling (14). In this article, we demonstrate a previously unreported role for CXCR3 in diet-induced obesity (DIO) and IR and demonstrate that its deficiency results in marked attenuation of macrophage activation in VAT despite preserved T-cell infiltration.
Methods
Ethical Approvals
This study and its procedures were approved by the Committees on Use and Care of Animals and the Human Institutional Review Board (IRB; protocol 2008H0177) of the Ohio State University. Informed consent was obtained in writing.
Human Participants
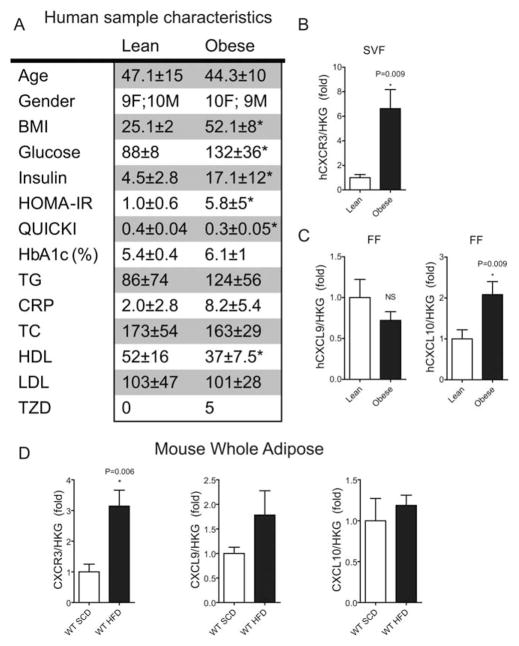
The study recruited and obtained visceral adipose samples from lean (BMI < 30) and obese (BMI ≥ 30) surgical patients. Samples were obtained from the greater omentum during endoscopic repair of hernias from lean subjects and during the performance of bariatric surgery (gastric bypass) in obese. Additional information is provided in Figure 1A.
FIGURE 1.
CXCR3 expression in human and mouse adipose. (A) Table 1. Human sample characteristics: All values are mean ± SEM where applicable; * P < 0.05 via student t-test; CRP (c-reactive protein), glucose, and lipid panel constituents are in mg/dl; Insulin is μIU/ml; TZD, count of patients using thiazolidinedione drugs; TC, total cholesterol. (B) CXCR3 gene expression using real-time PCR in the stromal vascular fraction (SVF) of human adipose tissue from Table 1. (C) CXCL9 and CXCL10 gene expression using real-time PCR in the FF from human adipose tissue from Table 1. (D) Mouse CXCR3, CXCL9, CXCL10 gene expression in whole adipose tissue of C57BL/6J mice fed a standard chow diet (SCD) and HFD as measured using real-time PCR.
Animals
B6.129P2-Cxcr3tm1Dgen/J (chemokine receptor 3 knockout (KO); CXCR3−/−; JAX 005796) mice were bred in-house from stock obtained from The Jackson Laboratory. Age-matched, male wild type (WT) C57B/L6J (JAX 000664) mice served as controls. Mice were randomized to a standard chow (SCD) or a HFD (60% energy from fat, Research Diets D12492) for 20 weeks (N = 12 mice/diet group) on a 12/12 hours day/night schedule; continued in supplement.
Human and Mouse Adipose Tissue Processing
After excision, epididymal adipose was weighed, rinsed in PBS, minced, and digested with collagenase type II from Clostridium histolyticum (1 mg/ml) at 37°C, 140 rpm as detailed previously (6); continued in supplement.
Flow Staining and Cytometry
Cells were stained according to manufacturer’s instructions. Briefly, a titrated amount of antibody (based on manufacturer’s suggestion and preliminary testing) was used per million cells followed by incubation at 4°C for 30 minutes. Cells were subsequently washed with flow buffer. Samples were resuspended in 0.1% paraformaldehyde and stored for analysis. Flow cytometry was performed on a BD FACS LSR IITM flow cytometer, Becton Dickinson, San Jose, CA, on the same day. Data were analyzed using BD FACS Diva software (Becton Dickinson). All antibodies were purchased from Biolegend (San Diego, CA) or BDbioscience (San Jose, CA).
IBIDI® Migration Assay
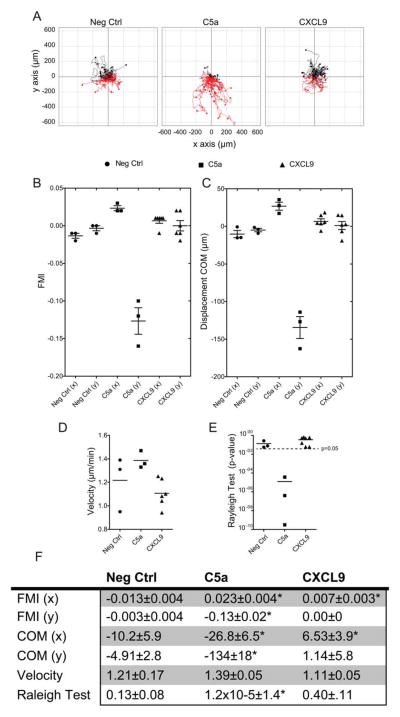
IBIDI® chemotaxis assays were performed with mature mBMM according to manufacturer’s directions (see supplement). Cell migration was manually tracked for 40 cells per experiment (145 images/cell/experiment) and measured using the “Chemotaxis and Migration Tool” plugin for ImageJ software (15). This tool was used to plot cell trajectory (Figure 6A) and calculate center of mass (COM) and forward migration indices in x and y directions to the gradient, velocity, and the Rayleigh test (RT; Figure 6B-E) (15). Zengel et al. (15) developed the ImageJ plugin; all calculations as well as chamber design and gradient details are published.
FIGURE 6.
Macrophages do not chemotax to the CXCR3 ligand, CXCL9. (A) Representative mBMM cell trajectory plots based on migration tracking of mBMMs in IBIDI® chamber slides. Groups include negative control (Neg Ctrl), positive control, complement component C5a (C5a), and the cytokine CXCL9 (CXCL9) over a 12-hour period. The y-axis is migration parallel to the gradient in μm. The x-axis is migration perpendicular to the gradient (μm). (B–E) Analysis of migration parameters. Each symbol represents a data point from the analysis of a single 12-hour migration. Sample size: Neg Ctrl & C5a n = 3; CXCL9 n = 6. (B) FMI = forward migration indices represented in x and y directions. See Methods for calculations. (C) Displacement COM = the displacement of COM shown from the same experiment as B. As in FMI, only the displacement in the y direction is significantly different than 0. (D) Average cell velocity of mBMMs. (E) RT P-values for homogeneity of cell distribution. The broken line represents the 0.05 significance threshold, indicating inhomogeneous (non-circular) cell distribution. (F) Table of migration data, *Indicates P < 0.05. [Color figure can be viewed in the online issue, which is available at wileyonlinelibrary.com.]
Data Analysis
All data are expressed as mean ± SEM unless otherwise specified. Graphpad Prism software (Version 5) was used for statistical analysis using the student’s t-test or one-way ANOVA followed by Bone-ferroni’s post hoc test where appropriate. A P-value of <0.05 was considered statistically significant. * indicates comparison to SCD control of the same genotype; # indicates comparison of WT-HFD vs CXCR3−/−-HFD unless otherwise noted in the figure legend.
Results
The CXC Pathway Is Upregulated in Human and Mouse Obesity
Samples from obese patients (BMI 52.1 ± 8) of both sexes with significantly elevated fasting glucose and insulin measures (n = 19) were selected. Lean patients (BMI 25.1 ± 2) who best matched age and gender specifics of the obese group were selected as controls (n = 19) (see Figure 1A). Approximately 25% of the obese group was being treated with thiazolidinedione drugs.
The SVF contains immune cells present in the human omental tissue, including T cells and macrophages. cDNA from SVF RNA was assayed for CXCR3 gene expression. Relative CXCR3 gene expression was significantly increased 6.6 ± 1.6-fold in the obese group compared with the lean group (Figure 1B). CXCR3 ligands CXCL9 and CXCL10 were ~2-fold higher in the SVF of obese patients with a P-value of 0.08 (data not shown). In the fat fraction (FF), CXCL10 was found to be 2.1 ± .3-fold higher (P = 0.009), while CXCL9 remained unchanged (Figure 1C). Relative levels of CXCR3 expression were ~3-fold higher in the whole epididymal adipose of obese mice compared with lean mice; however, ligands were not significantly different (Figure 1D). Interestingly, this trend was inverted in the liver with CXCR3 levels similar in obese and lean mice, while CXCL9 and CXCL10 levels were ~3-fold higher (data not shown). These findings led us to hypothesize that CXCR3 and its ligands play an important role in immune-mediated inflammation in the visceral adipose. We pursued this hypothesis in a CXCR3-null mouse model of DIO.
CXCR3−/− Improves IR and Post-Prandial Glucose Response in DIO
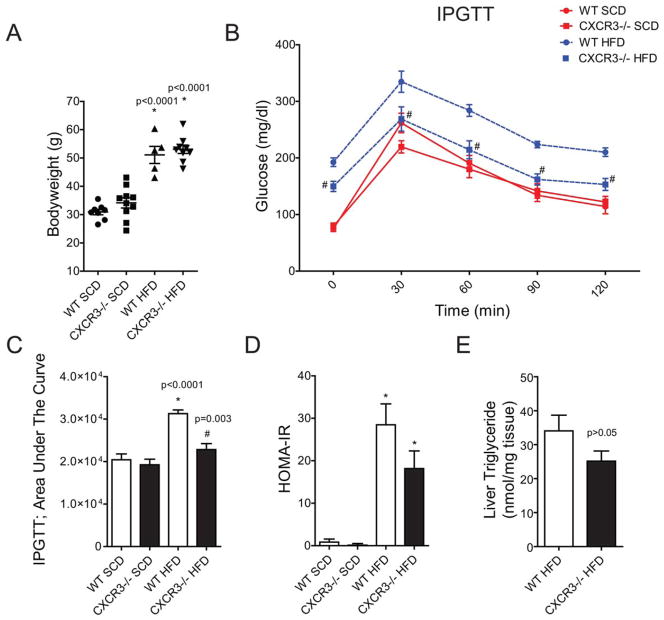
CXCR3−/− and WT mice fed a HFD had significantly (P < 0.001) higher body weight than the respective SCD controls (Figure 2A). WT-HFD and CXCR3−/−-HFD mice had comparable body weights during the study. CXCR3−/−-HFD mice exhibited improved fasting and post-bolus glucose clearance compared with the WT-HFD group at all time points (Figure 2B) of the IPGTT. IPGTT response in the CXCR3−/−-HFD group was comparable to CXCR3−/−-SCD at all time points, with the exception of higher fasting glucose at time 0. When compared with WT-SCD, IPGTT responses in CXCR3−/−-SCD animals were significantly higher at 0 m (P < 0.0001) and 120 minutes (P = 0.04). Area under the curve (AUC) measurements showed a significant increase in WT-HFD compared with the SCD groups as well as the CXCR3−/−-HFD group (Figure 2C). Homeostatic model assessment-estimated IR (HOMA-IR) calculations (Figure 2D) for WT and CXCR3−/− HFD mice were not statistically different, though the KO mice had a lower mean value. The average triglyceride (TG) concentration was 34 ± 5 nmol/mg in WT HFD liver and 25 ± 3 nmol/mg in CXCR3−/− HFD liver; the difference was not statistically significant (Figure 2E, P = 0.1).
FIGURE 2.
Loss of CXCR3 partially protects systemic glucose control in obesity. (A) Body weights at time of sacrifice. (B). Intraperitoneal glucose tolerance test (IPGTT) results after long-term HFD or SCD. WT mice are represented by a circle (●). CXCR3−/− mice are represented by a square (■). Diet is color and line coded: SCD is a red, solid line; HFD is a blue, broken line. Zero minutes represent plasma glucose after a 16-hour fast. (C) AUC was calculated for the IPGTT data using Graphpad Prism 5. (D) Homeostatic model assessment-estimated insulin resistance (HOMA-IR) calculations based on fasting glucose and insulin measures in mice at time of sacrifice. Values are mean ± SEM. *Indicates comparison to SCD control of the same genotype. #Indicates comparison of WT-HFD vs CXCR3−/−-HFD. (E) Liver triglyceride measures in WT and CXCR3−/− HFD mice at experiment end. [Color figure can be viewed in the online issue, which is available at wileyonlinelibrary.com.]
VAT Macrophage Response to HFD Is Dramatically Decreased in CXCR3−/− Mice
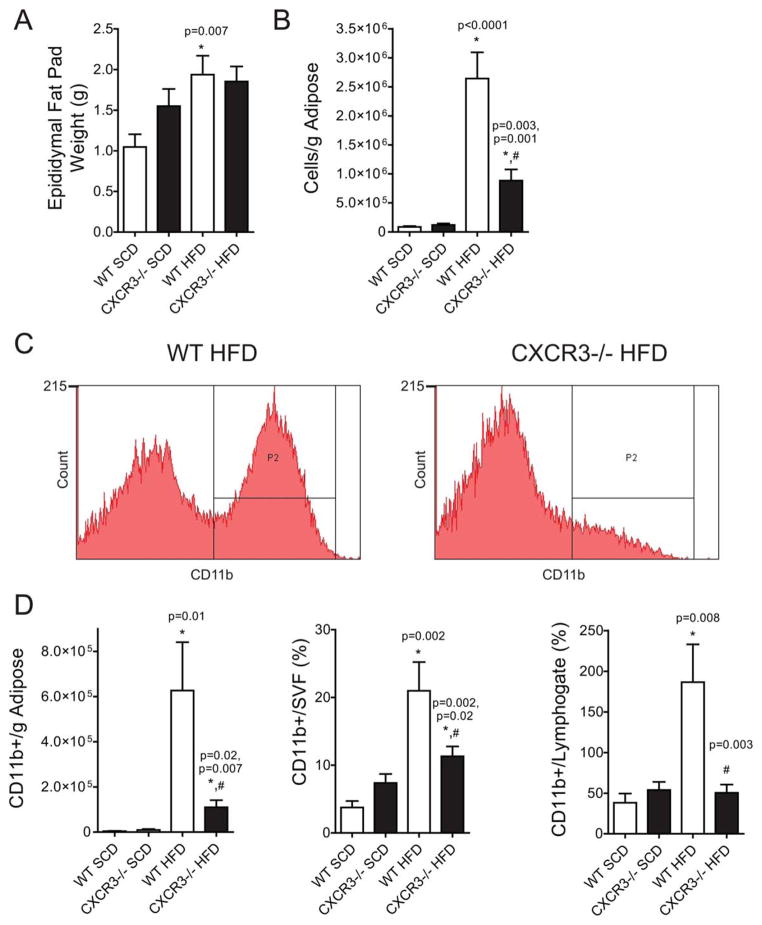
Antigen-presenting cells such as dendritic cells and macrophages are well known to accumulate in the VAT in obesity, where they potentiate both innate and adaptive inflammation via feed–forward interactions. WT-HFD mice had significantly more epididymal fat by mass (1.93 ± 0.23 g, P = 0.007) than WT-SCD (1.0 ± 0.15 g) (Figure 3A). Interestingly, CXCR3−/−-HFD (1.85 ± 0.18 g) mice did not exhibit a significant increase in epididymal fat mass compared with CXCR3−/−-SCD (1.55 ± 0.21 g). The cellularity of VAT, quantified as total non-RBC cell yield per gram of adipose, revealed a 75% reduction in cellular content in the CXCR3−/−-HFD compared with WT-HFD (0.88 × 10⁶± 0.19 vs. 2.6 × 10⁶± 0.45 cells/g in CXCR3−/−-HFD and WT-HFD respectively, P = 0.001) (Figure 3B). Analysis of innate immune population revealed a diminution in CD11b+ cells in the CXCR3−/− mice compared with the WT-HFD. Figure 3C contains representative flow plots for CD11b+ population in the SVF of WT and CXCR3−/−-HFD mice. Figure 3D represents CD11b+ cells normalized in three ways: per gram of adipose, as a percent of live single cells in the SVF (CD11b+/SVF), and as a percent of T cells (CD11b+/lym-phogate) in the SVF. CXCR3−/−-HFD mice demonstrated a substantial decrease in absolute numbers of CD11b+ cells compared with WT-HFD, regardless of the normalization method. There was no significant difference between SCD mice in any CD11b measure; importantly, the CD11b+ cell to lymphogate ratio was not different when comparing CXCR3−/− and WT-SCD mice. In contrast, the CD11b+ to T-cell ratio in WT-HFD mice increased ~5-fold compared with WT-SCD (Figure 3D). Histology of the epididymal adipose confirmed the flow cytometric data, showing a dramatic decrease in crown-like structures in CXCR3−/−-HFD mice compared with WT. Adipose of CXCR3−/−-HFD mice exhibited adipocyte hypertrophy expected with obesity, but lacked evidence of abundant macrophage infiltration or adipocyte necrosis.
FIGURE 3.
VAT macrophage-response to HFD is dramatically decreased in CXCR3−/− mice. (A) Epididymal fat pad weights of killed mice used in flow cytometry experiments. (B) Approximate leukocyte cell count per gram of epididymal adipose (A) after tissue dissociation. (C) Representative flow cytometry figures of CD11b+ cells in the epididymal adipose. y-Axis represents cell count; x-axis represents fluorescent intensity. (D) Compiled and analyzed flow cytometric data expressed in bar graphs. Content expressed as quantity per gram of adipose or as percent of a larger gate. “Lymphogate” are those cells identified as T cells. [Color figure can be viewed in the online issue, which is available at wileyonlinelibrary.com.]
Increased Activation of Immature Myeloid Cells and Mature Macrophages in Obesity Mitigation in Obese CXCR3−/− Mice
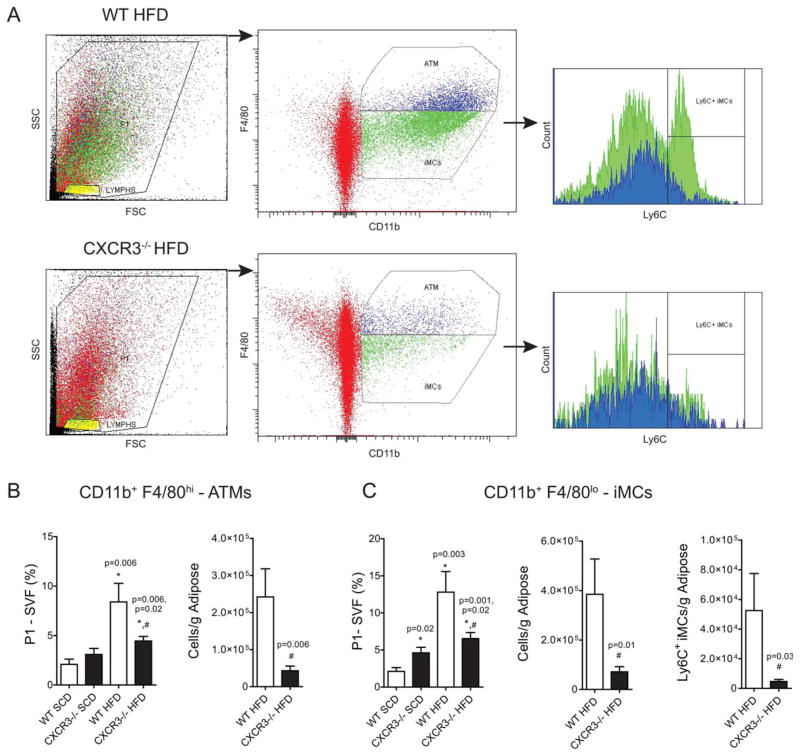
It has been reported that the VAT myeloid population in murine obesity comprises both immature myeloid cells (iMCs) and mature VAT macrophages (16,17). We found that mature VATM (CD11b+ F4/80hi, blue) and iMCs (CD11b+ F4/80lo, green) increased in all HFD mice compared with SCD controls (Figure 4). However, CXCR3−/−-HFD mice had substantially lower VATM and iMCs (Figure 4) than WT-HFD mice independent of normalization (% SVF; per gram adipose). iMCs had significantly higher Ly6C expression, a marker of monocyte activation in the WT-HFD mice, but were barely detectible in obese CXCR3−/−-HFD mice. iMCs and VATMs were still higher in CXCR3−/−-HFD mice compared with SCD mice, but were significantly lower than WT-HFD levels suggesting a non-exclusive role for CXCR3−/− in these changes. CD11c, a type 1 marker of macrophage classical activation (18), is often present on macrophages that cluster around dead adipocytes and produce pro-inflammatory cytokines. CD11c was similarly reduced in CXCR3−/−-HFD compared with WT-HFD mice and mirrored the findings (data not shown).
FIGURE 4.
Increased activation of immature myeloid cells and mature macrophages in obesity, mitigation in obese CXCR3−/− mice. (A) Representative flow cytometry figures depicting gating strategy for identification of VAT macrophages (ATMs) and immature myeloid cells (iMCs). Live cells (SVF) were gated for CD11b positivity and intensity of F4/80 expression (blue—hi; green—lo). Ly6C expression was then measured for each population, CD11b+F4/80hi (blue) and CD11b+F4/80lo (green) cells. Red indicates CD11b negative cells. (B) Mature visceral adipose tissue macrophage (ATM) quantification—CD11b+F4/80hi. Compiled and analyzed flow cytometric data expressed as quantity per gram of adipose or as percent of live cells/SVF. (C). Immature myeloid cells (iMCs)—CD11b+F4/80lo cell quantification; Ly6C+ expression on iMCs from WT and CXCR−/− mice on a HFD. [Color figure can be viewed in the online issue, which is available at wileyonlinelibrary.com.]
Loss of CXCR3 Enhances VAT T-Cell Content in Lean and Obese Mice
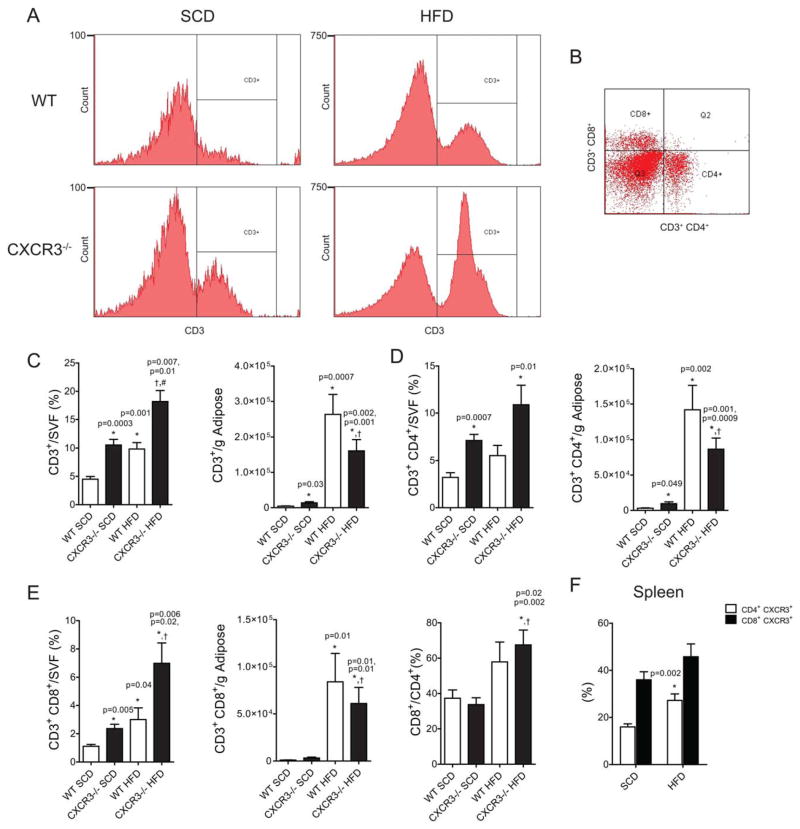
Increased VAT T-cell content is a pathophysiologic hallmark of DIO-IR (3–5). VAT T-cell populations as analyzed using flow cytometry in this study are represented in Figure 5A and B. CD3+ T cells were 4.5 ± 0.47 percent of the SVF in WT-SCD mice, with an approximate doubling to 9.8 ± 1.1% with HFD. Remarkably, in lean CXCR3−/− mice, 10.6 ± 1.0% of the SVF comprises T cells, increasing to 18.2 ± 2.0 % with HFD (Figure 5C). When these values are expressed per gram of adipose, there was still a significantly higher CD3+ cell content in lean CXCR3−/− mice compared with WT. Figure 5B contains CD4+ and CD8+ separation of CD3+ T cells. CXCR3−/−-HFD mice had fewer T cells (CD4+, CD8+) per gram than WT-HFD mice (Figure 5C-E). CD4+ cells were more abundant in the lean and obese states in both models. However, the CD8+ to CD4+ ratio increased with HFD in both models, indicating a stronger effect of obesity on the efflux/proliferation/differentiation of CD8+ cells compared with CD4+ (Figure 5E). CXCR3 surface expression significantly (P < 0.002) increased on CD4+ cells with HFD feeding (16 ± 1% WT-SCD vs. 27 ± 3% WT-HFD; Figure 5F).
FIGURE 5.
Loss of CXCR3 enhances VAT T-cell content in lean and obese mice. (A) Representative flow cytometry histograms of CD3+ cell detection in the SVF of the epididymal adipose after tissue dissociation. (B) Separation of CD3+ cells by CD4 or CD8 positivity, representative dot plot. (C) CD3+ flow data expressed as percent of live cells/SVF from the adipose after dissociation or as a quantity per gram of adipose. (D) CD3+CD4+ flow data from the SVF. (E) CD3+CD8+ flow data from the SVF. (F) Splenic CD4 and CD8 cell expression of CXCR3, expressed as a percent of total CD4+ or CD8+ cells, respectively). [Color figure can be viewed in the online issue, which is available at wileyonlinelibrary.com.]
Chemotactic Responses in Macrophages to the CXCR3 Ligand, CXCL9
Infiltrating, inflammatory VAT macrophages originate from the bone marrow, entering the peripheral blood before homing to inflamed or infected tissues (19,20). The CXCR3 ligands present in C57B/L6J, CXCL9/MIG, and CXCL10/IP10 mice are classically defined as T-cell attractants; however, there is evidence for the role for CXCR3 in myeloid cell chemotaxis (14). In order to study this aspect, we assessed macrophage chemotactic response to CXCL9. Chemotaxis of fully mature C57B/L6J BMMs expressing CXCR3 (as measured by real-time expression) was tested in three conditions (Figure 6A). The “Neg Ctrl” group lacked ligand. C5a was used as a positive control (n = 3). CXCL9 was our cognate CXCR3 ligand (n = 6). When possible, C5a was tested in the experiment prior to CXCL9 in order to ensure chemotactic viability of cell batch used. Three separate mBMM isolations/batches were used providing consistent data. The forward migration index (FMI) expresses the efficiency of forward migration of cell in relationship to the gradient (x = parallel, y = perpendicular; Figure 6B). C5a and CXCL9 exhibited a significant FMI value on the x-axis compared to Neg Ctrl, while C5a was the only group to show significant FMI on the y-axis (Figure 6B and F). Similar results were found for the displacement of COM (Figure 6C and F). Chemotactic velocity was not significantly different between groups (Figure 6D). The RT determines the statistical significance of the uniformity of a circular distribution of points. If RT < 0.05, one can conclude that the migration pattern is not circular. Cells travelling along a chemotactic gradient will not have a circular pattern. The C5a group yielded a value of 1.2 × 10⁻⁵, the only group with RT values <0.05 (Figure 6E). IBIDI assays clearly showed that WT-BMMs do not migrate toward a CXCR3 ligand.
In Vivo Monocyte Migration to the VAT of Obese ob/ob Mice
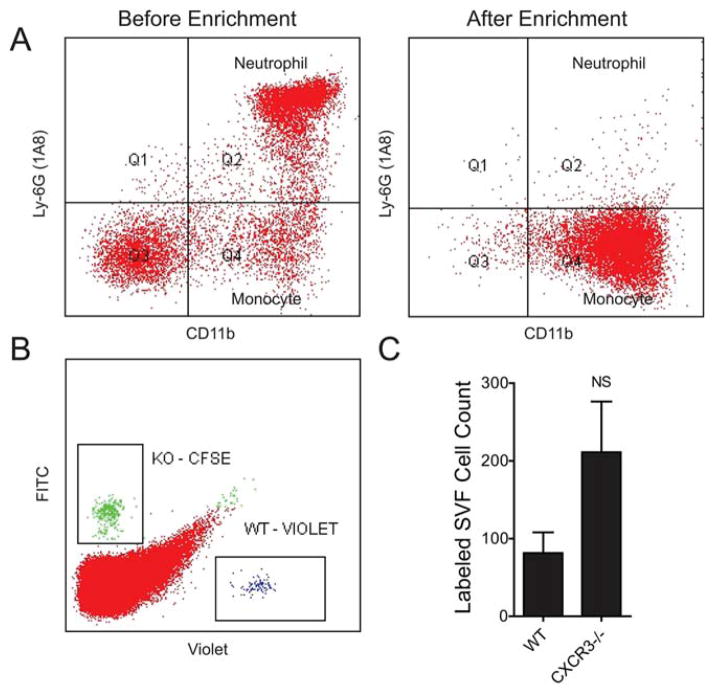
To more definitively examine the effect of CXCR3 ablation on monocyte migration to inflamed VAT, we co-injected negatively selected WT and KO mouse monocytes (Figure 7A) at a 1-1 ratio and collected the VAT after 48 hours. The SVF was isolated and analyzed using flow cytometry to measure the abundance of WT-Violet and KO-CFSE-labeled donor monocytes (Figure 7B). We found 84 ± 32 WT and 211 ± 80 CXCR3−/− monocytes (Figure 7C). The WT to KO ratio within each mouse was consistent at 0.38 ± 0.02, with more CXCR3−/− monocytes ending up in the visceral adipose of mice with advanced obesity than WT. This provides additional evidence that lack of CXCR3 in monocytes does not preclude their migration to the visceral adipose. It is possible that chemokine receptors other than CXCR3 are more than capable of overcoming migratory defect(s) related to CXCR3−/−. In light of any direct evidence of impaired homing, impaired differentiation and defective inflammatory potential of CXCR3−/− macrophages could serve as alternate explanations for reduced adipose inflammation.
FIGURE 7.
CXCR3-deficient monocytes home to inflamed VAT. (A) Representative monocyte enrichment from mouse bone marrow. Ly6G+ neutrophils are effectively removed after enrichment. (B) Representative flow of SVF cells from ob/ob mice 48 hours after injection of labeled WT and KO monocytes (C) Quantification and statistical analysis of labeled cells isolated from the SVF of ob/ob recipient mice from B. [Color figure can be viewed in the online issue, which is available at wileyonlinelibrary.com.]
Macrophages Lacking CXCR3 Have a Disrupted IL-12/IFN-γ/NO Axis
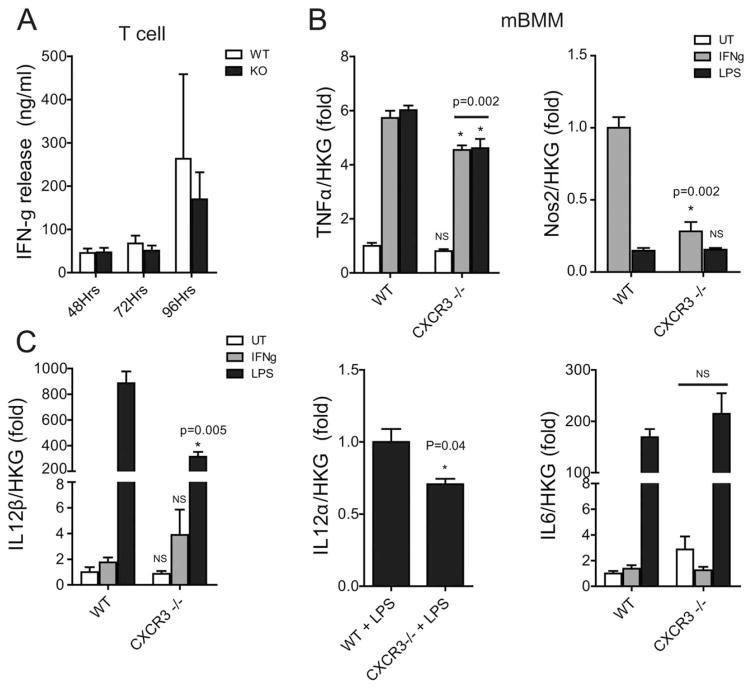
The IL-12/IFN-γ/NO Axis plays an important role in macrophage–T-cell interaction (21). T-cell receptor (TCR) ligation/activation in T cells results in the production and release of IFN-γ. IFN-γ serves to prime/activate macrophages in a dose-dependent manner. We show that T cells from CXCR3−/− mice produce the same amount of IFN-γ following in vitro TCR-ligation by anti-CD3+ antibody as WT T cells (Figure 8A). Macrophages exposed to IFN-γ results in a dramatic induction of Nos2 and TNFα expression. Nos2 expression was undetectable using real-time PCR in unstimulated (UT) WT and CXCR3−/− BMMs (Figure 8B). LPS treatment resulted in a similar Nos2 induction in WT and CXCR3−/− BMMs. IFN-γ treatment resulted in a dramatically blunted Nos2 response in CXCR3−/− (0.28 ± 0.07) BMMs compared to WT treated with IFN-γ (1.0 ± 0.08, P = 0.002). We also show that CXCR3−/− BMMs have a statistically significant blunting in TNFα production in response to IFN-γ and LPS stimulation.
FIGURE 8.
Macrophages lacking CXCR3 have a disrupted IL-12/IFN-γ/NO axis. (A) ELISA measurement of interferon-γ release from splenic T cells isolated from WT and CXCR3−/− mice and cultured in the presence of anti-CD3 antibody stimulation for 48, 72, and 96 hours. (B) Relative gene expression in WT and CXCR3−/− mouse bone marrow-derived macrophages (mBMM): White bars indicate untreated/unstimulated (UT) macrophages, gray bars indicate IFN-γ, and black bars indicate LPS stimulation. Gene expression is relative to average house keeping gene (HKG) expression. All real-time values are expressed as a fold change. TNFα is normalized to untreated (UT) WT cells. Nos2 is normalized to WT-IFN-γ treated cells, as Nos2 is not expressed in UT cells. IL-12β is normalized to WT-UT. IL-12α is normalized to WT-LPS. IL6 is normalized to WT-UT. *Indicates comparison to WT with same treatment.
One mechanism by which macrophages stimulate development of TH1 subsets of helper T cells is by IL-12 production (22,23). IL-12 production is recognized as an important indicator of a macrophage’s ability to regulate T-cell responses and T-cell production of IFN-γ (24). IL-12 has two gene transcripts: IL-12α (α-chain) and IL-12β (β-chain). WT-LPS-stimulated BMMs exhibited an approximate 3-fold greater IL-12β response compared with CXCR3−/−-LPS (P= 0.005). The IL-12α response to LPS stimulation was also blunted in CXCR3−/− BMM but to a much lesser degree. IL-12α was undetectable in UT- and IFN-γ-stimulated cells from both genotypes, thus expression was normalized to WT-LPS expression. IL6 levels also serve as an LPS dose control between groups.
Discussion
This study provides a previously unrecognized role for CXCR3 in IR in human and murine obesity and IR. Increased CXCR3 pathway expression in human adipose suggests increased immune cell activation in obesity and may represent a pathway that regulates VAT inflammation. Mice lacking the CXCR3 receptor despite comparable body weight maintained a near-normal glucose clearance, improved fasting glucose levels, and reduced monocytic VAT infiltration and macrophage inflammation. Taken together, these findings suggest that the CXCR3 pathway plays an important role in VAT inflammatory process and interventions that target CXCR3 activation in humans may be of therapeutic promise.
Macrophage and T-cell-mediated inflammation of the VAT and its role in the development of IR in obese rodents has been well described (1,5,8). Studies of human omental fat from obese-IR subjects report an analogous inflammatory state (6,25,26). Chemical ablation of monocytes/macrophages as well as KO mice models altering monocyte/macrophage chemokine-homing molecules are known to reduce obesity-related VAT macrophage accumulation resulting in partial resistance to hyperglycemia and a reduction in VAT inflammation (7,8,27). For example, blockade of CCR2 or CCR2 deficiency confers protection from obesity, inflammation, and IR in rodent models (8,28). As CXCR3 is a chemokine receptor that has been shown to play a role in homing of CXCR3 expressing cells to areas of inflammation (9,14,29), receptor ablation may influence accumulation of both adaptive and immune cells in VAT of obese mice. Contrary to our expectations, our study suggested that CXCR3−/− ablation does not hinder migratory potential of either monocytes or T cells. CD4+ and CD8+ T-cell numbers in VAT were not markedly altered with CXCR3 deficiency in the context of HFD with even a small increase in T cells in lean CXCR3−/− animals versus control.
CXCR3 is expressed on activated T cells and on a small portion of resting T lymphocytes, B cells, monocytes, and granulocytes (11,30). CXCR3 is a G-protein-coupled receptor capable of crosstalk with multiple signaling pathways including PI3K-Akt-NFkB and Ras-Raf-MEK-ERK that can regulate cell proliferation, survival, and immune cell activation (11). Our data demonstrating a reduction in the content of both mature and immature macrophage populations suggest an important and unrecognized role for this receptor in the growth and proliferation of macrophages in VAT. Decreased Ly6C in the VAT of KO mice suggested reduced VAT myeloid activation; however, we were unable to perform confirmatory SVF M1/M2 phenotype gene expression due to sample limitations. Alternatively, our in vitro data show that CXCR3−/− macrophages have a defective response to LPS as evidenced by reduced IL-12, iNOS/Nos2, and TNFα synthesis. Intracellular nitric oxide production by stimulated macrophages enhances the host inflammatory response, with Nos2 expression reported to play an important role in macrophage-mediated VAT inflammation in DIO (31,32). VAT adipocyte and macrophage production of TNFα have systemic effects on whole body IR in human and mice (33,34); thus, a blunted VAT macrophage inflammatory response may potentially translate into attenuation of DIO inflammation and IR (35).
Pro-inflammatory TH1 cells outnumber static numbers of anti-inflammatory TH2 and T-regulatory cells during obesity and play an important role in VAT inflammation and DIO-IR (36,37). Local production of inflammatory mediators, such as IL-12, by macrophages is required for T-helper type 1 (TH1) differentiation, potentiating a vicious inflammatory cycle (22,23). TH1 cells are the main source of local IFN-γ, further “priming” macrophages for IL-12 production (38). IL-12 also inhibits IL-4 production and antagonizes TH2 responses (39) promoting VAT inflammation. CXCR3 ligands contribute to TH1-induced inflammation, with an IFNγ-CXCR3-chemokine-dependent inflammatory loop supported in the literature (9,40). The attenuated IL-12 production in cultured CXCR3−/− macrophages may represent a previously unreported function of CXCR3, responsible for the reduced inflammation and IR found in CXCR3−/−-HFD mice. Our findings support a role for the CXCR3 receptor in DIO-IR and suggest a potential therapeutic role for targeting this receptor as a treatment for IR/obesity.
Supplementary Material
Acknowledgments
Funding agencies: This research was supported by an NRSA grant (F32-DK083903) and a KL2 fellowship (Award Number Grant 8KL2TR000112-05 from the National Center for Advancing Translational Sciences) to Dr. Deiuliis. This work was additionally supported by RO-1-ES017290 and R21-DK088522 grants to Dr. Rajagopalan
The content is solely the responsibility of the authors and does not necessarily represent the official views of the National Institute of Diabetes and Digestive and Kidney Diseases, National Center for Advancing Translational Sciences, or the National Institutes of Health. The funders had no role in study design, data collection and analysis, decision to publish, or preparation of the manuscript.
Footnotes
Disclosure: The authors declare no conflict of interest.
Author contributions: JAD conceived and carried out the experiment including study design (SD), data collection (DC), data analysis (DA), data interpretation (DI), generation of figures (GF), and manuscript composition (MC). S.O. —DC; D.D. —DC, DA; J.Z. —SD, DI; J.R. —DC, manuscript editing (ME); A.B. —DC; B.N. —DC; D.M. —DC; V.M. —DC; J.H. —DC; A.R.S.—SD, DA, DI, ME; S.R. —SD, MC, ME.
References
- 1.Weisberg SP, McCann D, Desai M, Rosenbaum M, Leibel RL, Ferrante AW., Jr Obesity is associated with macrophage accumulation in adipose tissue. J Clin Invest. 2003;112:1796–1808. doi: 10.1172/JCI19246. [DOI] [PMC free article] [PubMed] [Google Scholar]
- 2.Wu H, Ghosh S, Perrard XD, et al. T-cell accumulation and regulated on activation, normal T cell expressed and secreted upregulation in adipose tissue in obesity. Circulation. 2007;115:1029–1038. doi: 10.1161/CIRCULATIONAHA.106.638379. [DOI] [PubMed] [Google Scholar]
- 3.Kintscher U, Hartge M, Hess K, et al. T-lymphocyte infiltration in visceral adipose tissue: a primary event in adipose tissue inflammation and the development of obesity-mediated insulin resistance. Arteriosc Thromb Vasc Biol. 2008;28:1304–1310. doi: 10.1161/ATVBAHA.108.165100. [DOI] [PubMed] [Google Scholar]
- 4.Nishimura S, Manabe I, Nagasaki M, et al. CD8+ effector T cells contribute to macrophage recruitment and adipose tissue inflammation in obesity. Nat Med. 2009;15:914–920. doi: 10.1038/nm.1964. [DOI] [PubMed] [Google Scholar]
- 5.Winer S, Chan Y, Paltser G, et al. Normalization of obesity-associated insulin resistance through immunotherapy. Nat Med. 2009;15:921–929. doi: 10.1038/nm.2001. [DOI] [PMC free article] [PubMed] [Google Scholar]
- 6.Deiuliis J, Shah Z, Shah N, et al. Visceral adipose inflammation in obesity is associated with critical alterations in tregulatory cell numbers. PLoS One. 2011;6:e16376. doi: 10.1371/journal.pone.0016376. [DOI] [PMC free article] [PubMed] [Google Scholar]
- 7.Kanda H, Tateya S, Tamori Y, et al. MCP-1 contributes to macrophage infiltration into adipose tissue, insulin resistance, and hepatic steatosis in obesity. J Clin Invest. 2006;116:1494–1505. doi: 10.1172/JCI26498. [DOI] [PMC free article] [PubMed] [Google Scholar]
- 8.Weisberg SP, Hunter D, Huber R, et al. CCR2 modulates inflammatory and metabolic effects of high-fat feeding. J Clin Invest. 2006;116:115–124. doi: 10.1172/JCI24335. [DOI] [PMC free article] [PubMed] [Google Scholar]
- 9.Groom JR, Luster AD. CXCR3 in T cell function. Exp Cell Res. 2011;317:620–631. doi: 10.1016/j.yexcr.2010.12.017. [DOI] [PMC free article] [PubMed] [Google Scholar]
- 10.Hu JK, Kagari T, Clingan JM, Matloubian M. Expression of chemokine receptor CXCR3 on T cells affects the balance between effector and memory CD8 T-cell generation. Proc Natl Acad Sci U S A. 2011;108:E118–E127. doi: 10.1073/pnas.1101881108. [DOI] [PMC free article] [PubMed] [Google Scholar]
- 11.Lacotte S, Brun S, Muller S, Dumortier H. CXCR3, inflammation, and autoimmune diseases. Ann N Y Acad Sci. 2009;1173:310–317. doi: 10.1111/j.1749-6632.2009.04813.x. [DOI] [PubMed] [Google Scholar]
- 12.Luster AD, Leder P. IP-10, a -C-X-C- chemokine, elicits a potent thymus-dependent antitumor response in vivo. J Exp Med. 1993;178:1057–1065. doi: 10.1084/jem.178.3.1057. [DOI] [PMC free article] [PubMed] [Google Scholar]
- 13.Luster AD, Greenberg SM, Leder P. The IP-10 chemokine binds to a specific cell surface heparan sulfate site shared with platelet factor 4 and inhibits endothelial cell proliferation. J Exp Med. 1995;182:219–231. doi: 10.1084/jem.182.1.219. [DOI] [PMC free article] [PubMed] [Google Scholar]
- 14.Zhou J, Tang PC, Qin L, et al. CXCR3-dependent accumulation and activation of perivascular macrophages is necessary for homeostatic arterial remodeling to hemodynamic stresses. J Exp Med. 2010;207:1951–1966. doi: 10.1084/jem.20100098. [DOI] [PMC free article] [PubMed] [Google Scholar]
- 15.Zengel P, Nguyen-Hoang A, Schildhammer C, Zantl R, Kahl V, Horn E. mu-Slide Chemotaxis: a new chamber for long-term chemotaxis studies. BMC Cell Biol. 2011;12:21. doi: 10.1186/1471-2121-12-21. [DOI] [PMC free article] [PubMed] [Google Scholar]
- 16.Gutierrez DA, Kennedy A, Orr JS, et al. Aberrant accumulation of undifferentiated myeloid cells in the adipose tissue of CCR2-deficient mice delays improvements in insulin sensitivity. Diabetes. 2011;60:2820–2829. doi: 10.2337/db11-0314. [DOI] [PMC free article] [PubMed] [Google Scholar]
- 17.Morris DL, Oatmen KE, Wang T, DelProposto JL, Lumeng CN. CX3CR1 deficiency does not influence trafficking of adipose tissue macrophages in mice with diet-induced obesity. Obesity. 2012;20:1189–1199. doi: 10.1038/oby.2012.7. [DOI] [PMC free article] [PubMed] [Google Scholar]
- 18.Strissel KJ, Stancheva Z, Miyoshi H, et al. Adipocyte death, adipose tissue remodeling, and obesity complications. Diabetes. 2007;56:2910–2918. doi: 10.2337/db07-0767. [DOI] [PubMed] [Google Scholar]
- 19.Crane MJ, Hokeness-Antonelli KL, Salazar-Mather TP. Regulation of inflammatory monocyte/macrophage recruitment from the bone marrow during murine cytomegalovirus infection: role for type I interferons in localized induction of CCR2 ligands. J Immunol. 2009;183:2810–2817. doi: 10.4049/jimmunol.0900205. [DOI] [PMC free article] [PubMed] [Google Scholar]
- 20.Shi C, Pamer EG. Monocyte recruitment during infection and inflammation. Nat Rev Immunol. 2011;11:762–774. doi: 10.1038/nri3070. [DOI] [PMC free article] [PubMed] [Google Scholar]
- 21.Xiao BG, Ma CG, Xu LY, Link H, Lu CZ. IL-12/IFN-gamma/NO axis plays critical role in development of Th1-mediated experimental autoimmune encephalomyelitis. Mol Immunol. 2008;45:1191–1196. doi: 10.1016/j.molimm.2007.07.003. [DOI] [PubMed] [Google Scholar]
- 22.Langrish CL, McKenzie BS, Wilson NJ, de Waal Malefyt R, Kastelein RA, Cua DJ. IL-12 and IL-23: master regulators of innate and adaptive immunity. Immunol Rev. 2004;202:96–105. doi: 10.1111/j.0105-2896.2004.00214.x. [DOI] [PubMed] [Google Scholar]
- 23.Kastelein RA, Hunter CA, Cua DJ. Discovery and biology of IL-23 and IL-27: related but functionally distinct regulators of inflammation. Annu Rev Immunol. 2007;25:221–242. doi: 10.1146/annurev.immunol.22.012703.104758. [DOI] [PubMed] [Google Scholar]
- 24.Oliveira MA, Lima GM, Shio MT, Leenen PJ, Abrahamsohn IA. Immature macrophages derived from mouse bone marrow produce large amounts of IL-12p40 after LPS stimulation. J Leukoc Biol. 2003;74:857–867. doi: 10.1189/jlb0302124. [DOI] [PubMed] [Google Scholar]
- 25.Cancello R, Tordjman J, Poitou C, et al. Increased infiltration of macrophages in omental adipose tissue is associated with marked hepatic lesions in morbid human obesity. Diabetes. 2006;55:1554–1561. doi: 10.2337/db06-0133. [DOI] [PubMed] [Google Scholar]
- 26.Ghanim H, Aljada A, Daoud N, Deopurkar R, Chaudhuri A, Dandona P. Role of inflammatory mediators in the suppression of insulin receptor phosphorylation in circulating mononuclear cells of obese subjects. Diabetologia. 2007;50:278–285. doi: 10.1007/s00125-006-0508-9. [DOI] [PubMed] [Google Scholar]
- 27.Feng B, Jiao P, Nie Y, et al. Clodronate liposomes improve metabolic profile and reduce visceral adipose macrophage content in diet-induced obese mice. PLoS One. 2011;6:e24358. doi: 10.1371/journal.pone.0024358. [DOI] [PMC free article] [PubMed] [Google Scholar]
- 28.Tamura Y, Sugimoto M, Murayama T, et al. Inhibition of CCR2 ameliorates insulin resistance and hepatic steatosis in db/db mice. Arteriosc Thromb Vasc Biol. 2008;28:2195–2201. doi: 10.1161/ATVBAHA.108.168633. [DOI] [PubMed] [Google Scholar]
- 29.Seung E, Cho JL, Sparwasser T, Medoff BD, Luster AD. Inhibiting CXCR3-dependent CD8+ T cell trafficking enhances tolerance induction in a mouse model of lung rejection. J Immunol. 2011;186:6830–6838. doi: 10.4049/jimmunol.1001049. [DOI] [PMC free article] [PubMed] [Google Scholar]
- 30.Loetscher M, Gerber B, Loetscher P, et al. Chemokine receptor specific for IP10 and mig: structure, function, and expression in activated T-lymphocytes. J Exp Med. 1996;184:963–969. doi: 10.1084/jem.184.3.963. [DOI] [PMC free article] [PubMed] [Google Scholar]
- 31.Perreault M, Marette A. Targeted disruption of inducible nitric oxide synthase protects against obesity-linked insulin resistance in muscle. Nat Med. 2001;7:1138–1143. doi: 10.1038/nm1001-1138. [DOI] [PubMed] [Google Scholar]
- 32.Sugita H, Fujimoto M, Yasukawa T, et al. Inducible nitric-oxide synthase and NO donor induce insulin receptor substrate-1 degradation in skeletal muscle cells. J Biol Chem. 2005;280:14203–14211. doi: 10.1074/jbc.M411226200. [DOI] [PubMed] [Google Scholar]
- 33.Hotamisligil GS, Shargill NS, Spiegelman BM. Adipose expression of tumor necrosis factor-alpha: direct role in obesity-linked insulin resistance. Science. 1993;259:87–91. doi: 10.1126/science.7678183. [DOI] [PubMed] [Google Scholar]
- 34.Hotamisligil GS, Budavari A, Murray D, Spiegelman BM. Reduced tyrosine kinase activity of the insulin receptor in obesity-diabetes. Central role of tumor necrosis factor-alpha. J Clin Invest. 1994;94:1543–1549. doi: 10.1172/JCI117495. [DOI] [PMC free article] [PubMed] [Google Scholar]
- 35.Davis JE, Gabler NK, Walker-Daniels J, Spurlock ME. Tlr-4 deficiency selectively protects against obesity induced by diets high in saturated fat. Obesity. 2008;16:1248–1255. doi: 10.1038/oby.2008.210. [DOI] [PubMed] [Google Scholar]
- 36.Strissel KJ, DeFuria J, Shaul ME, Bennett G, Greenberg AS, Obin MS. T-cell recruitment and Th1 polarization in adipose tissue during diet-induced obesity in C57BL/6 mice. Obesity. 2010;18:1918–1925. doi: 10.1038/oby.2010.1. [DOI] [PMC free article] [PubMed] [Google Scholar]
- 37.Chatzigeorgiou A, Karalis KP, Bornstein SR, Chavakis T. Lymphocytes in obesity-related adipose tissue inflammation. Diabetologia. 2012;55:2583–2592. doi: 10.1007/s00125-012-2607-0. [DOI] [PubMed] [Google Scholar]
- 38.Vignali DA, Kuchroo VK. IL-12 family cytokines: immunological playmakers. Nat Immunol. 2012;13:722–728. doi: 10.1038/ni.2366. [DOI] [PMC free article] [PubMed] [Google Scholar]
- 39.Wills-Karp M. IL-12/IL-13 axis in allergic asthma. J Allergy Clin Immunol. 2001;107:9–18. doi: 10.1067/mai.2001.112265. [DOI] [PubMed] [Google Scholar]
- 40.Manicone AM, Burkhart KM, Lu B, Clark JG. CXCR3 ligands contribute to Th1-induced inflammation but not to homing of Th1 cells into the lung. Exp Lung Res. 2008;34:391–407. doi: 10.1080/01902140802221987. [DOI] [PMC free article] [PubMed] [Google Scholar]
Associated Data
This section collects any data citations, data availability statements, or supplementary materials included in this article.


