

Abstract
Purpose
MITF/TFE translocation renal cell carcinoma (TRCC) is a rare subtype of kidney cancer. Its incidence and the genome-wide characterization of its genetic origin have not been fully elucidated.
Experimental design
We performed RNA and exome sequencing on an exploratory set of TRCC (n=7), and validated our findings using The Cancer Genome Atlas (TCGA) clear-cell RCC (ccRCC) dataset (n=460).
Results
Using the TCGA dataset, we identified 7 TRCC (1.5%) cases and determined their genomic profile. We discovered three novel partners of MITF/TFE (LUC7L3, KHSRP and KHDRBS2), which are involved in RNA splicing. TRCC displayed a unique gene expression signature as compared to other RCC types, and showed activation of MITF, the transforming growth factor β1 and the PI3K complex targets. Genes differentially spliced between TRCC and other RCC types were enriched for MITF and ID2 targets. Exome sequencing of TRCC revealed a distinct mutational spectrum as compared to ccRCC, with frequent mutations in chromatin remodeling genes (six of eight cases, three of which from the TCGA). In two cases, we identified mutations in INO80D, an ATP-dependent chromatin remodeling gene, previously shown to control the amplitude of the S phase. Knockdown of INO80D decreased cell proliferation in a novel cell line bearing LUC7L3-TFE3 translocation.
Conclusions
This genome-wide study defines the incidence of TRCC within a ccRCC-directed project and expands the genomic spectrum of TRCC by identifying novel MITF/TFE partners involved in RNA splicing and frequent mutations in chromatin remodeling genes.
Keywords: TFE3, TFEB, transcriptome, RNA-seq, fusion, sequencing, renal cell carcinoma
Introduction
Translocation renal cell carcinoma (TRCC) is a rare subtype of kidney cancer which was added to the WHO classification in 2004 (1), and is histologically and genomically a heterogeneous disease (2,3) TRCC is characterized by translocations involving the genes for transcription factors E3 (TFE3) and EB (TFEB) (1–4). TFE3 and TFEB belong to the microphtalmia transcription factor/transcription factor E (MITF-TFE) family of basic helix-loop-helix leucine zipper (bHLH-zip), and are often called MITF TRCC. Although the TFEB gene has been reported to fuse exclusively with the Alpha gene, leading to t(6;11)(p21;q21) translocation, the TFE3 gene (Xp11.2) has been found to rearrange with at least 5 different partners: PRCC (1q21), ASPSCR1 (17q25), SFPQ (1p34), NONO (Xq12), and CLTC (17q23) (1–6). The breakpoints of those translocations differ according to the TFE3 partner, and all TFE3 fusion proteins contain the bHLH-LZ and transcriptional activation domains of TFE3 (7). Unlike TFE3, the TFEB gene rearranges with Alpha, an intronless gene, leading to a translocation that preserves the full-length TFEB coding region, which becomes dysregulated by the Alpha gene promoter (8).
TRCC represents 15% of RCC in patients younger than 40 years (9, 10). The incidence of TRCC varies between 1% and 6% according to previously published studies, several of which used morphology and TFE3 expression alone to screen for RCC cases with translocation (10–12). However, the true incidence of TRCC in an unselected cohort of pathologically confirmed clear-cell RCC (ccRCC) remains to be determined. Next-generation sequencing highly improved our understanding of ccRCC, known to bear inactivation of the von Hippel-Lindau (VHL) tumor suppressor gene, located on chromosome 3p arm (13). Large-scale screening has identified several new cancer genes that include mutations in the SWI/SNF family gene PBRM1 (14) and BAP1 (15), as well as mutations in chromatin remodelers such as KDM6A (16), KDM5C and SETD2 (17). To date, the genetic basis and origins of TRCC remain poorly understood on a genome-wide scale.
Compared with ccRCC, which displays gene expression profiles composed of two main transcriptomic subsets named ccA and ccB (18), the transcriptomic signature of TRCC remains obscure. Although in a previous study tumors of the MITF/TFE family were shown to display a unique gene expression signature (19), their full transcriptomic remains unknown.
In this study, we report the incidence and describe the genomic profile of translocations of the MITF/TFE family identified in the ccRCC TCGA dataset We also describe the genetic basis of other mutations in RCC, including the identification of frequent mutations in genes involved in chromatin remodeling, particularly the INO80D gene.
Materials and Methods
Primary TFE3-related translocation renal cell carcinomas
After obtaining informed consent from patients according to approved research protocols at MD Anderson Cancer Center [MDACC] and Institut Curie, fresh tissue specimens were obtained at the time of nephrectomy and stored at −80° C until DNA and RNA extraction were carried out. The clinico-pathological characteristics of these cases are summarized in Table S1. Genomic DNA with matched normal DNA (adjacent normal kidney tissue) was available from 3 cases (Table S1). RNA extracted from 7 controls (3 papillary RCC, 1 ccRCC, and 3 normal kidney samples) were included. RNA from seven controls (3 papillary RCC, 1 ccRCC, and 3 normal kidney samples) were included. RNA was available for seven cases (Table S1). DNA extraction was performed using the DNeasy blood and Tissue Kit (Qiagen) according to the manufacturer’s instructions. RNA extraction was performed using the RNeasy Kit (Qiagen) according to the manufacturer’s instructions.
RNA sequencing
Total RNA for each sample was converted into a library of template molecules for sequencing on the Illumina Hiseq 2000 according to the NuGen Ovation RNA-Seq System V2 protocol. The details are reported in Supplementary File 1.
Mapping/Alignment
We checked the quality of the sequencing data by using HTSeq package (http://www-huber.embl.de/users/anders/HTSeq/doc/count.html). The raw paired-end reads in FASTQ format were then aligned to the human reference genome, GRCh37/hg19, using MOSAIK alignment software (20). MOSAIK works with paired-end reads from Illumina HiSeq 2000 and uses both a hashing scheme and the Smith-Waterman algorithm to produce gapped optimal alignments and to map exon junction-spanning reads with a local alignment option for RNA-seq. The resulting pair-wise alignments were then consolidated into a multiple sequence alignment (assembly) and saved as a standard bam file.
Identification of differentially expressed genes from RNA-seq
The details are presented in Supplementary File 1.
Fusion detection from RNA-seq
A modified version of VirusSeq that implements a greedy algorithm with a robust statistical model was implemented and used in gene fusion discovery for RNA-seq data (21). The TRCC cases were confirmed by another bioinformatic pipeline called Fusionseq (22). Specifically, Mosaik was used to align paired-end reads to human genome reference (hg19). A given paired-end read alignment was then quantified in terms of the genomic location (L) of the aligned read pair, the distance (D) between the aligned read pair of the fragment (insert) and the orientation (O) of the read pair, and the confidence that each read is uniquely aligned. The specific pattern in (L, D, O) space was used as a constraint to define the discordant read pair. For example, a discordant read pair may have an exceptionally long D spanning a region in the reference genome. All discordant reads were then annotated using the genes defined in UCSC refFlat file, and clustered that support the same fusion event (e.g. PML-RARα). Finally, each fusion candidate was defined and selected as the discordant read clusters where a statistical model-based algorithm with greedy strategy was implemented to accurately detect the boundaries of discordant read clusters and in-silico fusion junctions. Here, in-silico fusion junction is the nucleotide-level genomic coordinate on either side of the gene fusion and is not necessary to be at the ends of known exons. Specifically, the boundary for each discordant read cluster of candidate fusion was estimated on the basis of discordant read mapping locations and orientations with fragment length distribution (e.g. within mean plus three standard deviations, μ+3*σ) as a constraint of cluster size. The cluster size of discordant reads was measured by using reads’ genomic location excluding introns if mapped reads are located across adjacent exons in a candidate fusion gene. Furthermore, an in-silico sequence by using the consensus of reads within discordant read clusters for each fusion candidate was generated to help PCR primer design which facilitates quick PCR validations.
Validation of fusion transcripts
Validation of identified fusion transcripts was performed by PCR using custom primers for amplification. Sanger sequencing was performed on a 3730xl DNA Analyzer (Applied Biosystems) using BigDye™ Terminator v3 chemistry (Applied Biosystems). Fusion sequences were verified using BLAST (U.S. National Institutes of Health) and SeqScape Software v2.5 (Applied Biosystems).
Analysis of differentially spliced exons
To analyze genes that have differential usage of exons, we used DEXseq, version 1.4.0 (23). Specifically, for each gene, a GLM model was fit to detect the differential expression of its exons among four tissue types and to adjust the overall gene expression level and the batch effect. The exon-wise FDR was controlled by the Benjamini-Hochberg method. For exons with FDR < 0.01, pairwise comparisons were performed: TRCC vs. normal kidney tissue, TRCC vs. ccRCC, and TRCC vs. papillary RCC. The Holm method was used to calculate the adjusted P-values for pairwise comparisons.
Unsupervised classification of gene expression
The variance stabilizing transformations implemented in DESeq package were performed on the count data in order to conduct sensible distance calculation. For each gene, the dispersion was calculated to measure its variance among samples, and thus the 2000 genes with highest dispersions were selected for clustering analysis. To remove the systematic difference between the MD Anderson and TCGA samples, the median expression values of each batch per gene were scaled to the same level. Hierarchical clustering analysis was performed using the Pearson correlation coefficient as the distance metric and Ward’s linkage rule. Principal component analysis was also applied to investigate the multivariate pattern. The consensus clustering algorithm with the hierarchical clustering method was used to perform clustering analysis for 460 TCGA ccRCC samples. The expressions of VHL, hypoxia inducible factor 1-alpha (HIF1A) and HIF2A were compared as stated in the section Identification of differentially expressed genes from RNA-seq (Supplementary File 1).
Exome sequencing
Exome capture was performed using Agilent SureSelect Human All Exon 50 Mb according to the manufacturer’s instructions. The technical details and mutation detection are presented in Supplementary File 1.
Transduction of human INO80D shRNA lentiviral particles into HCR-59 cells
The RCC cell lines generated in our laboratory at MDACC are karyotyped to ensure their human origin, and undergo cytokeratin profiling to confirm their epithelial origin, and are yearly tested for mycoplasma. The cell line has been tested and authenticated using DNA fingerprinting fewer than 2 months after resuscitation. We previously reported on a novel cell line (HCR-59), which we derived from the primary tumor of a 20-year old female patient (3), and showed t(X,17q) by spectral karyotyping, and confirmed TFE3 fusion by fluorescence in situ hybridization (FISH). HCR-59 cells were seeded in 12-well plates and infected with human INO80D shRNA or control shRNA lentiviral particles when the cells reached about 50% of confluence, per the manufacturer’s instructions (Santa Cruz Biotech). One day after transduction, the medium was changed to remove untransduced materials. Puromycin dihydrochloride was used to select and maintain stably transduced clones according to the manufacturer’s brochure.
Real-time PCR analysis of mRNA level of human INO80D from stably transduced clones
RNA was extracted from amplified single clones using RNeasy Plus Mini Kit (Qiagen). First-strand cDNA was synthesized using the SuperScript® III First-Strand Synthesis System (Invitrogen) and then used for PCR using SYBR® Green PCR Master Mix (Applied Biosystems). Beta-actin was used as an internal control.
Western blot analysis of INO80D
To detect INO80D protein expression level from cells transduced with human INO80D shRNA and control shRNA, Western blot was performed and protein expression levels of INO80D were quantized using IRDye 680LT, 800CW as secondary antibodies. All images were generated on Odyssey with a scan intensity setting of 3.5/5 (700/800 nm), and sensitivity of 5. Beta-actin was used as an internal control.
Cell proliferation study
To analyze the effect of INO80D on the proliferation of HCR-59 cells, the INO80D shRNA transduced clones were tested for proliferation using CellTiter 96 Aqueous One Solution Cell Proliferation Assay (Promega). Briefly, HCR-59 cells were cultured in 96-well plates in a humidified, 5% CO2 atmosphere for 0–5 days, and 20 μl of CellTiter 96® Aqueous One Solution Reagent was added to each well containing cells in 100μl of culture medium. The plates were then incubated at 37°C for 2 hours before detection of absorbance at 490nm using a 96-well plate reader.
Results
High accuracy of paired-end RNA sequencing for detection of MITF/TFE family fusion transcripts
To assess the sensitivity and accuracy of paired-end transcriptome sequencing in detection of MITF/TFE fusion transcripts, we performed paired-end RNA-seq on six samples of TFE3-related TRCC, for which we previously reported karyotypes, fusion transcripts and outcomes (24) (Table S1), and seven control samples (3 papillary RCC, 1 ccRCC, and 3 normal kidney samples). All the cases studied here were genetically confirmed. Using our bioinformatic pipeline, we were able to detect TFE3 translocations in all Xp11.2 RCC samples (Table 1) and also identified additional fusion transcripts that we validated (Table S2). All TFE3 breakpoints identified here were previously known (Table 1). One TFE3-related RCC sample (RCC-T34) had a confirmed translocation involving the vascular endothelial growth factor A (VEGFA) in the 3′ position, in addition to the ASSCR1-TFE3 fusion transcript. To our knowledge, this is the first report of VEGFA translocation in RCC (Table S2). No fusion transcripts were identified in the control samples. Overall, we confirmed 10 of 12 translocations using reverse-transcription polymerase chain reaction (RT-PCR) (Table S2).
Table 1.
Genomic characterization of MITF/TFE translocation renal cell carcinoma
| Sample Name | Sample Origin | Fusion Product | Mate Number | TFE3 Fusion Site (amino acid) | Comment |
|---|---|---|---|---|---|
| RCC-T25 | MDACC | NONO-TFE3 TFE3-NONO |
38 21 |
295–296 295–296 |
Previously identified fusion |
| RCC-T31 | MDACC | PRCC-TFE3 | 6 | 178–179 | Previously identified fusion |
| RCC-T32 | MDACC | PRCC-TFE3 TFE3-PRCC |
7 3 |
295–296 295–296 |
Previously identified fusion |
| RCC-T33 | MDACC | PRCC-TFE3 | 4 | 260–261 | Previously identified fusion |
| RCC-T34 | MDACC | ASPSCR1-TFE3 | 2 | 295–296 | Previously identified fusion |
| RCC-T35 | MDACC | SFPQ-TFE3 TFE3-SFPQ |
26 26 |
260–261 260–261 |
Previously identified fusion |
| RCC-T1 | MDACC | TFE3-LUC7L3 LUC7L3-TFE3 |
9 1 |
77–78 77–78 |
Fusion identified by RNAseq |
| K345601A | TCGA | TFE3-SFPQ SFPQ-TFE3 |
162 123 |
39–40 39–40 |
Fusion identified by RNAseq |
| K475601A | TCGA | SFPQ-TFE3 | 296 | 39–40 | Fusion identified by RNAseq |
| K475801 | TCGA | SFPQ-TFE3 | 5 | 39–40 | Fusion identified by RNAseq |
| K554601 | TCGA | SFPQ-TFE3 | 89 | 295–296 | Fusion identified by RNAseq |
| K570501 | TCGA | SFPQ-TFE3 | 2 | 295–296 | Fusion identified by RNAseq |
| K568101A | TCGA | KHSRP-TFE3 | 19 | 178–179 | Fusion identified by RNAseq |
| K331301A | TCGA | TFEB-KHDRBS2 | 485 | 397–398/TFEB | Fusion identified by RNAseq |
Abbreviations: MDACC: MD Anderson Cancer Center; TCGA: The Cancer Genome Atlas
Identification of a novel LUC7L3-TFE3 fusion transcript
Since one of our identified TRCC tumor samples (RCC-T1) had TFE3 translocation confirmed by fluorescence in situ hybridization (FISH), without a classical TFE3 partner identified, we performed paired-end RNA-seq on this sample and revealed a novel fusion transcript involving LUC7L3-TFE3, leading to a balanced translocation (Figure 1A). LUC7L3 is located on the chromosome 17q (17q21.33), near two other TFE3 partners, ASPSCR1 and CLTC. This gene encodes a protein with a C-terminal half that is rich in arginine and glutamate residues (RE domain) and arginine and serine residues (RS domain). Interestingly, this protein is involved in RNA splicing via the RE and RS domains (Figure 1A), which thus expands the spectrum of genes involved in RNA splicing and fusing with TFE3.
Figure 1.

Characterization of the novel fusion transcript LUC7L3-TFE3. A) Genomic breakpoint mapped to base resolution, with arrows indicating breakpoints; and schematic of chimeric protein. e stands for exon. B) Sanger sequencing validation of the fusion transcript. C) RT-PCR validation of the fusion transcript.
Spectral karyotyping performed on a novel cell line (HCR-59), derived from a patient with this novel translocation, revealed multiple inter-chromosomal translocations occurring within 17q (3), but only LUC7L3-TFE3 led to a fusion transcript. LUC7L3-TFE3 was further validated by RT-PCR in the primary sample (Figure 1B–C) and the HCR-59 cell line (not shown).
Identification of MITF/TFE translocation in ccRCC of TCGA
To characterize the functional translocations in ccRCC and identify fusion transcripts in a large dataset of kidney cancer, we analyzed paired-end transcriptome sequencing of 460 ccRCC samples profiled by TCGA. Using a threshold detection of a minimum of four tags per fusion junction, we identified fusion transcripts in 87 tumors (18.7%) with a median translocation number of one per tumor (range: 1–12). Aiming to select the translocations that are most likely oncogenic, we used stringent criteria of a minimum of six tags identified per fusion junction, with at least one tag spanning the fusion junction. These criteria were based on the assumption that oncogenic fusion transcripts should be overexpressed. Using the criteria of six or more tags per fusion junction, we identified 123 translocations, including 84 (68.3%) intra-chromosomal and 39 (31.7%) extra-chromosomal translocations (Tables S3 and S4). These were related to 81 tumors (17.6%) (Figure 2), with a median of one translocation per tumor (range: 1–10) (Figure 3A).
Figure 2.

Workflow process of the fusion detection algorithm implemented and applied to data from MDACC and TCGA.
Figure 3.
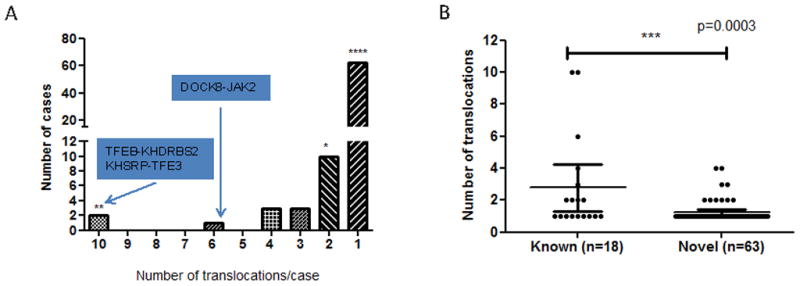
Distribution of identified translocation renal cell carcinomas from TCGA. A) Distribution of the number of fusion transcripts identified in cases with at least one identified fusion transcript. B) Comparison of the number of fusion transcripts per sample according to whether translocation involves genes previously identified as involved in translocation. Mann-Whitney non parametric test was used for this analysis.
To analyze whether the fusion genes have functional relevance, we used Database for Annotation Visualization and Integrated Discovery (DAVID). Functional annotations revealed exclusive enrichment of genes involved in chromosomal rearrangements (P-value =4x10⁻⁴, false discovery rate [FDR] <0.04), which were related to 13 fusion genes and had occurred in 19 patients (~23.5% of all patients with translocation) (Table S5). These genes were: TFE3 (n=6), TFEB (n=1), SFPQ (n=5), FHIT (n=2), SLC9A9 (n=2), AFF1 (n=1), MKL1 (n=1), LHFP (n=1), ELL (n=1), JAK2 (n=1), DCX (n=1), EP300 (n=1), and LNP1 (n=1). Six of these genes are known to be proto-oncogenes (TFEB, TFE3, MKL1, ELL, JAK2, and AFF1). Thus, TRCC represents the most frequently occurring common translocation found in TCGA’s RCC dataset and represents 1.5% (7 of 460) of all ccRCC cases (Figure 2).
Interestingly, tumors bearing fusion transcripts with a partner previously reported to be involved in translocation have an overall higher rate of translocation as compared to those with newly identified translocations, with translocations per tumor having mean values of 2.8 versus 1.2, respectively (P-value<0.0003; Figure 3B). After excluding the six tumors with a translocation rate of four or more per tumor, DAVID analysis found that samples with fusion genes were enriched for fusions occurring within chromosome 3 (n=20; P-value =4.6x10⁻⁴) and chromosome 5 (n=17; P-value =1.7x10⁻³). The majority of those fusions were intra-chromosomal translocations (n=24); there were only five cases with t(3;5) translocation. Two of those five cases involved the FHIT gene, known to be involved in hereditary RCC; in our cohort, FHIT fused with FAM172A and CAMK4 genes. No gene fusion transcripts were identified in 62 cases of normal kidney samples extracted from tissue adjacent to ccRCC.
Genomic profile of MITF/TFE family translocation renal cell carcinoma
All but one TFE3-related TRCC identified in TCGA data were found to fuse with the SFPQ gene (Table 1). These results were confirmed by FusionSeq, another modular framework for gene fusion detection (22). Three TRCC samples showed novel breakpoint junctions that occurred within the first intron, leading to fusion proteins that contained almost the entire TFE3 protein (Table 1). We also identified a novel partner of TFE3, which is the KHSRP gene. This novel fusion protein includes almost the entire KHSRP protein at the C-terminal part and the TFE3 protein at the N-terminal part (Figure 4A). Of note, KHSRP regulates the maturation of a group of miRNAs in addition to its role in promoting mRNA decay, leading to the integration of specific regulatory processes for protein expression. Furthermore, we discovered a novel fusion transcript involving TFEB-KHDRBS2 genes (Figure 4B). This fusion transcript is unique in two ways:
Figure 4.

A and B) Read distribution around two fusions: KHSRP-TFE3 and TFEB-KHDRBS2. The reads are aligned by our pipeline that identifies those fusion products. The data contained more reads than drawn and were collapsed for a better illustration of their distribution. Eight and 79 reads spanning the fusion junctions were identified for KHSRP-TFE3 and TFEB-KHDRBS2 fusion transcripts. e stands for exon. C and D) Circos plots for the case bearing the TFEB-KHDRBS2 translocation revealing focal rearrangements within chromosome 6. No other fusion transcripts in other chromosomes were found.
The TFEB gene was located at the 5′ end of the novel fusion protein, which retained almost the entire TFEB coding protein, in particular the helix-loop-helix domain. This has also been found in Alpha-TFEB translocation (11). Furthermore, KHDRBS2 contains a KH-type splicing regulatory domain that is involved in RNA splicing, as does KHSRP, and the majority of TFE3 partners.
In addition to the TFEB-KHDBRS2 fusion transcript, this sample of TRCC showed one of the highest numbers of tags spanning the fusion junction in the entire TCGA dataset (Table S3). In particular, this tumor bears nine additional fusion transcripts, consistent with rearrangements occurring within 28.9 megabases (chr6: 33,748,810–62,638,252) (Figure 4C–D). We termed this process a “translocator phenotype”.
Likewise, the RCC sample with KHSRP-TFE3 fusion transcript had nine additional translocations occurring within a region spanning ~17.3 megabases on chromosome 21 within a region spanning approximately 54.8 megabases on chromosome X and consistent with a “translocator phenotype”.
To rule out the possibility of aberrant splicing that may explain the “translocator phenotype”, we downloaded whole exome sequencing data from TCGA for both KHSRP-TFE3 and TFEB-KHDRBS2 cases (there is no whole genome sequencing data for both cases), and performed translocation detection. Interestingly, we were able to detect the breakpoint for KHSRP-TFE3 with whole exome data, since the breakpoint is located within exon 4 of TFE3 (Figure S1); thus we could exclude the possibility that KHSRP-TFE3 is related to an aberrant splicing. Unfortunately, we were not able to detect the breakpoint for TFEB-KHDRBS2 with whole exome data, since the breakpoint doesn’t occur within any exon of both fusion partners.
Pathway analysis of MITF/TFE translocation renal cell carcinoma
To assess whether TRCC displays a specific transcriptional profile, we analyzed our seven TRCC samples, and seven cases (six TFE3-related and one TFEB-related) which we identified in the dataset from TCGA, and compared them to 17 ccRCC samples (1 from MDACC and 16 from TCGA), 19 papillary RCC samples (3 from MDACC and 16 from TCGA), and 16 normal kidney tissue samples (2 from MDACC and 14 from TCGA). After removing the batch effect, unsupervised clustering revealed that TRCC displays a unique gene expression signature, as compared to those of ccRCC and papillary RCCs, except for two TFE3-related RCCs that were found to be minor clones (Figure 5A). These data were confirmed by principal component analysis (not shown). Thus, MITF/TFE family translocations identified in the RCC cohort from TCGA have transcriptional profiles that are similar to those of the pediatric and young adult patients profiled independently through our sample collection, and share the same active and distinct pathways as those of other RCC subtypes.
Figure 5.

A) Unsupervised clustering of MITF/TFE TRCC, ccRCC, papillary RCC, and normal kidney tissue revealing that TRCC displays a unique transcriptomic profile as compared to normal kidney and other RCC types. Note that the two possible minor clones among the TFE-related TRCC cases are clustered with other ccRCC samples. B) Unsupervised clustering of TRCC showing 2 subgroups with no samples clustered according to the TFE3 partner. C) Unsupervised clustering of gene expression of the 460 ccRCCs extracted from TCGA, showing the TRCCs clustered together within the ccB group, except the 2 cases that we defined as being TFE3 minor clones.
Compared to the gene expression profile of normal kidney tissue, Ingenuity Pathway Analysis (IPA) revealed that besides the expected activation of MITF (P-value =1.1x10⁻⁹), TRCC had predicted activation of the following upstream regulators: transforming growth factor β1 (TGFβ1) (P-value =6.6x10⁻¹⁷), lipopolysaccharides (6.07x10⁻¹⁴), tumor necrosis factor (P-value =4.2x10⁻¹¹) and the PI3K complex (P-value = 6.9x10⁻¹⁵). Compared to ccRCC, IPA revealed that TRCC showed activation of MITF (P-value =3.7x10⁻⁶) and estrogen-related receptor alpha (ESRRA) (P-value =2.99x10⁻⁴) pathways, and inhibition of HIF2-alpha (P-value =1.9x10⁻¹⁰) and VEGFA (P-value =3.7x10⁻⁵) pathways.
Analysis of differentially spliced genes in MITF/TFE translocation renal cell carcinoma
Since the majority of TFE3 and TFEB partners were involved in RNA splicing, we investigated whether any genes were differentially spliced between TRCC and normal kidney tissue, ccRCC, or papillary RCC, respectively. Using the following thresholds (adjusted p-values of pairwise comparisons <0.01 and fold change > 2), we identified 86 genes that were differentially spliced in respective comparisons of TRCC and each of the three other groups (not shown). Interestingly, for those three comparisons, IPA showed four pathways that were consistently differentially spliced (not shown), which included MITF and ID2 (Inhibitor of DNA Binding 2) targets. Thus, TRCCs are not only characterized by activation of the MITF target genes but also by alterations of their RNA splicing. We found consistent differential splicing of the PMEL gene, which encodes a premelanosome protein. Differential exon usage between TRCC versus normal kidney tissue, papillary RCC or ccRCC was present within exons 4, 26, 27, 41 and 42 (Figure S2). We also identified differentially spliced genes belonging to HNF4A, TP53, MGEA5 and HRAS pathways, suggesting that oncogenic fusion proteins may affect splicing in pathways deregulated by tumor suppressor genes and oncogene targets.
Integrative analysis of TRCC and gene expression reveals enrichment of translocations within the cc2B subgroup
We considered whether TRCC has a distinct signature according to its fusion partners. Although the number of samples was small, unsupervised clustering performed on all samples in the MDACC and TCGA datasets revealed two subgroups that clustered independently from the partners of TRCC (Figure 5B). Another interesting consideration was whether the MITF-related TRCC identified in the data from TCGA formed a distinct subgroup. We performed hierarchical unsupervised consensus clustering on the entire TCGA cohort. Our results were consistent with previous results by Brannon et al. (21), which showed that ccRCC can be divided in two dominant types, ccA and ccB. In our analyses, five of the seven samples of MITF-related TRCC were associated with ccB cluster, while the two samples of TFE3-related TRCC (minor clones) were associated with the ccA cluster (Figure 5C).
We then considered whether the expression of VHL, HIF1A HIF2A or EPAS1 differed between TRCC and normal kidney tissue, and found no difference for VHL expression, suggesting that carcinogenesis of TRCC is independent of VHL (not shown).
Mutational landscape of MITF/TFE family TRCC displays frequent mutations of chromatin remodelers
We used exome sequencing to assess the mutational status of three TFE3-related TRCC cases for which matched normal samples were available at MDACC (one collected from an individual younger than 18 years) (Table S1), and two cases without matched normal samples available (1 TFE3- and TFEB-related TRCC). We did not identify any recurrent mutation in our cohort. Moreover, no VHL, PBRM1, or BAP1 mutations were identified in any of our cases, suggesting different mechanisms for the initiation and progression of these tumors, as compared to ccRCC. Since chromatin remodeling genes were recently shown to be frequently altered in ccRCC, we decided to look for mutations in these genes in TRCC. As a result, three of the five cases had mutations in chromatin remodeling genes (Table S6). One case (RCC-T29) had a confirmed frameshift mutation within the SMARCC2 gene, a member of the SWI/SNF family likely leading to a deleterious protein. The second case (RCC-T2) had missense mutation of KDM5C gene, which acts as a histone H3 lysine 4 demethylase and is frequently inactivated in ccRCC (17). The third case (RCC-T1) had a missense and a frameshift mutation of INO80D gene, a chromatin remodeler belonging to the INO80 complex. Both KDM5C and INO80D mutations were predicted by SIFT and mutation assessor to lead to deleterious proteins. These mutations were all validated by Sanger sequencing at the DNA level. Furthermore, INO80D mutation was also validated at the RNA level, as RNA was available for RCC-T1 case (Figure 6A).
Figure 6.
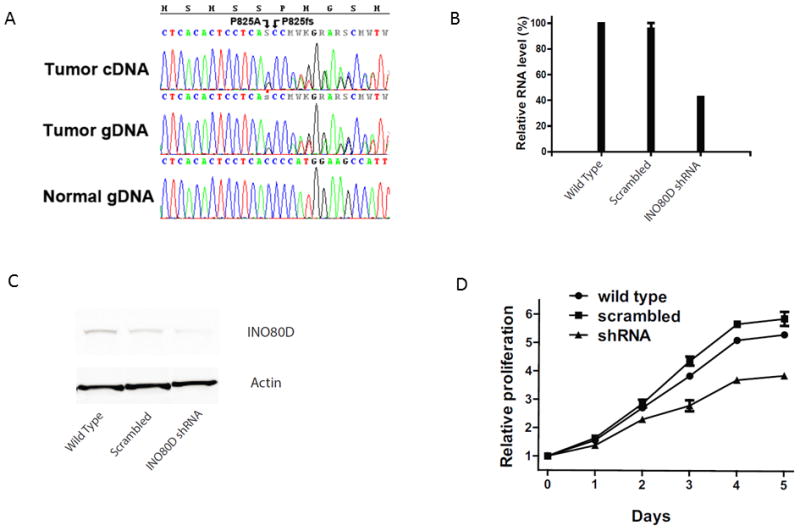
A) Chromatograms showing the missense mutation P825A (C2473G), and the frameshift deletion, P825fs (2474delC), in cDNA and gDNA from tumor sample RCC-T1 and normal gDNA. The missense SNV can be clearly seen as a heterozygous C>S while the frameshift C deletion is visualized by double peaks following the deletion and confirmed by manual separation of the two sequences. B) Decreased mRNA level of INO80D in shRNA transduced cell as detected by RT-PCR. C) Decreased protein level of INO80D in shRNA transduced cells as detected by Western blot. D) Knockdown of INO80D expression inhibits proliferation of HCR-59 cells.
We then decided to validate our findings in the TCGA cohort. We extracted from COSMIC database the list of confirmed somatic missense mutations related to three of the seven MITF/TFE family TRCC cases identified in the TCGA, and for which data were available. The K570501 was the only case with VHL mutation. None of the two other cases had VHL, PBRM1 or BAP1 mutations. Interestingly, all three cases had mutations in chromatin remodeling genes including CHD9 in K570701, CHD7 and INO80D in K568101, and MLL3 in K554601. Thus, 75% of TRCCs (six of eight cases) display mutations in chromatin remodeling genes.
INO80D knockdown affects cell proliferation
Since we identified missense mutations in IN080D in two TRCC cases, we decided to assess the frequency of INO80D mutations in ccRCC using COSMIC database. Among 334 cases assessed, only two cases had missense-substitution mutations, and one of those is the TRCC case K570701. Since the INO80 chromatin remodeling complex has not been implicated in cancer, we decided to analyze the effect on proliferation of this ATP-dependent chromatin remodeling factor, which has been demonstrated to control the amplitude of the S phase (25). We used the HCR-59 cell line that we generated from RCC-T1 (3), which bears the INO80D mutation at both DNA and RNA levels. Interestingly, this mutation was predicted to be deleterious by Provean (cutoff=2.5) and SIFT (cutoff=0.05). Moreover, SNP array data showed no gain or loss of copy number in chromosome 2q where INO80D resides (not shown). Abrogation of INO80D expression via shRNA knockdown in the HCR-59 cell line showed decreased proliferation as a consequence of INO80D loss (Figure 6B–E).
Discussion
To our knowledge, this is the first genome-wide analysis using RNA-seq and exome sequencing to analyze in depth the genomic abnormalities of TRCC. Our analysis reveals important findings. First, MITF/TFE was the most frequent recurrent translocation identified in the TCGA cohort with an observed 1.5% incidence within a ccRCC-directed project. We believe TRCC may have been deselected from the ccRCC TCGA cohort, resulting in ascertainment bias. Consequently, the true incidence of TRCC among RCC might be higher than the 1.6% reported by Komai et al. (13). Second, the spectrum of TFE3/TFEB fusion transcripts we identified in adults differed from those of historical series, such as five of the seven cases we identified from TCGA were related to SFPQ-TFE3 fusion genes. Moreover, we identified novel breakpoints for SFPQ-TFE3 translocation, suggesting that breakpoints of translocations may vary among different patient groups.
By identifying two novel partners of TFE3, LUC7L3 and KHSRP, which are involved in RNA splicing, we expanded the spectrum of translocations. Additionally, we found the TFEB gene to fuse at the 3′ end with KHDRBS2, which is another gene involved in RNA splicing. As for Alpha-TFEB translocation, the entire TFEB protein is preserved in this translocation, and it is likely that carcinogenesis in this type of RCC is related to TFEB deregulation, as suggested by other investigators (8). Interestingly, the two cases with KH-domain translocations showed multiple fusion transcripts, which represented unique patterns as compared to those of the other ccRCCs. We labeled those tumors as “translocator phenotype”. For TFE3-KHSRP, using exome sequencing, we were able to demonstrate that breakpoint occurs indeed in exon 4. For TFEB-related TRCC, those fusion transcripts were generated within a short genomic region in chromosome 6. Further analyses are required to better understand the genetic basis of those multiple fusion transcripts. Although we were not been able to validate the TFEB fusion by RT-PCR (TCGA cohort), evidence suggests that this fusion transcript is highly likely to exist. This is based on the high number of tags identified by RNA-seq with 79 tags spanning the fusion junction, clustering of TFEB- and TFE3-related TRCC which showed clustering of TFEB-related TRCC with other TRCC cases and finally MITF and TGFβ1 pathway activation. A plausible explanation for the “translocator phenotype” could be a predisposing factor for the oncogenic translocation, such as chemotherapy in the childhood, as postulated by Argani et al.(26). It can also be related to chromothripsis, a process by which clusters of thousands of rearrangements occur in confined genomic regions (27). Unfortunately, we were not able to get whole genome data from the TCGA to investigate this process.
Another interesting finding is that transciptomic profiling of TRCC, which revealed that the majority of cases belonged to the ccB transcriptomic group. Ingenuity Pathway Analysis revealed TGF-β1 and PI3K complex activations. We previously reported clinical activity of VEGF and mammalian target of rapamycin (mTOR) directed therapies in TRCC (28, 29). We believe that inhibiting the TGFβ1 and PI3K pathways may present other potential therapeutic options for patients with TRCC.
An important question is whether there is a difference in gene splicing between TRCC and normal kidney tissue and other RCC types (30). Using RNA-seq, we analyzed gene splicing and discovered that MITF targets are differentially spliced in TRCC. We speculate that by binding to MITF targets, the fusion proteins may activate MITF targets and affect their splicing, as is the case for the PMEL gene, which encodes for a premelanosome protein that is regulated by MITF. Additional experiments are needed to further explore this process.
Our analysis describes the landscape of mutations for TRCC. Although no recurrent mutations were identified, the spectrum of mutations in TRCC differs from those of other RCC types which are characterized by mutations of VHL, PBRM1 or BAP1. It is interesting to highlight that six of eight TRCC cases had mutations in chromatin remodeling genes, particularly, mutations in INO80D chromatin remodeling gene. To our knowledge, this is the first report of INO80D mutations in cancer. Whether these mutations can lead to translocations, by altering a DNA repair process, remains to be determined. It is interesting to note that knockdown of INO80D, previously shown to control the amplitude of the S phase (27), decreased cell proliferation in HCR-59 cell line bearing LUC7L3-TFE3 translocation. We postulate that INO80D mutations may play a role in promoting an aggressive phenotype of TRCC.
In summary, we identified novel partners of TFE3 and TFEB, which are all involved in RNA splicing. We analyzed the genetic landscape for somatic mutations, and defined the gene expression signature as well as altered signaling pathways in this disease. We believe our findings provide a framework for future therapeutic interventions.
Supplementary Material
Translational Relevance Statement.
We performed exome and RNA sequencing on sevenMITF/TFE translocation renal cell carcinoma (TRCC) tumors and validated our findings in seven of 460 (1.5%) clear-cell RCC cases from The Cancer Genome Atlas (TCGA). We discovered three novel partners ofMITF/TFE, which are involved in RNA splicing (LUC7L3, KHSRP and KHDRBS2). TRCC displayed a unique gene expression signature with activation of MITF, the transforming growth factor β1 and the PI3K complexes.
Genes differentially spliced between TRCC and other RCC types were enriched for MITF targets, suggesting a putative role for RNA splicing in kidney carcinogenesis. Exome sequencing revealed mutations in the chromatin remodeling gene INO80D. Our study expands the spectrum of TRCC and raises potential therapeutic implications.
Acknowledgments
Financial support: This work was supported in part by grants from Kidney Cancer Research Group, NIH/NCI award number P30CA016672 and the Genitourinary Cancers Program of the CCSG shared resources, at MD Anderson Cancer Center.
Footnotes
The authors have no conflicts of interest to disclose.
References
- 1.Argani P, Ladanyi M. Translocation carcinomas of the kidney. Clin Lab Med. 2005;25:363–78. doi: 10.1016/j.cll.2005.01.008. [DOI] [PubMed] [Google Scholar]
- 2.Argani P, Lae M, Hutchinson B, Reuter VE, Collins MH, Perentesis J, et al. Renal carcinomas with the t(6;11)(p21;q12): clinicopathologic features and demonstration of the specific alpha-TFEB gene fusion by immunohistochemistry, RT-PCR, and DNA PCR. Am J Surg Pathol. 2005;29:230–40. doi: 10.1097/01.pas.0000146007.54092.37. [DOI] [PubMed] [Google Scholar]
- 3.Clark J, Lu YJ, Sidhar SK, Parker C, Gill S, Smedley D, et al. Fusion of splicing factor genes PSF and NonO (p54nrb) to the TFE3 gene in papillary renal cell carcinoma. Oncogene. 1997;15:2233–9. doi: 10.1038/sj.onc.1201394. [DOI] [PubMed] [Google Scholar]
- 4.Sidhar SK, Clark J, Gill S, Hamoudi R, Crew AJ, Gwilliam R, et al. The t(X;1)(p11.2;q21.2) translocation in papillary renal cell carcinoma fuses a novel gene PRCC to the TFE3 transcription factor gene. Hum Mol Genet. 1996;5:1333–8. doi: 10.1093/hmg/5.9.1333. [DOI] [PubMed] [Google Scholar]
- 5.Argani P, Antonescu CR, Illei PB, Lui MY, Timmons CF, Newbury R, et al. Primary renal neoplasms with the ASPL-TFE3 gene fusion of alveolar soft part sarcoma: a distinctive tumor entity previously included among renal cell carcinomas of children and adolescents. Am J Pathol. 2001;159:179–92. doi: 10.1016/S0002-9440(10)61684-7. [DOI] [PMC free article] [PubMed] [Google Scholar]
- 6.Argani P, Lui MY, Couturier J, Bouvier R, Fournet JC, Ladanyi M. A novel CLTC-TFE3 gene fusion in pediatric renal adenocarcinoma with t(X;17)(p11.2;q23) Oncogene. 2003;14;22:5374–8. doi: 10.1038/sj.onc.1206686. [DOI] [PubMed] [Google Scholar]
- 7.Haq R, Fisher DE. Biology and clinical relevance of the micropthalmia family of transcription factors in human cancer. J Clin Oncol. 2011;29:3474–82. doi: 10.1200/JCO.2010.32.6223. [DOI] [PubMed] [Google Scholar]
- 8.Davis IJ, Hsi BL, Arroyo JD, Vargas SO, Yeh YA, Motyckova G, et al. Cloning of an Alpha-TFEB fusion in renal tumors harboring the t(6;11)(p21;q13) chromosome translocation. Proc Natl Acad Sci U S A. 2003;100:6051–6. doi: 10.1073/pnas.0931430100. [DOI] [PMC free article] [PubMed] [Google Scholar]
- 9.Argani P, Olgac S, Tickoo SK, Goldfischer M, Moch H, Chan DY, et al. Xp11 translocation renal cell carcinoma in adults: expanded clinical, pathologic, and genetic spectrum. Am J Surg Pathol. 3:1149–60. doi: 10.1097/PAS.0b013e318031ffff. 200. [DOI] [PubMed] [Google Scholar]
- 10.Komai Y, Fujiwara M, Fujii Y, Mukai H, Yonese J, Kawakami S, et al. Adult Xp11 translocation renal cell carcinoma diagnosed by cytogenetics and immunohistochemistry. Clin Cancer Res. 2009;15:1170–6. doi: 10.1158/1078-0432.CCR-08-1183. [DOI] [PubMed] [Google Scholar]
- 11.Sukov WR, Hodge JC, Lohse CM, Leibovich BC, Thompson RH, Pearce KE, et al. TFE3 rearrangements in adult renal cell carcinoma: clinical and pathologic features with outcome in a large series of consecutively treated patients. Am J Surg Pathol. 2012;36:663–70. doi: 10.1097/PAS.0b013e31824dd972. [DOI] [PubMed] [Google Scholar]
- 12.Zhong M, De Angelo P, Osborne L, Paniz-Mondolfi AE, Geller M, Yang Y, et al. Translocation renal cell carcinomas in adults: a single-institution experience. Am J Surg Pathol. 2012;36:654–62. doi: 10.1097/PAS.0b013e31824f24a6. [DOI] [PMC free article] [PubMed] [Google Scholar]
- 13.Gnarra JR, Tory K, Weng Y, Schmidt L, Wei MH, Li H, et al. Mutations of the VHL tumour suppressor gene in renal carcinoma. Nat Genet. 1994;7:85–90. doi: 10.1038/ng0594-85. [DOI] [PubMed] [Google Scholar]
- 14.Varela I, Tarpey P, Raine K, Huang D, Ong CK, Stephens P, et al. Exome sequencing identifies frequent mutation of the SWI/SNF complex gene PBRM1 in renal carcinoma. Nature. 2011;27:469, 539–42. doi: 10.1038/nature09639. [DOI] [PMC free article] [PubMed] [Google Scholar]
- 15.Pena-Llopis S, Vega-Rubin-de-Celis S, Liao A, Leng N, Pavia-Jimenez A, Wang S, et al. BAP1 loss defines a new class of renal cell carcinoma. Nat Genet. 2012;44:751–9. doi: 10.1038/ng.2323. [DOI] [PMC free article] [PubMed] [Google Scholar]
- 16.van Haaften G, Dalgliesh GL, Davies H, Chen L, Bignell G, Greenman C, et al. Somatic mutations of the histone H3K27 demethylase gene UTX in human cancer. Nat Genet. 2009;41:521–3. doi: 10.1038/ng.349. [DOI] [PMC free article] [PubMed] [Google Scholar]
- 17.Dalgliesh GL, Furge K, Greenman C, Chen L, Bignell G, Butler A, et al. Systematic sequencing of renal carcinoma reveals inactivation of histone modifying genes. Nature. 2010;463:360–3. doi: 10.1038/nature08672. [DOI] [PMC free article] [PubMed] [Google Scholar]
- 18.Brannon AR, Haake SM, Hacker KE, Pruthi RS, Wallen EM, Nielsen ME, et al. Meta-analysis of clear cell renal cell carcinoma gene expression defines a variant subgroup and identifies gender influences on tumor biology. Eur Urol. 2012;61:258–68. doi: 10.1016/j.eururo.2011.10.007. [DOI] [PMC free article] [PubMed] [Google Scholar]
- 19.Camparo P, Vasiliu V, Molinie V, Couturier J, Dykema KJ, Petillo D, et al. Renal translocation carcinomas: clinicopathologic, immunohistochemical, and gene expression profiling analysis of 31 cases with a review of the literature. Am J Surg Pathol. 2008;32:656–70. doi: 10.1097/PAS.0b013e3181609914. [DOI] [PubMed] [Google Scholar]
- 20.Hillier LW, Marth GT, Quinlan AR, Dooling D, Fewell G, Barnett D, et al. Whole-genome sequencing and variant discovery in C. elegans. Nat Methods. 2008;5:183–8. doi: 10.1038/nmeth.1179. [DOI] [PubMed] [Google Scholar]
- 21.Chen Y, Yao H, Thompson EJ, Tannir NM, Weinstein JN, Su X. VirusSeq: software to identify viruses and their integration sites using next-generation sequencing of human cancer tissue. Bioinformatics. 2013;29:266–7. doi: 10.1093/bioinformatics/bts665. [DOI] [PMC free article] [PubMed] [Google Scholar]
- 22.Sboner A, Habegger L, Pflueger D, Terry S, Chen DZ, Rozowsky JS, et al. FusionSeq: a modular framework for finding gene fusions by analyzing paired-end RNA-sequencing data. Genome Biol. 2010;11:R104. doi: 10.1186/gb-2010-11-10-r104. [DOI] [PMC free article] [PubMed] [Google Scholar]
- 23.Anders S, Reyes A, Huber W. Detecting differential usage of exons from RNA-seq data. Genome Res. 2012;22:2008–17. doi: 10.1101/gr.133744.111. [DOI] [PMC free article] [PubMed] [Google Scholar]
- 24.Malouf GG, Camparo P, Molinie V, Dedet G, Oudard S, Schleiermacher G, et al. Transcription factor E3 and transcription factor EB renal cell carcinomas: clinical features, biological behavior and prognostic factors. J Urol. 2011;185:24–9. doi: 10.1016/j.juro.2010.08.092. [DOI] [PubMed] [Google Scholar]
- 25.Au TJ, Rodriguez J, Vincent JA, Tsukiyama T. ATP-dependent chromatin remodeling factors tune S phase checkpoint activity. Mol Cell Biol. 2011;31:4454–63. doi: 10.1128/MCB.05931-11. [DOI] [PMC free article] [PubMed] [Google Scholar]
- 26.Argani P, Lae M, Ballard ET, Amin M, Manivel C, Hutchinson B, et al. Translocation carcinomas of the kidney after chemotherapy in childhood. J Clin Oncol. 2006;24:1529–34. doi: 10.1200/JCO.2005.04.4693. [DOI] [PubMed] [Google Scholar]
- 27.Stephens PJ, Greenman CD, Fu B, Yang F, Bignell GR, Mudie LJ, et al. Massive genomic rearrangement acquired in a single catastrophic event during cancer development. Cell. 2011;144:27–40. doi: 10.1016/j.cell.2010.11.055. [DOI] [PMC free article] [PubMed] [Google Scholar]
- 28.Malouf GG, Camparo P, Oudard S, Schleiermacher G, Theodore C, Rustine A, et al. Targeted agents in metastatic Xp11 translocation/TFE3 gene fusion renal cell carcinoma (RCC): a report from the Juvenile RCC Network. Ann Oncol. 2010;21:1834–8. doi: 10.1093/annonc/mdq029. [DOI] [PubMed] [Google Scholar]
- 29.Choueiri TK, Lim ZD, Hirsch MS, Tamboli P, Jonasch E, McDermott DF, et al. Vascular endothelial growth factor-targeted therapy for the treatment of adult metastatic Xp11.2 translocation renal cell carcinoma. Cancer. 2010;116:5219–25. doi: 10.1002/cncr.25512. [DOI] [PMC free article] [PubMed] [Google Scholar]
- 30.Garcia-Blanco MA, Baraniak AP, Lasda EL. Alternative splicing in disease and therapy. Nat Biotechnol. 2004;22:535–46. doi: 10.1038/nbt964. [DOI] [PubMed] [Google Scholar]
Associated Data
This section collects any data citations, data availability statements, or supplementary materials included in this article.