Abstract
The purpose of this cross-sectional study was to measure imaging utilization rates and the negative appendectomy rate (NAR) in metropolitan Seoul, Korea. The study included 2321 adolescents and adults (≥15 yr; median [interquartile range] age, 37 [27-50] yr; 46.7% female) undergoing appendectomy in 2011 at eight tertiary and three secondary hospitals. Imaging utilization rate was 99.7% (95% confidence interval, 99.4%-99.9%). CT and ultrasonography utilization rates as an initial imaging modality were 93.1% (92.0%-94.1%), and 6.5% (5.6%-7.6%), respectively. The NAR in patients undergoing CT only, complementary ultrasonography following CT, ultrasonography only, and complementary CT following ultrasonography were 3.3% (2.6%-4.1%), 27% (14%-44%), 9% (4%-16%), and 8% (2%-20%), respectively. The use of ultrasonography instead of CT as the initial imaging modality was significantly associated with higher NAR (adjusted odds ratio [AOR], 2.28 [1.22-4.27]; risk difference, 4.4 [0-8.8] percentage points), however, the population attributable risk was 0.3 [0-0.6] percentage points. We observed a very high CT utilization rate and a low NAR in metropolitan Seoul. Although the use of CT was significantly associated with the lower NAR, CT utilization rate already has reached the level that increase in CT utilization from the status quo would hardly decrease the NAR further.
Graphical Abstract
Keywords: Appendicitis; Tomography, X-ray Computed; Ultrasonography
INTRODUCTION
Previous studies (1, 2, 3, 4, 5, 6, 7) consistently showed that increases in preoperative imaging utilization coincide with reductions in the negative appendectomy rate (NAR). The use of preoperative imaging in patients with suspected appendicitis is now accepted as the standard of practice in many developed countries. However, important questions still remain regarding how the imaging tests are being used and how they can be better used in practice.
First, the generalizability of the previous studies is uncertain, mostly limited to single institutional studies conducted at leading academic centers in the United States. Considerable regional variations may exist in factors affecting imaging utilization patterns and the NAR, including reimbursement system, patient body habitus, and incidences of alternative diagnoses (8, 9, 10). Second, although several experimental (11) and observational (12, 13) studies as well as meta-analyses (14, 15) demonstrated that CT outperforms ultrasonography in terms of diagnostic performance, there has been no study directly comparing CT and ultrasonography in terms of clinical outcomes such as NAR and appendiceal perforation rate. Third, there has been no study capturing an overview of current imaging utilization patterns, in how the choice of CT versus ultrasonography is made for the initial imaging test, how often complementary ultrasonography (or CT) is needed following the initial CT (or ultrasonography), and how the imaging tests at each of those steps affect clinical outcomes. Fourth, while powerful CT machines became widely available, studies have paid little attention to whether new CT techniques have been truly disseminated throughout clinical practice. Modern CT technology has enabled unprecedentedly superb visualization of the appendix with excellent through-plane resolution and multiplanar capability (16). Attempts have been also made to lower the radiation dose (9).
To this end, we investigated imaging utilization rates and the NAR in 2011 in metropolitan Seoul, Korea.
MATERIALS AND METHODS
This multi-institutional cross-sectional study was conducted by the Low-dOse CT Appendicitis Trial (LOCAT) group (Appendix) (17). The study included adolescents and adults undergoing non-incidental appendectomy in 2011 at 11 hospitals in metropolitan Seoul. Data were collected from medical records as well as from questionnaires and interviews of site investigators by two study coordinators in conjunction with site investigators from November 2012 through April 2013.
Investigating sites
The LOCAT Office invited all members of the Korean Society of Abdominal Radiology (a nationwide society of abdominal radiologists) from 119 hospitals (including 67 in metropolitan Seoul [Seoul and Gyeonggi]) to participate in this study. Finally, eight tertiary and three secondary hospitals with a median bed number of 800 (range, 554-1,950) participated in the study (Appendix Fig. 1, Appendix Table 1). All hospitals were located in metropolitan Seoul, and accounted for 18% of the 63 hospitals having 300 or more beds in metropolitan Seoul (18) where 40,000 appendectomies are performed annually from a total population of 21 million (19).
Patients
We included patients with 15 yr of age or older who visited the site emergency departments and then underwent non-incidental appendectomies from January through December 2011. The site investigators initially searched hospital information systems to identify patients who visited the emergency departments and then underwent appendectomy, cecectomy, or ileocecectomy. In this study, cecectomy and ileocecectomy as well as simple appendectomy performed for the treatment of presumptive appendicitis were collectively termed non-incidental appendectomy. Through medical record review, the study coordinators then excluded cases of incidental appendectomy, age under 15 yr, or pregnant women (Fig. 1).
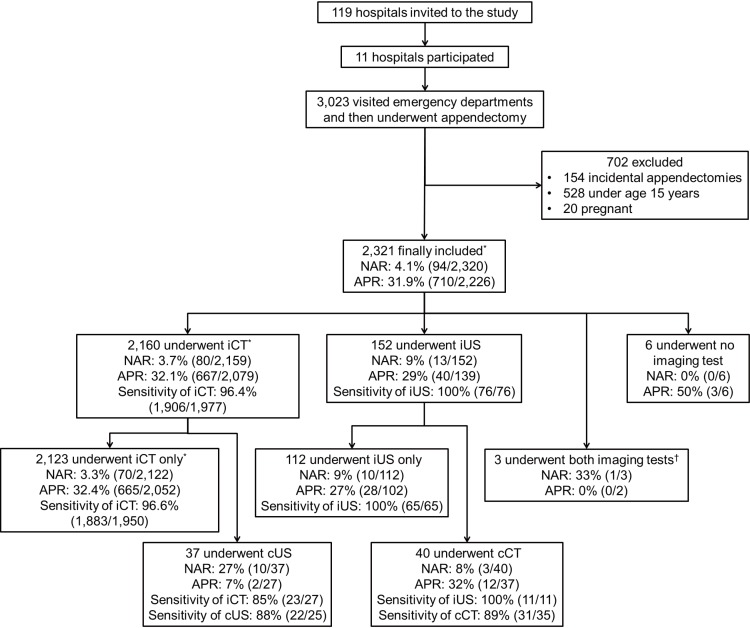
Fig. 1.
Study flow diagram. APR indicates appendiceal perforation rate; cCT, complementary computed tomography; cUS, complementary ultrasonography; iCT, initial computed tomography; iUS, initial ultrasonography; NAR, negative appendectomy rate. Cases with unavailable computed tomography (n = 106) or ultrasonography (n = 67) reports were not included when calculating the sensitivities. When calculating the sensitivities, indeterminate results were counted as a positive diagnosis. *Includes one patient with a missing pathology report; †The order of the two imaging tests was unclear.
Patterns of patient care and imaging protocols
The study coordinators gathered the information using questionnaires and through interviews with site investigators (Appendix).
Imaging utilization rates
The analysis included all imaging examinations performed at the sites or at outside hospitals before the patient transfer to the site emergency departments. The imaging utilization rate was defined as the percentage of any preoperative cross-sectional imaging utilization in all non-incidental appendectomies (1, 3, 5, 20). CT utilization rate was defined as the percentage of CT utilization as the initial imaging modality for all non-incidental appendectomies. Similarly, ultrasonography utilization rate was measured. Our definition of CT (or ultrasonography) utilization rate may be different from those in previous studies (2, 3, 4) which are likely to have included complementary CT (or ultrasonography) following initial ultrasonography (or CT).
Negative appendectomy rate (NAR)
NAR was defined as the percentage of uninflamed appendices in all non-incidental appendectomies (9). The study coordinators determined the presence of appendicitis based on clear documentation of appendicitis or neutrophil infiltration in the appendiceal wall (21) in pathology reports. If neutrophilic collection was confined to the mucosa, the diagnosis was based on the documentation of mucosal ulcerations (22). Cases involving interval appendectomies were counted as cases of appendicitis even if such pathologic documentation was not present. Cases involving appendiceal diverticulitis were also counted as cases of appendicitis since the distinction between the two diseases is not clinically important and the two diseases commonly coexist (23, 24).
Appendiceal perforation rate
Appendiceal perforation rate was defined as the percentage of perforations in all confirmed appendicitis (2, 6, 9, 25). The study coordinators determined the presence of perforation based on spillage of the appendiceal contents, peritonitis, or abscess documented in surgical records; or appendiceal wall defect from transmural necrosis documented in pathologic reports (9). Even if such documentation was not present, cases undergoing interval appendectomies following percutaneous drainage procedures for periappendiceal abscesses were counted as perforations.
Diagnostic sensitivities of imaging modalities
At least 12 weeks after reviewing the pathologic reports and surgical records, the study coordinators categorized all available CT and ultrasonography reports by using a 3-point scale (grade 1, absent; grade 2, indeterminate; or grade 3, present) for the diagnosis of appendicitis (Appendix Table 2). The diagnostic sensitivity was defined as the percentage of positive test results of confirmed appendicitis with two different thresholds: grades ≥2 and only grade 3, as positive. We did not calculate diagnostic specificity, positive predictive value, or negative predictive value as our sample included only patients who underwent appendectomy.
Statistical analysis
The number of cases at the participating sites during the study period determined the sample size. All analyses were pre-planned, except for the test for the interaction and the effect on the study population NAR. Univariable and multivariable subgroup analyses were performed by using logistic regression models involving generalized estimating equations to account for clustering effect by site. In the univariable subgroup analyses, we tested patient demographics, body mass index, time of presentation in the emergency department, the use of CT versus ultrasonography as the initial imaging modality, times needed for patient dispositions, mode of surgical approach, and site annual appendectomy volume. For multivariable models, covariates were selected by considering the potential causality and collinearity in a clinical context. Missing data were not included in the analysis. P values less than 0.05 were considered statistically significant. All statistical analyses were performed using STATA version 12.1 (StataCorp, College Station, TX, USA).
Ethics statement
The institutional review boards at all investigating sites approved the study and waived the requirement for informed consent. (IRB No. KUGH12252-001; AS12192; 13-009; B-1301/188-113; DR13-01; SMC 2013-02-009-001; SCHBC_IRB_2013-11; 2013-009; 2013-02-07; 2013-I024; HYUH 2013-02-002-003)
RESULTS
Patient characteristics
During the study period, 3,023 patients visited the site emergency departments and underwent appendectomy. This number accounted for 7.6% of total appendectomies in metropolitan Seoul during the same period (19). After excluding 702 patients according to the aforementioned criteria, 2,321 patients (46.7% female; median [interquartile range, IQR] age, 37 [27-50] yr) were included (Fig. 1, Table 1). Of these patients, 323 had been included in other studies (9, 26). In 35 cases with original pathology reports inconclusive for the presence of appendicitis, site pathologists re-examined the primary tissue sections. Appendicitis was confirmed in 2,226 patients, including 49 with appendiceal diverticulitis and 13 with appendiceal neoplasms complicated with appendicitis. One case missing the pathology report was not included in some subsequent analyses.
Table 1.
Patient characteristics
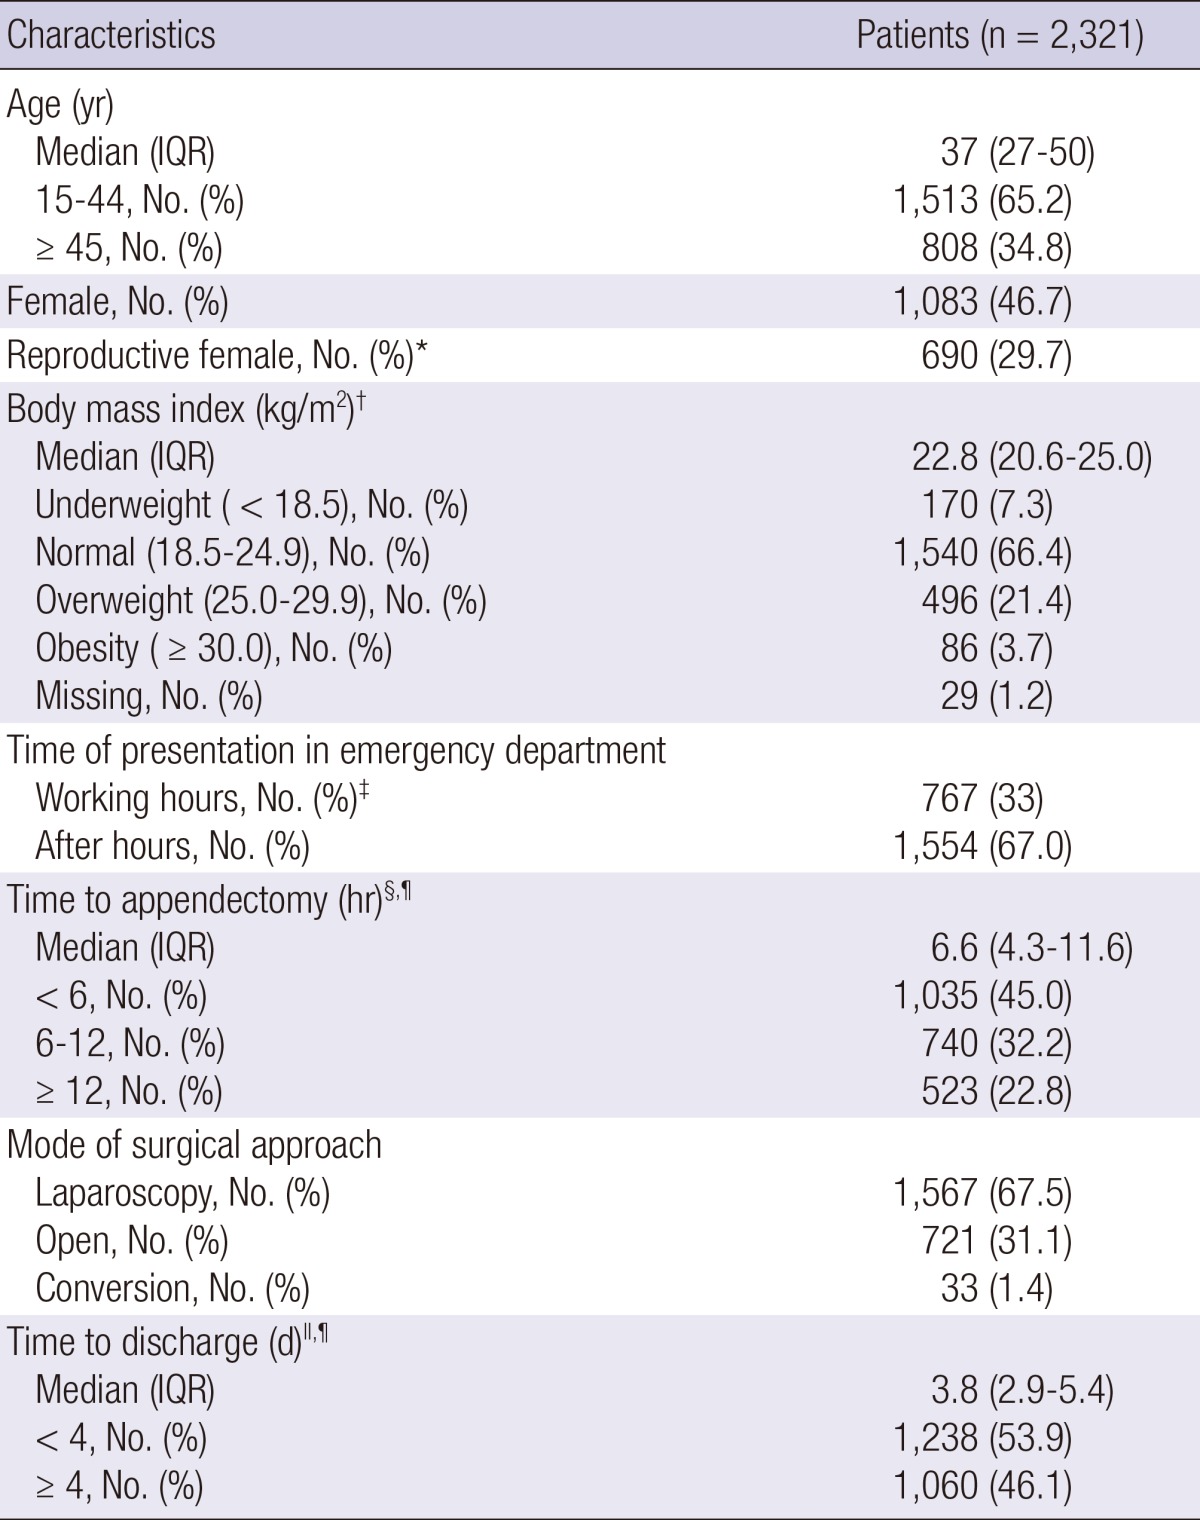
*15-44 yr; †Weight in kilograms divided by the square of height in meters; ‡8:00 AM to 5:00 PM on working days; §Defined as the interval from the emergency department visit to the induction of anesthesia for appendectomy; ∥Defined as the interval from the emergency department visit until hospital discharge; ¶Does not include 23 cases of interval appendectomy. IQR, interquartile range.
Pattern of patient care
The typical pattern of patient care at the sites is described in Appendix, including the number of doctors involved in the patient care (Appendix Table 3). Although the practice pattern was not uniform across the sites, the variations were deemed minor.
CT imaging protocols
Intravenous contrast-enhanced CT examinations of the abdomen and pelvis were performed using 8- or more detector-row machines. No site had any CT order or automated scan program dedicated to appendicitis imaging. Ten sites acquired precontrast and/or arterial phase scans in addition to a portal venous phase scan. All sites used fixed tube potentials: 120 kVp at 10 sites and 100 kVp at one site. One site did not use automatic tube current modulation for all patients and two sites used iterative reconstructions. Image thicknesses for primary interpretation ranged from 3 mm to 5 mm. Only one site used overlapping image reconstruction. Nine sites reconstructed additional thin (≤2 mm) sections. All sites used additional coronal reformation. According to the site investigators' responses to the questionnaire, the typical effective dose of the CT radiation for an average-sized patient varied widely, 8 mSv at one site, exceeding 10 mSv at 10 sites and exceeding 20 mSv at two sites (Table 2).
Table 2.
CT imaging protocols
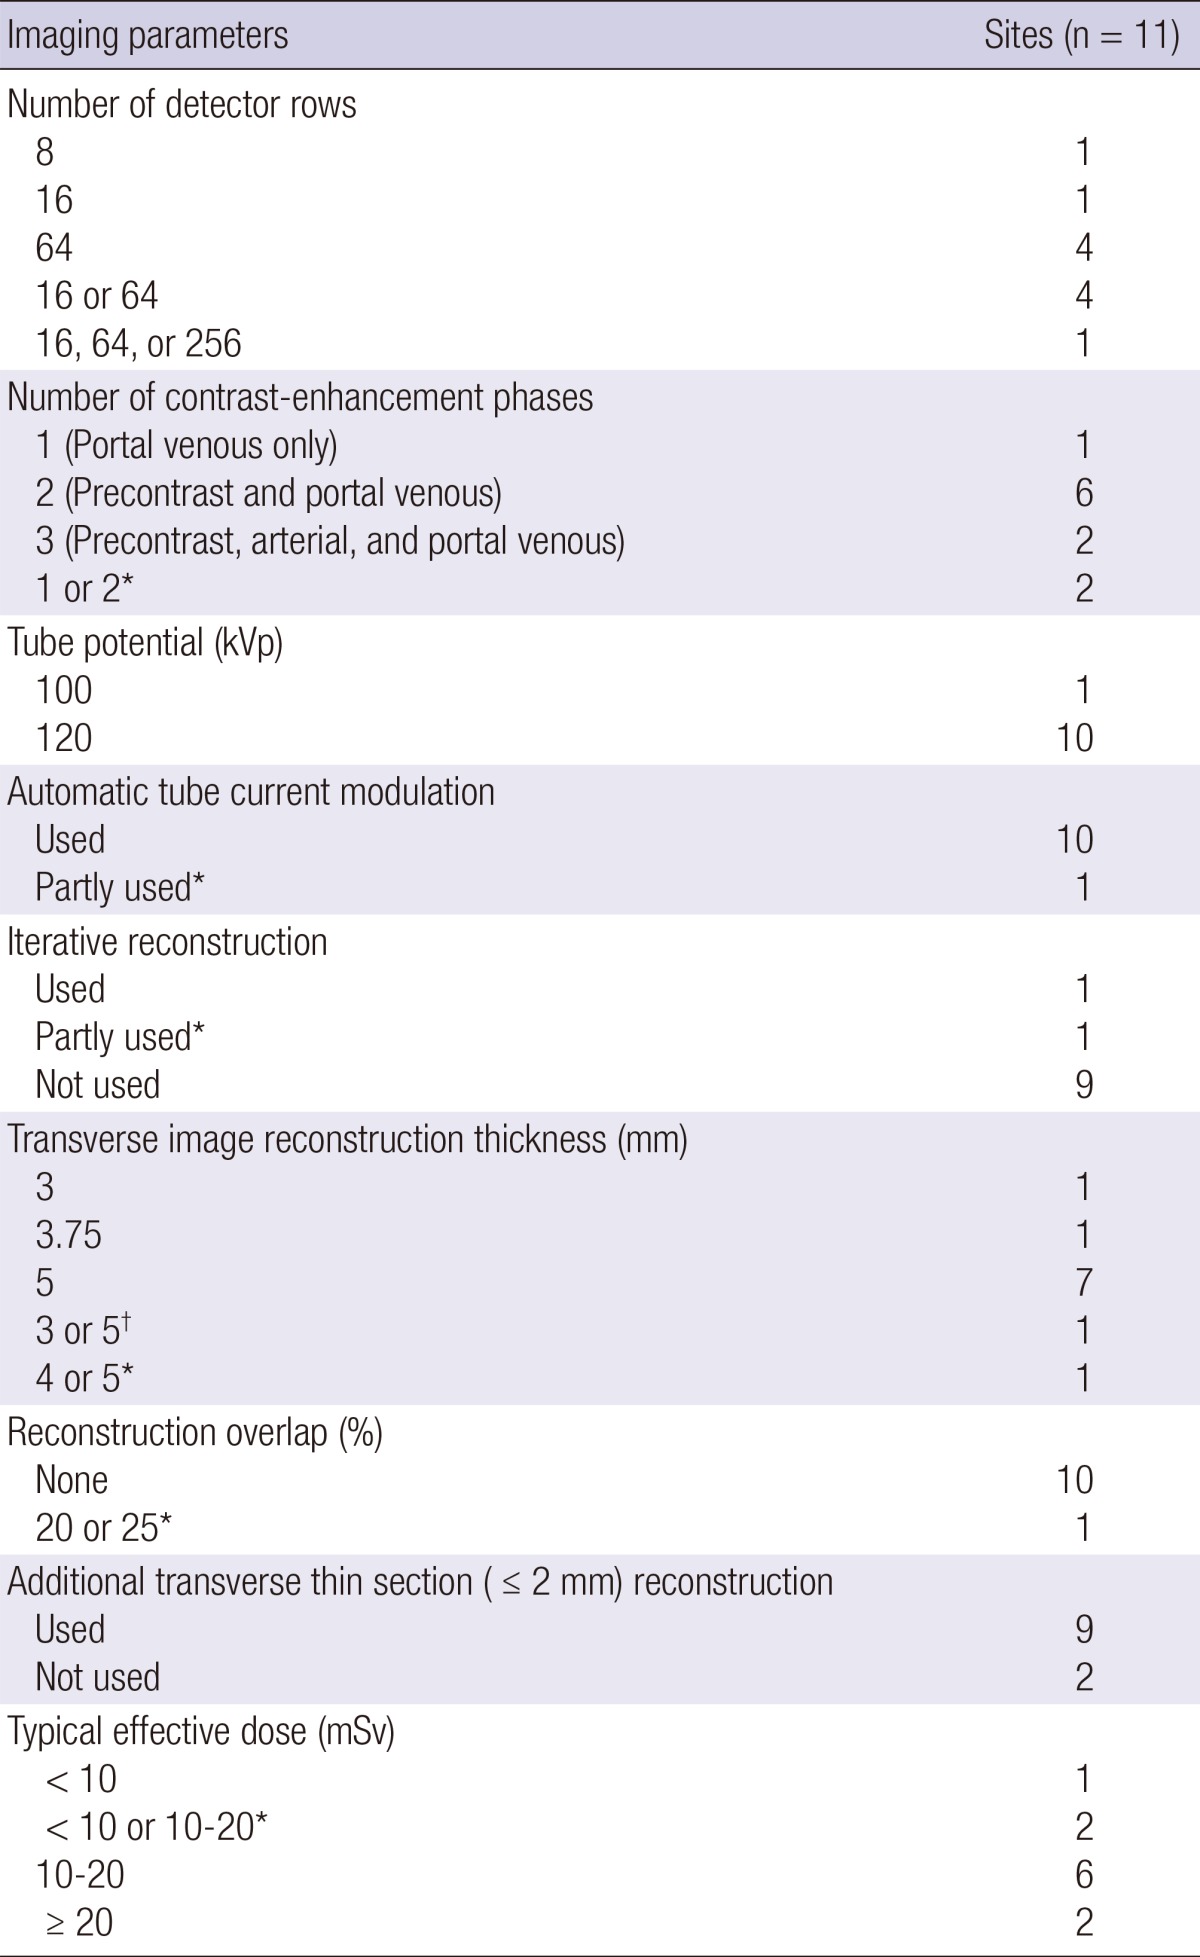
No site had any CT order or automated scan program dedicated to appendicitis imaging. All sites used intravenous contrast agents. No site used oral or rectal contrast agent. The scan range covered the entire abdomen and pelvis at all sites. All sites used additional coronal reformation. *Varied with machine within a site; †Varied with contrast-enhancement phase within a CT examination. CT, computed tomography.
Imaging utilization rates
Imaging utilization rate was 99.7% (95% confidence interval [CI], 99.4%-99.9%; 2,315/2,321). CT was the initial imaging modality for 2,160 patients (CT utilization rate, 93.1% [95% CI, 92.0%-94.1%]), 37 (1.7% [95% CI, 1.2%-2.4%]) of whom underwent subsequent complementary ultrasonography. Ultrasonography was the initial imaging modality for 152 patients (ultrasonography utilization rate, 6.5% [95% CI, 5.6%-7.6%]), 40 (26.3% [95% CI, 19.5%-34.1%]) of whom underwent subsequent complementary CT. In three of the patients who underwent both CT and ultrasonography at outside hospitals, the order of the two imaging examinations was unclear. No patient underwent magnetic resonance imaging. Imaging utilization rates for individual sites and imaging utilization rate adjusted for clustering by site are available in Appendix Table 4. In 238 patients, 214 CT and 31 ultrasonography examinations were performed at outside hospitals (Appendix Table 5).
As virtually all patients underwent CT or ultrasonography, the subgroup analysis results are presented only for ultrasonography utilization rates. Only small differences were observed between subgroups. Relatively higher ultrasonography usage was associated with younger age, female gender, presentation during working hours, and open surgery in the univariable analysis; and with younger age (adjusted odds ratio [AOR], 1.54; 95% CI, 1.04-2.27; P=0.029), female gender (AOR, 1.60; 95% CI, 1.12-2.27; P=0.009), and presentation during working hours (AOR, 2.54; 95% CI, 1.79-3.61; P<0.001) in the multivariable analysis (Table 3).
Table 3.
Subgroup analysis for the ultrasonography utilization rate
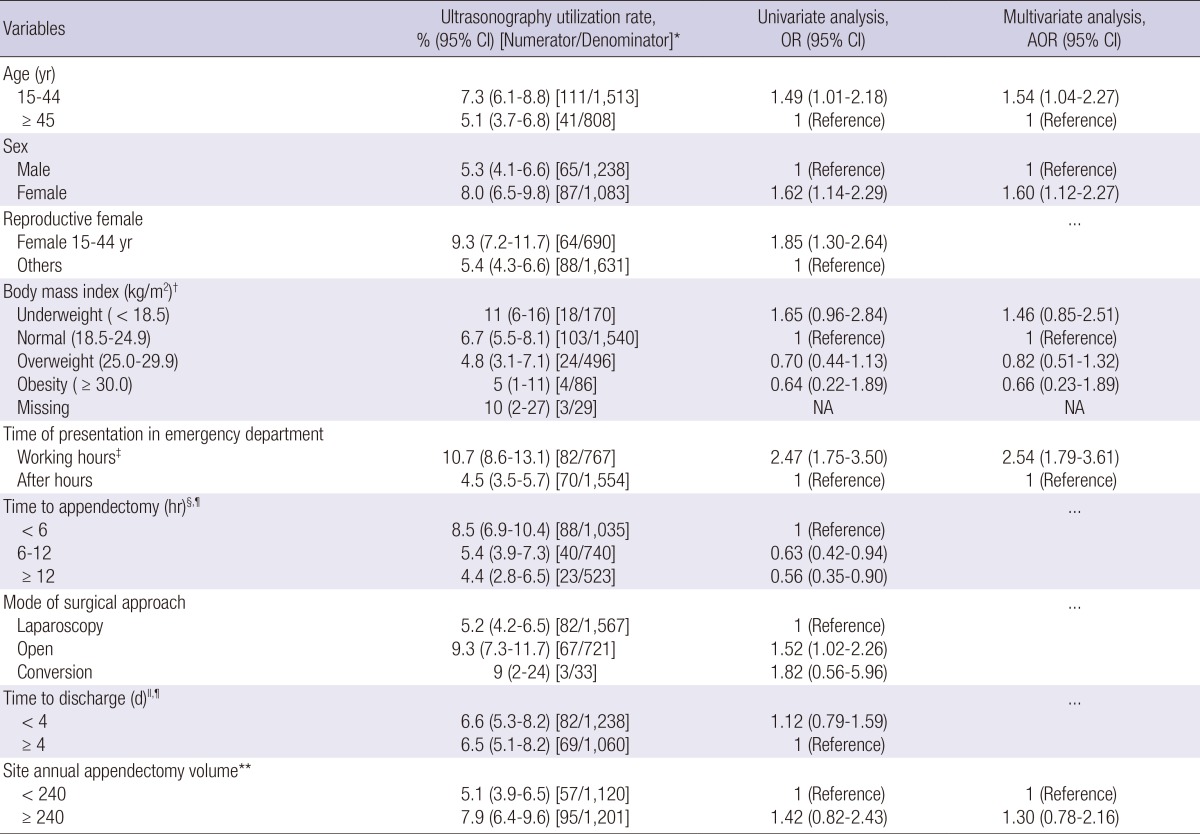
Numerators do not include three patients who underwent both CT and ultrasonography where the order of imaging was unclear. Ellipsis indicates that the variable was not tested in the multivariable analysis. *Defined as the percentage of ultrasonography utilization for an initial imaging test of all non-incidental appendectomies; †Weight in kilograms divided by the square of the height in meters; ‡8:00 AM to 5:00 PM on working days; §Defined as the interval from the emergency department visit to the induction of anesthesia for appendectomy; ∥Defined as the interval from the emergency department visit until hospital discharge; ¶Does not include 23 cases of interval appendectomy; **Number of patients included in the study. AOR, adjusted odds ratio; CI, confidence interval; NA, not applicable; OR, odds ratio.
NAR
The overall NAR was 4.1% (95% CI, 3.3%-4.9%; 94/2,320). If 15 cases of appendiceal neoplasms without appendicitis were excluded from the negative appendectomies, the NAR would decrease to 3.4% (95% CI, 2.7%-4.2%). NARs for individual sites and the overall NAR adjusted for clustering by site are available in Appendix Table 6. The NAR in patients who underwent CT only was 3.3% (95% CI, 2.6%-4.1%). Higher NARs were observed in patients who underwent ultrasonography only (9% [95% CI, 4%-16%]) as well as in patients who required complementary ultrasonography following initial CT (27% [95% CI, 14%-44%]) or complementary CT following initial ultrasonography (8% [95% CI, 2%-20%]) (Fig. 1).
Only small differences in NAR were observed between subgroups. In the univariable analysis, higher NARs were associated with the use of ultrasonography as the initial imaging modality and with longer hospitalization. Although not statistically significant, underweight patients tended to have more negative appendectomies. In the multivariable analysis, the use of ultrasonography instead of CT as the initial imaging modality was significantly associated with the higher NAR (AOR, 2.28; 95% CI, 1.22-4.27; P=0.010) (Table 4). No significant interaction was observed between the use of initial ultrasonography and other factors.
Table 4.
Subgroup analysis for the negative appendectomy rate and appendiceal perforation rate
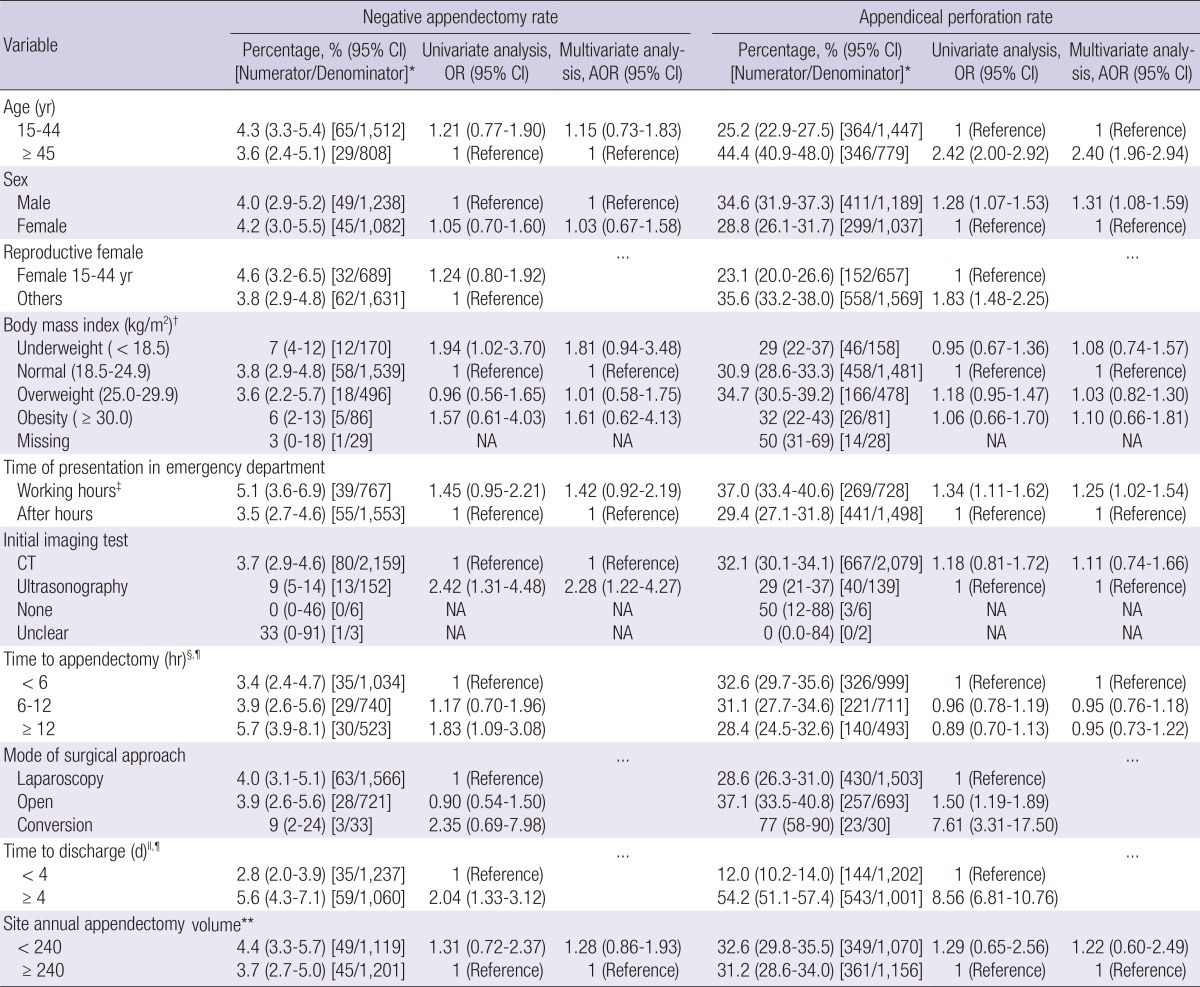
Ellipsis indicates that the variable was not tested in the multivariable analysis. *Does not include one case with a missing pathology report; †Weight in kilograms divided by the square of the height in meters; ‡8:00 AM to 5:00 PM on working days; §Defined as the interval from the emergency department visit to the induction of anesthesia for appendectomy; ∥Defined as the interval from the emergency department visit until hospital discharge; ¶Does not include 23 cases of interval appendectomy; **Number of patients included in the study. AOR, adjusted odds ratio; CI, confidence interval; CT, computed tomography; NA, not applicable or unable to calculate; OR, odds ratio.
Effect of the initial imaging modality on the population NAR
From the AOR, we estimated the effect (27). If ultrasonography instead of CT was used as the initial imaging modality in every 1,000 patients, there would be 44 additional negative appendectomies (risk difference, 4.4 [95% CI, 0-8.8] percentage points). 56% (95% CI, 18%-77%) of negative appendectomies that occurred following initial ultrasonography were attributable to choosing ultrasonography instead of CT as the initial imaging modality (attributable fraction).
With the very high imaging utilization rate and overwhelming preference of CT to ultrasonography in our results, the use of ultrasonography instead of CT would be responsible for three additional negative appendectomies in every 1,000 patients in the study population (population attributable risk, 0.3 [95% CI, 0-0.6] percentage points). Similarly, it would be responsible for 8% (95% CI, 0%-15%) of all negative appendectomies in the study population (population attributable fraction).
Appendiceal perforation rate
The overall appendiceal perforation rate was 31.9% (95% CI, 30.0%-33.9%; 710/2,226). The appendiceal perforation rate at each step of the imaging work-up is detailed in Fig. 1 Appendiceal perforation rates for individual sites and the overall appendiceal perforation rate adjusted for clustering by site are available in Appendix Table 6. The appendiceal perforation rate was particularly low in patients who underwent CT and then complementary ultrasonography (7% [95% CI, 1%-24%]).
Higher appendiceal perforation rates were associated with older age, male gender, presentation during working hours, mode of surgical approach, and longer hospitalization in the univariable analysis; and with older age (AOR, 2.40; 95% CI, 1.96-2.94; P<0.001), male gender (AOR, 1.31; 95% CI, 1.08-1.59; P=0.006), and presentation during working hours (AOR, 1.25; 95% CI, 1.02-1.54; P=0.030) in the multivariable analysis (Table 4). The choice between CT and ultrasonography as the initial imaging modality was not significantly associated with appendiceal perforation in univariable (odds ratio, 1.18; 95% CI, 0.81-1.72) or multivariable (AOR, 1.11; 95% CI, 0.74-1.66) analysis.
Diagnostic sensitivities of imaging modalities
With the indeterminate results counted as positives and negatives, the respective sensitivities were 96.4% (95% CI, 95.5%-97.2%) and 94.0% (95% CI, 92.8%-95.0%; 1,858/1,977) for CT as the initial imaging modality, and 100% (95% CI, 95%-100%) and 92% (95% CI, 84%-97%; 70/76) for ultrasonography as the initial imaging modality, respectively (Fig. 1). The sensitivities for individual sites and overall sensitivities adjusted for clustering by site are available in Appendix Table 7. The subgroup analysis results are available in Appendix Table 8.
DISCUSSION
We attempted to capture an overview of diagnostic imaging pathways and clinical outcomes in patients undergoing appendectomy in one of the most densely populated areas in the world (28). The imaging utilization rate was 99.7%, indicating that virtually all patients undergoing appendectomy underwent preoperative imaging tests, regardless of whether they had typical or equivocal presentations. The rate appears slightly higher than those in 2006-2011 reported from the United States (ranging from 93% to 98%) (1, 3, 4, 5). The minor difference may be associated with regional differences in reimbursement system and incidences of alternative diagnoses (8, 9), in addition to our inclusion of outside imaging tests, of which consideration was unclear in previous studies (1, 3, 5).
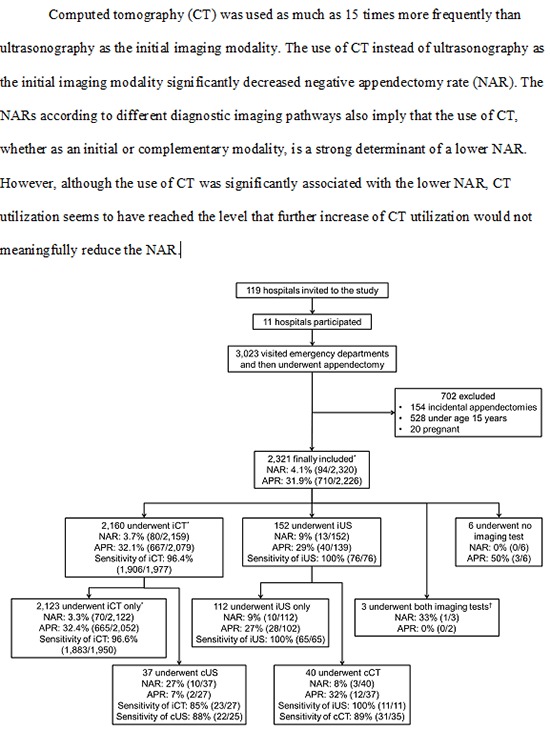
In our results, CT was used as much as 15 times more frequently than ultrasonography as the initial imaging modality, comparable to the ratio in the multi-institutional study from Washington State (91% vs. 9%) (2). The overwhelming preference for CT over ultrasonography may be common in other developed countries. CT performed with modern machines outperforms ultrasonography in terms of rapidity, diagnostic accuracy, and provision of alternative diagnoses (10, 29, 30).
The overall NAR was 4.1%, comparable to those in 2006-2007 from leading academic centers in the United States (ranging from 1.7% to 7.1%) (1, 4, 5) and that in 2011 in Washington State (approximately 4.5%) (3). Importantly, our multivariable analysis revealed that the use of CT instead of ultrasonography as the initial imaging modality significantly decreased NAR. The similar trend can be found in the data from the Washington State study (3), although no formal comparison was made in that study. The NARs according to different diagnostic imaging pathways in our results (Fig. 1) also imply that the use of CT, whether as an initial or complementary modality, is a strong determinant of a lower NAR.
Nevertheless, we are not claiming additional increase of CT utilization. Despite the considerable risk difference and attributable fraction, additional CT utilization would only marginally decrease the NAR further in the population, because virtually all patients are already undergoing preoperative imaging and CT is overwhelmingly preferred to ultrasonography. Had all patients undergone initial CT, only three negative appendectomies for every 1,000 patients, or 8% of all negative appendectomies, would be additionally avoided from the status quo in the study population. This minute reduction in the NAR may not be meaningful, as the NAR we observed was already as low as 4.1%, considerably lower than reported historically (1, 3, 4, 5). We believe our observation can be generalized to other areas having high CT utilization rates similar to ours. In contrast, areas where CT is currently underutilized may have a greater margin for the NAR reduction by means of increased utilization of CT.
On the other hand, concerns should be noted rather regarding the CT radiation. The typical effective doses at the sites often exceeded the reference doses frequently quoted for abdomen and pelvis CT (7-10 mSv) (31, 32, 33). This discrepancy may be common in many CT applications besides appendicitis (34). The typical effective dose exceeded 10 mSv or even 20 mSv at some sites, being close to the range where epidemiologic evidences exist for significant carcinogenic risk (35, 36). Even at the lowest typical dose across the sites (8 mSv), exposure at the age of 30 yr has been estimated to result in a lifetime excess risk of 63 and 72 cancers per 100,000 male and female patients, respectively (9, 37). More than 40,000 and 250,000 appendectomies are performed annually in metropolitan Seoul (19) and in the United States (38), respectively. Very high CT utilization rates and even greater numbers of CT examinations performed in patients who do not finally undergo appendectomy (9, 39) may imply real occurrence of cancer in the future in the populations having normal life expectancy.
Therefore, it is now necessary to consider the radiation dose, in addition to the CT utilization rate and NAR, as an index of quality of care. Hopefully, a diagnostic guideline should be established to determine which patients do not need CT. Efforts are needed to optimize and standardize CT imaging protocols across hospitals by discarding unnecessary scan phases (40) and disseminating low-dose CT techniques (9).
Although we observed comparable diagnostic sensitivities between CT and ultrasonography, our results need cautious interpretation. A considerable number of cases with unavailable reports were not included in the sensitivity calculations. Ultrasonography was used relatively more in subgroups that were more amenable to ultrasonography, who were younger female or presented in working hours. In general, CT is known to be better than ultrasonography in terms of diagnostic performance (14, 15).
Our study had limitations. First, our site recruitment relied on voluntary participation, limiting study generalizability. The participating sites potentially had greater study motivation and more extensive hospital resources than did hospitals not participating. Second, as a limited number of patients underwent initial ultrasonography, we were unable to explore in which patients ultrasonography instead of CT would suffice as the initial imaging modality. Likewise, we were unable to explore which patients do not even require any imaging examination. Third, as our study sample consisted of patients who underwent appendectomy, we were unable to measure the overall imaging utilization pattern in patients having suspected appendicitis. Fourth, we did not analyze alternative diagnoses, as it was unfeasible to form reasonable reference standards in many diagnosis categories.
We observed a very high CT utilization rate and a low NAR in metropolitan Seoul, similar to those recently reported from the United States. In these areas, CT utilization seems to have reached the level that further increase of CT utilization would not meaningfully reduce the NAR. Efforts now need to be directed to optimize and standardize CT imaging protocols and to reduce radiation dose.
Footnotes
The authors have no conflicts of interest to disclose.
This study was supported by grants of the Korean Health Technology R&D Project, Ministry of Health & Welfare, Republic of Korea (No. HI13C00040200), the Dasol Life Science Inc. (No. 06-2013-107) and the Seoul National University Bundang Hospital Research Fund (02-2014-053).
Supplementary Materials
References
- 1.Coursey CA, Nelson RC, Patel MB, Cochran C, Dodd LG, Delong DM, Beam CA, Vaslef S. Making the diagnosis of acute appendicitis: do more preoperative CT scans mean fewer negative appendectomies? a 10-year study. Radiology. 2010;254:460–468. doi: 10.1148/radiol.09082298. [DOI] [PubMed] [Google Scholar]
- 2.Cuschieri J, Florence M, Flum DR, Jurkovich GJ, Lin P, Steele SR, Symons RG, Thirlby R. Negative appendectomy and imaging accuracy in the Washington State Surgical Care and Outcomes Assessment Program. Ann Surg. 2008;248:557–563. doi: 10.1097/SLA.0b013e318187aeca. [DOI] [PubMed] [Google Scholar]
- 3.Drake FT, Florence MG, Johnson MG, Jurkovich GJ, Kwon S, Schmidt Z, Thirlby RC, Flum DR SCOAP Collaborative. Progress in the diagnosis of appendicitis: a report from Washington State's Surgical Care and Outcomes Assessment Program. Ann Surg. 2012;256:586–594. doi: 10.1097/SLA.0b013e31826a9602. [DOI] [PMC free article] [PubMed] [Google Scholar]
- 4.Raja AS, Wright C, Sodickson AD, Zane RD, Schiff GD, Hanson R, Baeyens PF, Khorasani R. Negative appendectomy rate in the era of CT: an 18-year perspective. Radiology. 2010;256:460–465. doi: 10.1148/radiol.10091570. [DOI] [PubMed] [Google Scholar]
- 5.Raman SS, Osuagwu FC, Kadell B, Cryer H, Sayre J, Lu DS. Effect of CT on false positive diagnosis of appendicitis and perforation. N Engl J Med. 2008;358:972–973. doi: 10.1056/NEJMc0707000. [DOI] [PubMed] [Google Scholar]
- 6.Rao PM, Rhea JT, Rattner DW, Venus LG, Novelline RA. Introduction of appendiceal CT: impact on negative appendectomy and appendiceal perforation rates. Ann Surg. 1999;229:344–349. doi: 10.1097/00000658-199903000-00007. [DOI] [PMC free article] [PubMed] [Google Scholar]
- 7.Rhea JT, Halpern EF, Ptak T, Lawrason JN, Sacknoff R, Novelline RA. The status of appendiceal CT in an urban medical center 5 years after its introduction: experience with 753 patients. AJR Am J Roentgenol. 2005;184:1802–1808. doi: 10.2214/ajr.184.6.01841802. [DOI] [PubMed] [Google Scholar]
- 8.Sugihara K, Muto T, Morioka Y, Asano A, Yamamoto T. Diverticular disease of the colon in Japan: a review of 615 cases. Dis Colon Rectum. 1984;27:531–537. doi: 10.1007/BF02555517. [DOI] [PubMed] [Google Scholar]
- 9.Kim K, Kim YH, Kim SY, Kim S, Lee YJ, Kim KP, Lee HS, Ahn S, Kim T, Hwang SS, et al. Low-dose abdominal CT for evaluating suspected appendicitis. N Engl J Med. 2012;366:1596–1605. doi: 10.1056/NEJMoa1110734. [DOI] [PubMed] [Google Scholar]
- 10.Pooler BD, Lawrence EM, Pickhardt PJ. Alternative diagnoses to suspected appendicitis at CT. Radiology. 2012;265:733–742. doi: 10.1148/radiol.12120614. [DOI] [PubMed] [Google Scholar]
- 11.Horton MD, Counter SF, Florence MG, Hart MJ. A prospective trial of computed tomography and ultrasonography for diagnosing appendicitis in the atypical patient. Am J Surg. 2000;179:379–381. doi: 10.1016/s0002-9610(00)00372-x. [DOI] [PubMed] [Google Scholar]
- 12.Pickuth D, Heywang-Köbrunner SH, Spielmann RP. Suspected acute appendicitis: is ultrasonography or computed tomography the preferred imaging technique? Eur J Surg. 2000;166:315–319. doi: 10.1080/110241500750009177. [DOI] [PubMed] [Google Scholar]
- 13.Balthazar EJ, Birnbaum BA, Yee J, Megibow AJ, Roshkow J, Gray C. Acute appendicitis: CT and US correlation in 100 patients. Radiology. 1994;190:31–35. doi: 10.1148/radiology.190.1.8259423. [DOI] [PubMed] [Google Scholar]
- 14.Van Randen A, Bipat S, Zwinderman AH, Ubbink DT, Stoker J, Boermeester MA. Acute appendicitis: meta-analysis of diagnostic performance of CT and graded compression US related to prevalence of disease. Radiology. 2008;249:97–106. doi: 10.1148/radiol.2483071652. [DOI] [PubMed] [Google Scholar]
- 15.Terasawa T, Blackmore CC, Bent S, Kohlwes RJ. Systematic review: computed tomography and ultrasonography to detect acute appendicitis in adults and adolescents. Ann Intern Med. 2004;141:537–546. doi: 10.7326/0003-4819-141-7-200410050-00011. [DOI] [PubMed] [Google Scholar]
- 16.Lee KH, Kim YH, Hahn S, Lee KW, Lee HJ, Kim TJ, Kang SB, Shin JH, Park BJ. Added value of coronal reformations for duty radiologists and for referring physicians or surgeons in the CT diagnosis of acute appendicitis. Korean J Radiol. 2006;7:87–96. doi: 10.3348/kjr.2006.7.2.87. [DOI] [PMC free article] [PubMed] [Google Scholar]
- 17.Ahn S LOCAT group. LOCAT (low-dose computed tomography for appendicitis trial) comparing clinical outcomes following low- vs standard-dose computed tomography as the first-line imaging test in adolescents and young adults with suspected acute appendicitis: study protocol for a randomized controlled trial. Trials. 2014;15:28. doi: 10.1186/1745-6215-15-28. [DOI] [PMC free article] [PubMed] [Google Scholar]
- 18.Health Insurance Review & Assessment Service of Korea. Hospital survey. [accessed on 21 May 2013]. Available at http://www.hira.or.kr/main.do.
- 19.National Health Insurance Service. 2011 statistics on major surgeries in Korea. [accessed on 20 May 2013]. Available at http://www.bokjiro.go.kr/data/statusView.do?board_sid=297&data_sid=5999111.
- 20.Saito JM, Yan Y, Evashwick TW, Warner BW, Tarr PI. Use and accuracy of diagnostic imaging by hospital type in pediatric appendicitis. Pediatrics. 2013;131:e37–e44. doi: 10.1542/peds.2012-1665. [DOI] [PMC free article] [PubMed] [Google Scholar]
- 21.Rosai J. Appendix. In: Rosai J, editor. Rosai and Ackerman's surgical pathology. 9th ed. Edinburgh: Mosby; 2004. pp. 758–759. [Google Scholar]
- 22.Fenoglio-Preiser CM, Noffsinger AE, Stemmermann GN, Lantz PE, Isaacson PG. Nonneoplastic diseases of the appendix. In: Fenoglio-Preiser CM, Noffsinger AE, Stemmermann GN, Lantz PE, Isaacson PG, editors. Gastrointestinal pathology: an atlas and text. 3rd ed. Philadelphia: Lippincott Williams & Wilkins; 2008. pp. 504–505. [Google Scholar]
- 23.Lee KH, Lee HS, Park SH, Bajpai V, Choi YS, Kang SB, Kim KJ, Kim YH. Appendiceal diverticulitis: diagnosis and differentiation from usual acute appendicitis using computed tomography. J Comput Assist Tomogr. 2007;31:763–769. doi: 10.1097/RCT.0b013e3180340991. [DOI] [PubMed] [Google Scholar]
- 24.Phillips BJ, Perry CW. Appendiceal diverticulitis. Mayo Clin Proc. 1999;74:890–892. doi: 10.4065/74.9.890. [DOI] [PubMed] [Google Scholar]
- 25.Flum DR, Morris A, Koepsell T, Dellinger EP. Has misdiagnosis of appendicitis decreased over time? a population-based analysis. JAMA. 2001;286:1748–1753. doi: 10.1001/jama.286.14.1748. [DOI] [PubMed] [Google Scholar]
- 26.Sim JY, Kim HJ, Yeon JW, Suh BS, Kim KH, Ha YR, Paik SY. Added value of ultrasound re-evaluation for patients with equivocal CT findings of acute appendicitis: a preliminary study. Eur Radiol. 2013;23:1882–1890. doi: 10.1007/s00330-013-2769-2. [DOI] [PubMed] [Google Scholar]
- 27.Greenland S. Applications of stratified analysis methods. In: Rothman KJ, Greenland S, Lash TL, editors. Modern epidemiology. 3rd ed. Philadelphia: Lippincott Williams & Wilkins; 2008. pp. 283–302. [Google Scholar]
- 28.Wikipedia. Population density. [accessed on 20 January 2014]. Available at http://en.wikipedia.org/wiki/Population_density.
- 29.Paulson EK, Kalady MF, Pappas TN. Clinical practice. Suspected appendicitis. N Engl J Med. 2003;348:236–242. doi: 10.1056/NEJMcp013351. [DOI] [PubMed] [Google Scholar]
- 30.Birnbaum BA, Wilson SR. Appendicitis at the millennium. Radiology. 2000;215:337–348. doi: 10.1148/radiology.215.2.r00ma24337. [DOI] [PubMed] [Google Scholar]
- 31.National Council on Radiation Protection and Measurements. Ionizing radiation exposure of the population of the United States: NCRP Report No. 160. Bethesda: National Council on Radiation Protection and Measurements; 2009. [Google Scholar]
- 32.Brix G, Nagel HD, Stamm G, Veit R, Lechel U, Griebel J, Galanski M. Radiation exposure in multi-slice versus single-slice spiral CT: results of a nationwide survey. Eur Radiol. 2003;13:1979–1991. doi: 10.1007/s00330-003-1883-y. [DOI] [PubMed] [Google Scholar]
- 33.Hart D, Wall BF, Hiller MC, Shrimpton PC. Frequency and collective dose for medical and dental X-ray examinations in the UK, 2008. Chilton: Health Protection Agency; 2010. [Google Scholar]
- 34.Smith-Bindman R, Lipson J, Marcus R, Kim KP, Mahesh M, Gould R, Berrington de González A, Miglioretti DL. Radiation dose associated with common computed tomography examinations and the associated lifetime attributable risk of cancer. Arch Intern Med. 2009;169:2078–2086. doi: 10.1001/archinternmed.2009.427. [DOI] [PMC free article] [PubMed] [Google Scholar]
- 35.Preston DL, Ron E, Tokuoka S, Funamoto S, Nishi N, Soda M, Mabuchi K, Kodama K. Solid cancer incidence in atomic bomb survivors: 1958-1998. Radiat Res. 2007;168:1–64. doi: 10.1667/RR0763.1. [DOI] [PubMed] [Google Scholar]
- 36.Brenner DJ, Hall EJ. Computed tomography: an increasing source of radiation exposure. N Engl J Med. 2007;357:2277–2284. doi: 10.1056/NEJMra072149. [DOI] [PubMed] [Google Scholar]
- 37.National Academy of Sciences. Health risks from exposure to low levels of ionizing radiation: biological effects of ionizing radiation VII phase 2. Washington, D.C.: National Research Council of the National Academies; 2005. [Google Scholar]
- 38.Owings MF, Kozak LJ. Ambulatory and inpatient procedures in the United States, 1996. Vital Health Stat 13. 1998;(139):1–119. [PubMed] [Google Scholar]
- 39.Pickhardt PJ, Lawrence EM, Pooler BD, Bruce RJ. Diagnostic performance of multidetector computed tomography for suspected acute appendicitis. Ann Intern Med. 2011;154:789–796. doi: 10.7326/0003-4819-154-12-201106210-00006. [DOI] [PubMed] [Google Scholar]
- 40.Guite KM, Hinshaw JL, Ranallo FN, Lindstrom MJ, Lee FT., Jr Ionizing radiation in abdominal CT: unindicated multiphase scans are an important source of medically unnecessary exposure. J Am Coll Radiol. 2011;8:756–761. doi: 10.1016/j.jacr.2011.05.011. [DOI] [PMC free article] [PubMed] [Google Scholar]
Associated Data
This section collects any data citations, data availability statements, or supplementary materials included in this article.


