Abstract
Praziquantel (PZQ), prescribed as a racemic mixture, is the most readily available drug to treat schistosomiasis. In the present study, ultra-performance liquid chromatography coupled with electrospray ionization quadrupole time-of-flight mass spectrometry (UPLC-ESI-QTOFMS) based metabolomics was employed to decipher the metabolic pathways and enantioselective metabolic differences of PZQ. Many phase I and four new phase II metabolites were found in urine and feces samples of mice 24h after dosing indicating that the major metabolic reaction encompassed oxidation, dehydrogenation, and glucuronidation. Differences in the formation of all these metabolites were observed between (R)-PZQ and (S)-PZQ. In an in vitro phase I incubation system, the major involvement of CYP3A, CYP2C9, and CYP2C19 in the metabolism of PZQ, and CYP3A, CYP2C9, and CYP2C19 exhibited different catalytic activity towards the PZQ enantiomers. Apparent Km and Vmax differences were observed in the catalytic formation of three mono-oxidized metabolites by CYP2C9 and CYP3A4 further supporting the metabolic differences for PZQ enantiomers. Molecular docking showed that chirality resulted in differences in location and conformation, which likely accounts for the metabolic differences. In conclusion, in silico, in vitro, and in vivo methods revealed the enantioselective metabolic profile of praziquantel.
Keywords: cytochromes P450, enantioselective metabolism, in silico metabolomics, praziquantel
1. Introduction
Schistosomiasis, the second most prevalent parasitic disease after malaria, has been estimated to affect 207 million people [1]. Praziquantel (PZQ) is the cheapest, easiest to use and most readily available drug among all the currently available schistosomicides [2]. However, its utilization is limited by many disadvantages, including decreased susceptibility of Schistosoma mansoni towards PZQ [3]. PZQ has poor metabolic stability (t1/2=1h to 3h), and undergoes the extensive first-pass metabolism [4]. Mono- and di-oxidized PZQ were identified to be the main metabolites using liver microsomes [4] and isolated rat hepatocytes [5]. However, the complete metabolite profile of PZQ remains unclear, including the identity of the phase II metabolites of PZQ. Drug-metabolizing enzymes involved in the elimination of PZQ in rat liver microsomes have been investigated, revealing that cytochromes P450 (CYP) CYP1A2, CYP2E1, CYP2C9 and CYP2D6 probably do not significantly contribute to phase I metabolism of PZQ in rat [6]. Others found that CYP1A2, CYP2C19 and CYP3A4/5 were responsible for the metabolism of PZQ by the comparison of the consumption of PZQ among different recombinant CYPs [7]. Inhibitors of CYPs excluded the involvement of CYP1A and CYP2C [6], but the complex in vivo factors (e.g. drug-drug interactions) and the specificity of these inhibitors might complicate interpretation of these results. Additionally, both inhibitors and inducers of CYP3A can affect the in vivo exposure of PZQ [8, 9], indicating the involvement of CYP3A in the metabolism of PZQ. Taken together, the metabolic pathway of PZQ still remains unclear, and needs to be further clarified, including the complete metabolic profile and the involvement of specific enzymes.
PZQ is a chiral compound marketed as a racemic mixture (Figure 1). The major pharmacological activity is ascribed to (R)-PZQ, but no evidence has been obtained to exclude the efficacy of (S)-PZQ [10–12]. The same activity was obtained with the single administration of 20 mg/kg of (R)-PZQ and 40 mg/kg of the racemic PZQ [(R,S)-PZQ], while fewer side effects were observed in the (R)-PZQ treatment group [10]. The difference in metabolic elimination of the two enantiomers has been studied and systemic levels of (S)-PZQ were reported to be higher than those of (R)-PZQ [13]. In isolated rat hepatocytes, (R)-PZQ produced cis- and trans-4-hydroxy-PZQ, whereas (S)-PZQ produced additional unknown metabolites [5]. However, details of the metabolic differences between (R)- and (S)-PZQ remain unclear.
Figure 1.

The chemical structures of PZQs. A. The chemical structure of (R, S)-PZQ; B. The chemical structure of (S)-PZQ; C. The chemical structure of (R)-PZQ.
Metabolomics has been evolving as an important tool to study drug metabolism, and has been applied in the study of several drugs, such as N, N′, N″-triethylenethiophosphoramide (ThioTEPA) [14] and arecoline [15]. Compared with traditional metabolite identification methods, metabolomics can yield the full spectrum of metabolites, even those with relatively low abundance, which facilitates the elucidation of novel metabolic pathways [16]. Importantly, metabolomics-based metabolic mapping has been employed to detect reactive metabolites produced at very low abundance [17, 18]. In the present study, ultraperformance chromatography-electrospray ionization-quadrupole time-of-flight mass spectrometry (UPLC-ESI-QTOFMS)-based metabolomics was used to (i) Elucidate the complete metabolic pathway of PZQ, including identification of all phase I and phase II metabolites, and (ii) Comparison of differences in the metabolic pathways between (R)-PZQ and (S)-PZQ. The possible mechanism for these differences is discussed.
2. Materials and Methods
2.1 Chemicals and reagents
(R,S)-PZQ, (R)-PZQ, (S)-PZQ and 4-hydroxyl-PZQ were synthesized by Prof. Dequn Sun et al (Marine College, Shandong University at Weihai). The enantiomeric excess values of (R)-PZQ and (S)-PZQ were >99% by HPLC. β-Nicotinamide adenine dinucleotide 2′-phosphate reduced tetrasodium salt (NADPH) was purchased from Sigma-Aldrich (St. Louis, MO, USA). All other reagents were of the highest grade commercially available.
2.2 In vivo treatment of mice with (R, S)-PZQ, (R)-PZQ and (S)-PZQ and sample preparation
To investigate in vivo metabolic behavior of PZQ, eighteen 6- to 8-week-old male 129/Sv mice were divided into four groups: control (n=4), (R, S)-PZQ (n=4), (R)-PZQ (n=5) and (S)-PZQ (n=5). (R, S)-PZQ, (R)-PZQ and (S)-PZQ, dissolved in corn oil, were administered by oral gavage at a dose of 40mg/kg body weight, respectively. Control mice were treated with corn oil alone. All studies involving animals were under protocols following Animal Research: Reporting of In Vivo Experiments (ARRIVE) guidelines. Mouse handling was performed in accordance with an animal study protocol approved by the National Cancer Institute Animal Care and Use Committee. The mice were maintained under a standard 12 h light, 12 h dark cycle with water and chow provided ad libitum. The blood, urine, and feces (24 h) were collected for analysis. Urine and feces samples were collected using metabolic cages (Metabowls, Jencons Scientific USA, Bridgeville, PA), and blood samples collected in BD microtainer serum separator tubes (Franklin Lakes, NJ) by retroorbital bleeding. Blood samples were centrifuged for 15 min at 8000×g. Serum (5 μl) was diluted with 195 μl of 66% aqueous acetonitrile containing 5 μM chlorpropamide. Urine samples were prepared by mixing 5 μl of urine with 195 μl of 50% aqueous acetonitrile containing 5 μM chlorpropamide. The feces were pulverized and 1:20 50% aqueous acetonitrile (5 μM chlorpropamide) were added for extraction followed by centrifugation. All samples were centrifuged at 14,000×g for 15 min, and 5 μl aliquot of the supernatants was injected into a Waters UPLC-ESI-QTOFMS system (Waters Corporation, Milford, MA).
2.3 In vitro phase I metabolism of (R, S)-PZQ, (R)- and (S)-PZQ in liver microsomes (LM), intestine microsomes (IM) and recombinant drug-metabolizing enzymes
Human liver microsomes (HLM) and human intestine microsomes (HIM) were purchased from BD Gentest Corp. (Woburn, MA). Livers and intestines from five untreated 6- to 8-week-old age male 129/Sv mice were homogenized, and mouse liver microsomes (MLM) and mouse intestine microsomes (MIM) were prepared as previously described [19]. The phase I incubation system (200 μl) contained 50 mM Tris-HCl buffer solution (pH=7.4), 0.5 mg/ml of HLM, MLM, HIM, or MIM, 5 mM MgCl2, 100 μM PZQ [or (R)-PZQ or (S)-PZQ]. After 5 min- of pre-incubation at 37 °C, 1 mM of freshly prepared NADPH was added. After 1 h incubation at 37°C, the reaction was terminated using 200 μl cold 50% aqueous methanol containing 5 μM chlorpropamide. After centrifuging at 14,000×g for 15 min, an aliquot (5 μl) of the supernatant was injected into a UPLC-ESI-QTOFMS. The in vitro incubation system for recombinant phase I enzymes was similar to the microsomal incubation system. Recombinant CYP1A1, CYP1A2, CYP1B1, CYP2A6, CYP2B6, CYP2C8, CYP2C9, CYP2C9*2, CYP2C9*3, CYP2C19, CYP2D6, CYP3A4, CYP3A5, CYP3A7, CYP2E1, FMO-1, FMO-3, FMO-5 were purchased from BD Gentest (Woburn, MA, USA). Recombinant CYPs at 2 pmol, and 5 μg of FMOs were incubated with 100 μM of PZQ. The reaction time was typically 1 h and metabolites were analyzed using UPLC-ESI-QTOFMS.
2.4 Kinetic study of metabolites formation for selected recombinant enzymes
Enzyme activity was measured in incubation with (R, S)-PZQ and PZQ enantiomers. The conditions for linearity with respect to time and protein concentration were optimized in preliminary studies. The incubation time was 20 min and the protein concentration was 1 pmol. Enzymatic kinetic reactions for metabolites formation were performed with different concentrations of (R, S)-PZQ (2–150 μM), (R)-PZQ (2–107 μM) and (S)-PZQ (2–115 μM) for CYP2C9 and CYP3A4. The other conditions were the same as described in section 2.2. The apparent Vmax and Km values were calculated from nonlinear regression analysis of experimental data according to the Michaelis-Menten equation.
2.5 UPLC-ESI-QTOFMS analysis
An Acquity C18 BEH UPLC column (Waters Corporation) was employed to separate components in serum, urine, feces and microsomal incubation samples. The mobile phase consisted of water containing 0.1% formic acid (A) and acetonitrile containing 0.1% formic acid (B). The following gradient condition was used: 100% A for 0.5 min, increased to 100% B over the next 7.5 min and returned to 100% A in last 2 min. The flow rate of the mobile phase was set at 0.5 ml/min. Data were collected in the positive ion mode on a Waters Q-Tof Premier mass spectrometer, which was operated in full-scan mode at 50–850 m/z. Nitrogen was used as both cone gas (50 l/h) and desolvation gas (600 l/h). Source desolvation temperatures were set at 120 °C and 350 °C, respectively. The capillary voltage and cone voltage was 3000 and 20 V, respectively. The structures of metabolites were elucidated by tandem MS fragmentography with collision energies ranging from 15 to 40 eV.
2.6 Data processing and multivariate data analysis (MDA)
MarkerLynx software (Waters Corp.) was used to deconvolute the chromatographic and mass spectrometric data. A multivariate data matrix containing information on sample identity, ion identity (Rt and m/z), and ion abundance was generated through centroiding, deisotoping, filtering, peak recognition, and integration. The data matrix was further analyzed using SIMCA-13.0 software (Umetrics, Kinnelon, NJ). Principal components analysis (PCA) was used on Pareto-scaled data to examine the separation of (R, S)-PZQ treatment group, (R)-PZQ treatment group and (S)-PZQ treatment group in mouse. Potential metabolites were identified by analyzing the ions contributing to the separation of sample groups in the loading scatter plots.
2.7 Docking Methods
The human CYP3A4 structure (PDB Code: 2V0M) and human CYP2C9 structure (PDB Code: 1OG5) were obtained from the Protein Data Bank (http://www.rcsb.org/pdb). The two dimensional structures of drug molecules used in this work were generated using ChemDraw with standard bond lengths and angles. The Tripos force field was employed to minimize the molecular energy and search the most stable conformation by the Powell conjugate gradient algorithm with a convergence criterion of 0.001 kcal/mol. The energy gradient limit was set at 0.05 kcal/mol*Å. The partial charges of the compounds were calculated using Gasteiger-Huckel method, which were done using SYBYL-X program. The covalently-bound ligands in both CYP3A4 and CYP2C9 crystal structures were removed from their crystal structure, respectively. Docking of ligands into the catalytic domain of the CYP3A4 and CYP2C9 model was carried out using Surflex-Dock (within Sybyl-X1.2, Tripos International). The protocol was generated using the automated method, a threshold of 0.50 and a bloat value of 2. The Surflex-Dock mode was used, all other parameters were at default values. The chemscore function was used to rank the docked compound poses, and the top 20 ranked poses for each compound were examined visually. All the ligands are flexible compounds that can adopt a multitude of conformations within the active site of CYP3A4 and CYP2C9. To ensure that reasonable docked poses were obtained, the docked conformations of ligands in the protein were compared to the conformation of the inhibitor seen in the corresponding crystal structure.
2.8 Statistical analysis
The experimental data were presented as mean±S.E.M. Comparisons between two groups were performed using a two-tailed unpaired Student’s t test.
3. Results
3.1 Metabolic profiling of PZQ in mice
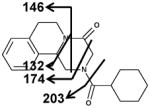
As shown in the scores scatter plot, urine samples (Figure 2A) and feces samples (unpublished data) from the PZQ-treated Sv/129 mice were significantly separated from the control group. Loading scatter analysis of the samples suggested some potential PZQ metabolites and their fragments (Figure 2B). The relative abundance of each metabolite in urine was determined (Figure 2C). The chemical structures of these metabolites were further identified based on the accurate mass measurements and MS/MS fragmentography. Overall, PZQ (I) and fifteen metabolites were identified in the urine and feces samples from mice (Table 1). The PZQ parent compound eluted at 5.8 min with an ion of [M+H]+= 313.193 m/z, in agreement with a match for C19H24N2O2 with a mass error of 2.9 ppm. The main MS/MS fragmentation ions of PZQ contained 203, 174, 146 and 132, with the fragmentation pattern shown in Figure 3 and Table 2. Ions II-XII were proposed to be the phase I metabolites of PZQ, including six mono-oxidized metabolites (II-VII), two dehydrogenated mono-oxidized metabolites (VIII-IX), and three dioxidized metabolites (X-XII). Four novel glucuronide metabolites (G1-G4) were also identified. The MS/MS spectrums of PZQ and representative metabolites were shown in Figure 3, and the complete MS/MS spectra for all the metabolites are given in Table 2.
Figure 2.
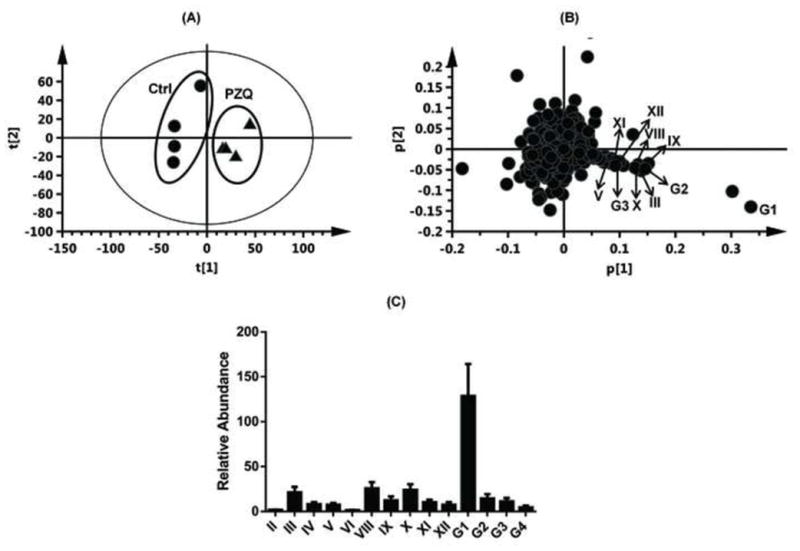
Identification of PZQ metabolites in male 129/Sv mice after oral gavage of (R, S)-PZQ (40mg/kg body weight). Scores plot of the PCA mode (A) and loading scatter plot (B) of urine ions from control and the (R, S)-PZQ-treated mice. The relative abundance of every metabolite in urine from (R, S)-PZQ-treated mice (C). The p(corr)[1] values represent the interclass difference, and the p[1] values represent the relevant abundance of ions.
Table 1.
List of detected metabolites in urine and feces of mice after oral gavage of 40 mg/kg PZQ.
| Symbol | RT (min) | Observed m/z | Formula | Mass error (ppm) | Identity | Source |
|---|---|---|---|---|---|---|
| I | 5.80 | 313.193 | C19H24N2O2 | 2.9 | PZQ | feces |
| II | 4.35 | 329.186 | C19H24N2O3 | 1.5 | Mono-oxidized PZQ | urine, feces |
| III | 4.56 | 329.187 | C19H24N2O3 | 1.5 | Mono-oxidized PZQ | urine, feces |
| IV | 4.85 | 329.186 | C19H24N2O3 | 1.5 | Mono-oxidized PZQ | urine, feces |
| V | 5.16 | 329.186 | C19H24N2O3 | 1.5 | Mono-oxidized PZQ | urine, feces |
| VI | 5.30 | 329.187 | C19H24N2O3 | 1.5 | Mono-oxidized PZQ | urine, feces |
| VII | 5.45 | 329.188 | C19H24N2O3 | 1.5 | Mono-oxidized PZQ | feces |
| VIII | 3.17 | 327.173 | C19H22N2O3 | 6.4 | Dehydrogenated mono-oxidized PZQ | urine, feces |
| IX | 5.06 | 327.171 | C19H22N2O3 | 0.3 | Dehydrogenated mono-oxidized PZQ | urine, feces |
| X | 3.78 | 345.184 | C19H24N2O4 | 7.5 | Di-oxidized PZQ | urine, feces |
| XI | 3.34 | 345.182 | C19H24N2O4 | 1.7 | Di-oxidized PZQ | urine, feces |
| XII | 3.55 | 345.181 | C19H24N2O4 | −1.2 | Di-oxidized PZQ | urine, feces |
| G1 | 4.46 | 505.218 | C25H32N2O9 | −1.2 | Mono-oxidized PZQ glucuronide | urine |
| G2 | 4.95 | 503.204 | C25H30N2O9 | 2.0 | Dehydrogenated mono-oxidized PZQ glucuronide | urine |
| G3 | 3.96 | 521.215 | C25H32N2O10 | 2.9 | Di-oxidized PZQ glucuronide | urine |
| G4 | 2.89 | 521.213 | C25H32N2O10 | −1.0 | Di-oxidized PZQ glucuronide | urine |
Figure 3.
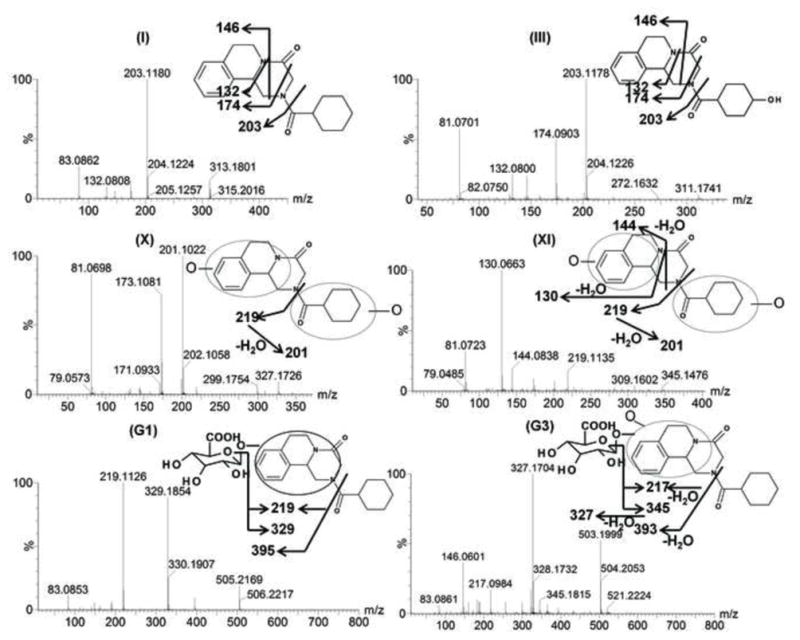
Tandem MS spectrum and proposed chemical structures of PZQ (I) and its representative metabolites (III, X, XI, G1, G3). III, X, XI, G1, G3 represents mono-oxidized PZQ, di-oxidized PZQ, di-oxidized PZQ, mono-oxidized PZQ glucuronide and di-oxidized PZQ glucuronide, respectively.
Table 2.
MS/MS fragmentation and predicted structures of PZQ’s metabolites.
| I ((R, S)-PZQ) | II | III |
|

|

|
| Fragments: 203,174,146,132 | Fragments: 219 | Fragments: 203,174,146,132 |
| IV | V | VI |
|

|

|
| Fragments: 311,203 | Fragments: 219 | Fragments: 219 |
| VII | VIII | IX |

|

|

|
| Fragments: 219, 201 | Fragments: 144, 130 | Fragments: 201 |
| X | XI | XII |

|

|

|
| Fragments: 219, 201 | Fragments: 219, 201, 144, 130 | Fragments: 219, 201, 144, 130 |
| G1 | G2 | G3 |

|
|

|
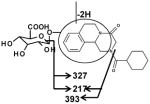
| Fragments: 395, 329, 219 | Fragments: 393,327, 217 | Fragments: 393,345,327,217 |
| G4 | ||

|
||
| Fragments: 393,345,327,217 |
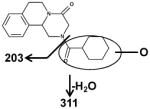
The six mono-oxidized metabolites (ion II, III, IV, V, VI, VII) of PZQ were identified at retention times of 4.35 min, 4.56 min, 4.85 min, 5.16 min, 5.30 min and 5.45 min, all of which gave a match for C19H24N2O3, with mass errors of 1.5, 1.5, 1.5, 1.5, 1.5 and 4.6 ppm, respectively. Metabolite III was identified as 4-OH PZQ by comparing with the authentic standard (unpublished data). Because of the detection of a fragment ion 203 m/z, metabolite IV was proposed to be produced by mono-oxidization of the cyclohexyl group (part B). The fragment ion 219 m/z could be observed in the MS/MS spectra, metabolite II, V, VI and VII were assigned as the oxidized products of PZQ in 1,2,3,6,7,11b-hexahydro-4H-pyrazino(2,1-α)isoquinoline-4-one group (part A).
Ions VIII (retention time= 3.17 min) and IX (retention time= 5.06 min) showed the accurate masses of [M+H]+ 327.173 and 327.171, matching the molecular formula C19H22N2O3. These metabolites were proposed to be the products of dehydrogenation of mono-oxidized PZQ based on the MS/MS spectra (Table 2).
The di-oxidized metabolites X, XI and XII exhibited molecular ions at m/z 345.184, 345.182 and 345.181, which matched C19H24N2O4. The MS/MS spectra and the proposed structures of these three metabolites are given in Figure 3 and Table 2.
Ion G1 (Rt=4.46 min) gave the match for C25H32N2O9 at m/z 505.218, with the mass error of −1.2 ppm based on the accurate mass measurement. The molecular ion yield fragment ions at m/z 395, 329, and 219 in the MS/MS spectrum (Figure 3). The fragment ion 395 occurred from the loss of one molecule of glucuronic acid. The fragmentation mechanism for formation of the fragment 329 and 219 (Figure 3 and Table 2) indicated G1 was the O-glucuronide of mono-oxidized PZQ in part A. Ions G2, G3, and G4 were also the new detected glucuronides, and the MS/MS spectra and proposed the fragmentation mechanisms (Figure 3 and Table 2) showed that they were dehydrogenated mono-oxidized PZQ glucuronide, di-oxidized PZQ glucuronide, and di-oxidized PZQ glucuronide for G2, G3, and G4, respectively. A separation of the 24 h serum from the control group and PZQ-treated group was not observed (unpublished data), indicating complete excretion of the parent compound and its metabolites into the urine and feces.
3.2 In vitro phase I metabolism of PZQs in LMs and IMs
Microsomal incubations with PZQ were carried out, and the metabolites were analyzed by metabolomics using UPLC-ESI-QTOFMS. Multivariate data analysis using PCA scores revealed two clusters corresponding to metabolites from the in vitro HLM phase I incubation samples in the presence and absence of NADPH (Figure 4A). The loading plot (Figure 4B) revealed the major ions contributing to the group separation. Metabolites II-IX were all found in the HLM incubation system, but the formation of di-oxidized metabolites (X-XII) of PZQ was not detected, which is in accordance with earlier findings [4]. The representative chromatograms of the six mono-oxidized metabolites are displayed in Figure 4C.
Figure 4.
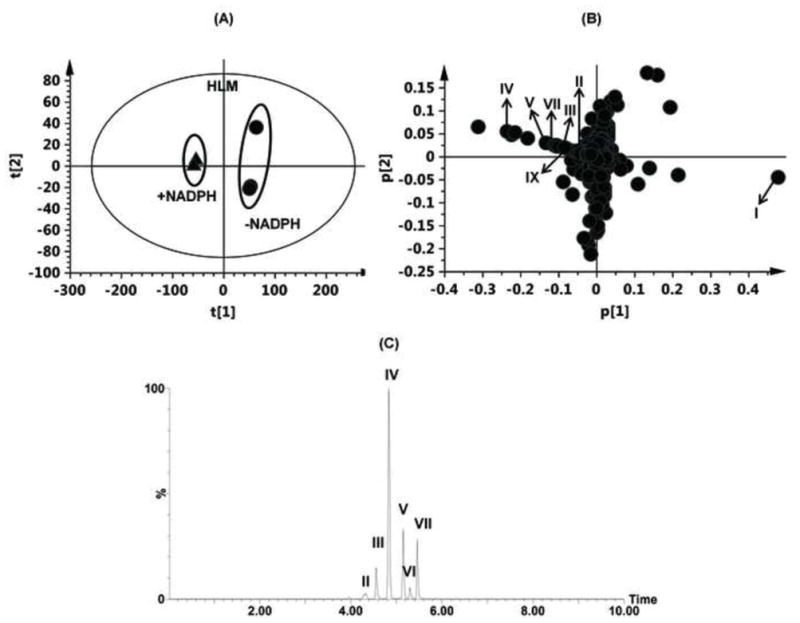
Identification of metabolites in HLM incubation system. (A) Scores plot of a PCA model from HLM incubation mixture with and without NADPH. (B) PCA loading scatter plot; PZQ and its phase I metabolites are labelled in the plot (I, II, III, IV, V, VII and IX). The p(corr)[1] values represent the interclass difference, and the p[1] values represent the relevant abundance of ions. (C) Representative chromatogram of the six mono-oxidized metabolites.
At the same microsomal protein concentration, a higher production of the six mono-oxidized metabolites in MLM than that of in HLM was observed. The relative abundances of metabolite II-VII in LMs were significantly greater than that of in IMs. HIM exhibited higher catalytic activity to PZQ than MIM. In the MIM incubation system, only metabolites IV, VI and VII could be detected (unpublished data). It should be noted the metabolite III of (S)-PZQ formed in vitro was not detected in vivo. For the in vitro system, the concentration of NADPH used is much higher than the in vivo in the liver, so the metabolites with relatively low abundance might be preferentially produced in the in vitro system, but not in vivo. Additionally, more complex metabolic pathways exist in vivo, such as the soluble phase II metabolic enzymes. In addition, the confactors for the microsomal phase II enzymes are not included in the microsomal incubation system. Thus, formation of metabolite III might be eliminated through glucuronidation into its glucuronide in vivo. These factors might explain the difference in the formation of metabolite III for (S)-PZQ between the in vitro and in vivo systems.
3.3 In vitro screening of phase I enzymes involved in the metabolism of PZQ
To identify the human phase I enzymes involved in formation of the six mono-oxidized metabolites of PZQ, recombinant human enzymes were used. The main phase I enzymes contributing to the formation of metabolite II contained CYP3A4/5 and corresponding fetal CYP3A7 (Figure 5). Three allelic types of CYP2C9 (CYP2C9, CYP2C9*2 and CYP2C9*3), CYP2C19 and CYP3A4/5 exhibited high catalytic activity towards the production of metabolite III. CYP1A1/2, CYP2C9, CYP2C19, CYP2D6 and CYP3A4/5 were all involved in the formation of metabolite IV, in which CYP2C9, CYP2C19 and CYP1A2 showed higher catalytic activity than the other CYPs. CYP2C9 and CYP2C19 played major roles in the formation of metabolite V. For metabolite VI, CYP1A1 and CYP2C19 were the major enzymes involved. CYP3A4/5 was demonstrated to be the major CYP isoform involved in the formation of metabolite VII. FMOs hardly took part in the metabolism of PZQ.
Figure 5.
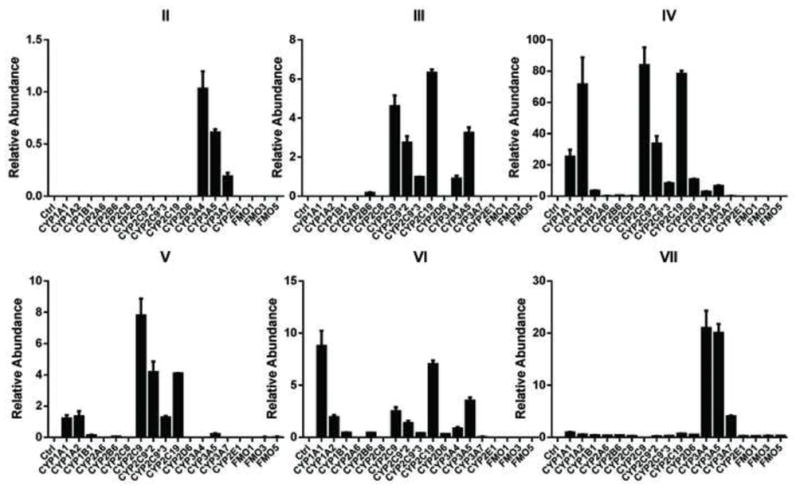
In vitro recombinant enzymes screening of phase I drug-metabolizing enzymes (DMEs) involved in the formation of metabolites II, III, IV, V, VI, and VII. For screening of phase I DMEs, the incubation system contained 50 mM Tris-HCl buffer solution (pH=7.4), 2 pmol CYPs or 5 mg FMOs, 2 mM MgCl2, 100 μM PZQ and 1 mM freshly prepared NADPH. The relative abundance (peak area ration of metabolites/internal standard) is given.
3.4 Comparison of the metabolic behavior of (R, S)-PZQ’s and PZQ enantiomers
PCA analysis of urine samples and feces samples initially suggested the different metabolic behaviors among (R, S)-PZQ treated group, (R)-PZQ treated group and (S)-PZQ treated group. The urine samples and feces samples of the three groups could be separated by PCA (unpublished data), and the loading scatter plots (unpublished data) indicating the significant contribution ions. To verify the differences between metabolic behavior of (R, S)-PZQ and PZQ enantiomers in mice, the relative abundances of metabolite II-G4 in urine and feces were all determined (Figure 6). For the formation of six mono-oxidized metabolites in urine samples (Figure 6A), metabolite III, IV was almost completely produced from (R)-PZQ. (S)-PZQ, in contrast, was mainly responsible for the formation of metabolite II, V, and VI. Metabolite VII was almost undetectable in urine samples. The two enantiomers exhibited opposite behavior towards the formations of the two dehydrogenated mono-oxidized metabolites (VIII and IX). In the (R)-PZQ treated group, only two di-oxidized metabolites (X and XI) were detected with at higher level than that of the (R, S)-PZQ treated group. For the (S)-PZQ treated group, metabolite XII was the main di-oxidized product. Among the four glucuronides of PZQ detected in urine, the formation of G1 was significantly higher than the other three glucuronides (Figure 6B) for the all three groups. The amount of glucuronides detected in (S)-PZQ group was nearly the same as or slightly higher than that of in (R, S)-PZQ group. There was small quantity of glucuronides observed in (R)-PZQ group. The comparison of the quantities of major phase I metabolites in feces from the three groups was shown in Figure 6C. The differences between the two enantiomer groups were similar with that of urine samples, but with different quantities for every metabolite. In addition, phase II metabolites were undetected in fecal samples. Different metabolic behaviors were also observed in the in vitro HLM, MLM, HIM, and MIM incubation system (unpublished data).
Figure 6.
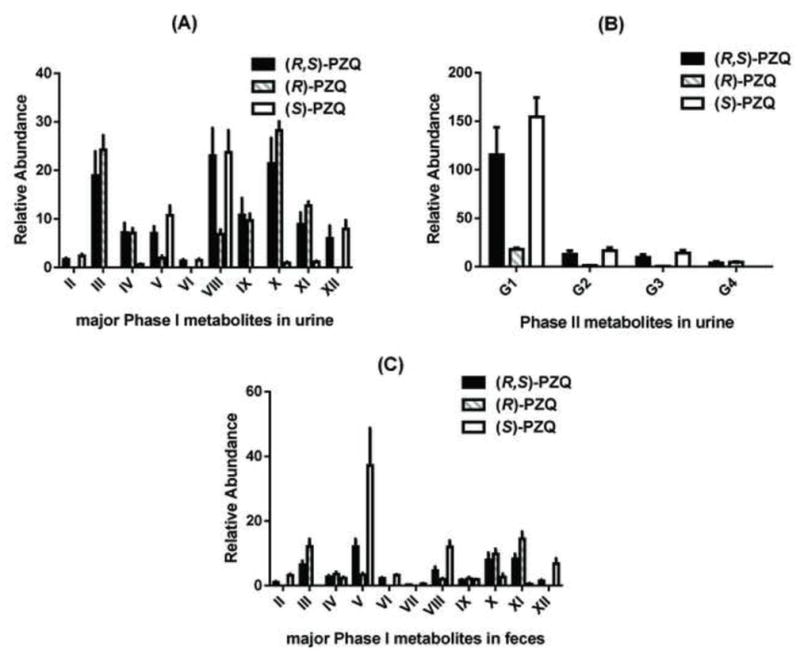
The comparison of detected metabolites in urines and feces in (R, S)-PZQ treated, (R)-PZQ treated and (S)-PZQ treated group in 129/Sv mice. The relative abundance (peak area ratio of metabolites/internal standard) is given.
3.5 Comparison of the metabolic differences of (R)-PZQ’s and (S)-PZQ’s with recombinant enzymes
To investigate further the molecular mechanism of the metabolic difference between (R)-PZQ and (S)-PZQ, the formation of six mono-oxidized metabolites produced by recombinant enzymes from the two enantiomers was compared (Figure 7). Stereoselective metabolism could be seen for almost all the tested CYPs. CYP2C9 and CYP3A4 were the two main enzymes responsible for phase I metabolism of PZQ. For CYP2C9, very significantly different production of metabolite V had been observed. CYP3A4 played important roles in the formation of metabolites II and VII, but the quantity of metabolite II produced was very small. Metabolite IV was the major mono-oxidized metabolite formed in HLM. Therefore, kinetic studies were performed on the formations of metabolites IV, V and VII by recombinant CYP2C9 and CYP3A4 towards (R, S)-PZQ, (R)-PZQ and (S)-PZQ. Because pure standards of the three metabolites were not commercially available, only the relative abundance of the produced metabolites were determined with different concentrations of (R, S)-PZQ, (R)-PZQ and (S)-PZQ. The apparent Km values are shown in Table 3. Formations of the three metabolites from PZQs yielded Michaelis-Menten kinetics for both CYP2C9 and CYP3A4 (unpublished data). There was no significant difference in apparent Km values between (R, S)-PZQ and PZQ enantiomers in the formation of metabolite IV by CYP2C9. However, the apparent Vmax (calculated as the relative abundances) of the three PZQs were dramatically different, indicating higher reactive velocity for CYP2C9 towards (R)-PZQ. When it comes to the production of metabolite V, the Km value of (R, S)-PZQ was almost 2-fold higher than that of (S)-PZQ, and the production of metabolite V was not detected in the (R)-PZQ incubations. For CYP3A4, (S)-PZQ exhibited a lower Km value (51.90 ± 13.85 μM) than that of (R, S)-PZQ. In contrast, (R)-PZQ led to a considerable increase in the Km value of approximately 1.7-times that of (R, S)-PZQ and 2.5 times that of S-enantiomer. The PZQ enantiomers presented different binding efficiencies to CYP3A4 for the formation of metabolite VII compared with (R, S)-PZQ.
Figure 7.
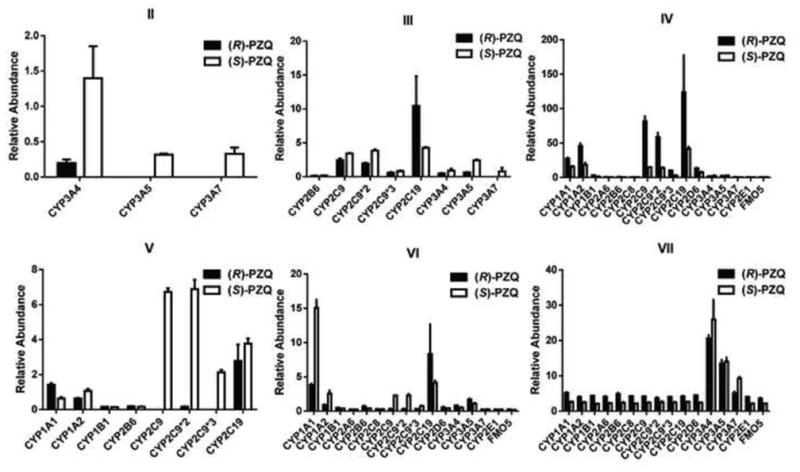
The comparison of the formation of the six mono-oxidized metabolites by recombinant enzymes between (R)-PZQ incubation system and (S)-PZQ incubation system. The incubation system contained 50 mM Tris-HCl buffer solution (pH=7.4), 2 pmol CYPs or 5 mg FMOs, 2 mM MgCl2, 100 μM (S)- or (R)-PZQ and 1 mM freshly prepared NADPH. The relative abundance (peak area ratio of metabolites/internal standard) is given.
Table 3.
Enzymatic kinetic parameters of recombinant CYP2C9 and CYP3A4 enzymes to PZQs.
| Km (μM)
|
|||
|---|---|---|---|
| CYP2C9 | CYP3A4 | ||
| IV | V | VII | |
| (R, S)-PZQ | 36.1±6.0 | 50.4±11.7 | 78.9±43.8 |
| (R)-PZQ | 25.9±4.1 | N.A. | 130.1±56.4a |
| (S)-PZQ | 32.1±5.0 | 27.0±5.2a,* | 51.9±13.9a,* |
Values significantly different from the corresponding value of racemic PZQ (P<0.05).
Values significantly different from the corresponding value of the enantiomer (P<0.001).
3.6 Dockings of (R)-PZQ and (S)-PZQ into crystal structures of CYP2C9 and CYP3A4
The optimized structures of (R)-PZQ and (S)-PZQ were docked into the defined protocol of CYP3A4 and CYP2C9 to explore the possible binding modes, respectively. For the docking results of CYP3A4 (Figure 8A), both enantiomers could enter into the active sites, while the locations and conformations were quite different because of the chiral differences. The chemscores of the best ranked poses of the (R)-PZQ and (S)-PZQ were −27.0 and −30.2, respectively, which indicated that the (S)-PZQ has stronger interaction with CYP3A4. Further analysis of the orientation of (S)-PZQ indicated that its aromatic ring might be metabolized by the heme, while (R)-PZQ placed itself with a reverse pose in which no site in the molecule could be metabolized. Both the chemscore and the location of ligands suggested that the (S)-PZQ could be metabolized by CYP3A4 more easily, and these results were in accordance with the present experimental results. Analysis of CYP2C9 for the formation of metabolite V (Figure 8B) was similar to the CYP3A4. The chemscores of (R)-PZQ and (S)-PZQ were −19.8 and −22.8, respectively. According to the docking of (R)-PZQ and (S)-PZQ (Figure 9) the distance between aromatic ring of (S)-PZQ and the heme was much smaller than (R)-PZQ, which indicated that (S)-PZQ is a better substrate for CYP2C9 and CYP3A4 in the formation of metabolite V and metabolite VII individually, which was also consistent with the experimental results. According to these results, the chiral differences that resulted in the different location and conformation affected the metabolism.
Figure 8.

Docking comparison of (R)-PZQ and (S)-PZQ into crystal structures of CYP2C9 and CYP3A4. The human microsomal cytochrome P450 3A4 structure (PDB Code: 2V0M) and human microsomal CYP2C9 structure (PDB Code: 1OG5) were obtained from the Protein Data Bank (http://www.rcsb.org/pdb). The two-dimensional structures of drug molecules used in this work were generated using ChemDraw with standard bond lengths and angles.
Figure 9.
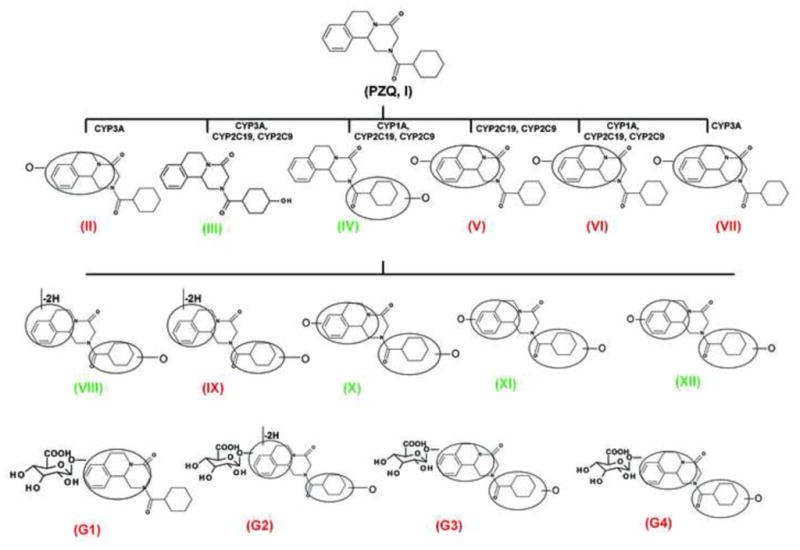
A brief description of metabolic pathway and enantioselective metabolic difference of PZQ. The green color highlighted the metabolites mainly produced through the metabolism of (R)-PZQ, and the red color highlighted the metabolites mainly produced through the metabolism of (S)-PZQ.
Discussion
It has been long recognized that two enantiomers of a chiral drug commonly possess different pharmacological and toxicological properties [20–22]. About one in four of all therapeutic agents are administered to humans as mixtures of enantiomeric substances whose pharmacological activity and toxicity may exhibit difference between two the enantiomers. Stereoselective metabolism of the racemic mixtures may further complicate the therapeutic role and the adverse effects encountered with drugs [23]. During the past decades, numerous studies revealed that chiral drugs often display stereoselectivity in pharmacokinetics and drug disposition, especially in the process of metabolism [24–26]. Chirality consideration in drug metabolism and pharmacokinetic analyses remain an important issue for the pharmaceutical industry and the regulatory authorities [27]. Praziquantel is a broad-spectrum anthelmintic drug used for the treatment of all forms of schistosomiasis and infection caused by other trematodes [28, 29]. PZQ is included in the WHN Model List of Essential Drugs (http://www.who.int/mediciens/publications/essentialmedicines/cn/) and is at the core of numerous schistosomiasis control programs. It was speculated for many years that the schistosomicidal activity mainly relies on (R)-PZQ, whereas the (S)-PZQ does not contribute to the biological activity [10, 11, 30, 31]. Although no clinical studies in humans exist if and how non-schistosomicidal (S)-PZQ alone contributes to the side-effects known of (R, S)-PZQ, Meyer et al [32] assumed that the additional metabolites detected resulting from (S)-PZQ might contribute to those side effects. In the context of the WHO’s Global Plan to combat NTDs, the Special Programme for Research and Training in Tropical Diseases (TDR) set up an incentive for further R&D work by emphasizing the low-cost preparation of pure schistosomicidal (R)-PZQ as a key priority for future R&D on PZQ [TDR (2007) BL6 Business Plan 2008–2013. Available http://www.who.int/tdr/about/strategy/pdf/bl6.pdf].
In this study, a comprehensive metabolic profile of PZQ was elucidated, and the comparison of the metabolism of PZQ enantiomers was performed both in vivo and in vitro. Through the combination of high-resolution LC-MS technology and PCA analysis, the phase I and phase II metabolites were identified and further structurally elucidated by MS/MS fragmentography. A series of phase I metabolites from PZQ in 129/Sv mice were identified to be mono-oxidized PZQ (II-VII), dehydrogenated monohydroxylated PZQ (VIII and IX) and di-oxidized PZQ (X-XII). In addition, four novel glucuronides of oxidized PZQ (G1–G4) were found in urine of 129/Sv mice treated with (R, S)-PZQ, and the structures of these glucuronides elucidated using MS/MS fragmentation patterns. Metabolomic analysis was further employed to observe the metabolic differences for the metabolism of PZQ enantiomers in mice. In (R)-PZQ treated group, two mono-oxidized metabolites of PZQ at part B (III and IV), one dehydrogenated mono-oxidized PZQ (IX) and two di-oxidized PZQ (X and XI) were the main phase I metabolites detected. There was no significant difference in the quantities of these metabolites between the (R, S)-PZQ treated group and (R)-PZQ treated group. Otherwise, the glucuronides of PZQ detected in (R)-PZQ treated group were considerably less than the other two groups. For the (S)-PZQ treated group, the quantities of produced phase I metabolites (II, V, VI, VII, VIII and XII) and phase II metabolites (G1–G4) were similar a slightly higher than that of (R, S)-PZQ treated group. It should be noted that the glucuronidation biotransformation of the (S)-PZQ phase I metabolites was greater than for the (R)-PZQ phase I metabolites, which might explain why (R)-PZQ exhibited enhanced therapeutic activity in vivo. Some studies have reported the side-effects produced by active glucuronides [33–36], such as the withdrawal of benoxaprofen from world markets [37], which mainly resulted from toxicity related to hepatic metabolism via glucuronidation and the correlation between glucuronide covalent binding with proteins to the risk of idiosyncratic drug toxicity (IDT) [38]. Although the glucuronides of PZQ detected are not acyl glucuronides, the possibility of active glucuronides being generated should also be considered in the future studies of PZQ toxicity. Therefore, the possible relationship between toxicity and glucuronides of (S)-PZQ needs to be assessed in future studies.
Identification of the enzymes involved in PZQ metabolism is another important task for deciphering the metabolic pathway of PZQ, and the different catalytic activity of enzymes towards PZQ enantiomers can be used to explain further the stereoselective metabolic differences in PZQ metabolism. In the present study, the phase I enzymes involved in the formation of the six mono-oxidized metabolites were identified. Previous studies have reported that CYP1A2, CYP2C19, CYP2D6 and CYP3A4/5 were responsible for the phase I metabolism of PZQ [7], partly consistent with the present results. By analyzing the relative abundance of metabolite produced in recombinant enzyme incubation systems CYP3A, CYP2C9, CYP2C19, CYP1A1/2 were found to contribute to the production of the mono-oxidized metabolites (II-VII), suggesting that altered activity of these enzymes due to polymorphism or enzyme inhibition could significantly affect the disposition of PZQ. Additionally, little activity of FMO in the metabolism of PZQ indicated that the positions of oxidation were not located at nitrogen. Stereoselective metabolism of PZQ enantiomers by different CYPs was also observed with recombinant enzymes. To explore further the mechanism of enantioselective metabolism, the enzymatic kinetics of CYP2C9 and CYP3A4 towards (R, S)-PZQ and PZQ enantiomers was investigated for the formation of metabolites IV, V and VII. The different apparent Km and Vmax values explained the differences in the formation of these metabolites. The orientations of the enantiomers in the enzyme active sites were further investigated to explore the probable factors affecting metabolic properties. Both (R)-PZQ and (S)-PZQ could dock into the active sites, however, they exhibited different modes of binding. Further analysis of the details of the docking indicated that the aromatic ring of (S)-PZQ was more in proximity to both CYP3A4 and CYP2C9 than was (R)-PZQ, which suggested that the aromatic ring could be metabolized more easily in (S)-PZQ in the formation of metabolite V and VII. Therefore, the metabolic differences could contribute to the chiral differences which resulted from different binding modes. Some studies have shown that drug resistance may depend on the metabolism [39, 40], which indicates that the relationship between the enantioselective metabolism of the two isomers and the drug resistance of PZQ should be considered. In addition, with the identification of human CYPs responsible for metabolism of PZQ in this study, the potential drug-drug interactions between PZQ and the clinical drugs would likely involve CYP-catalyzed metabolism.
In conclusion, the complete metabolic pathway and enantioselective metabolic difference of PZQ (Figure 9) were elucidated in the present study, and in silico, in vitro, and in vivo methods were adopted to explain the enantioselective metabolic profile of praziquantel. These findings might provide further justification for the use of pure (R)-PZQ in clinical therapy.
Acknowledgments
This study was funded by the National Natural Science Foundation of China (No. 81102504 and 81202586), the National High-Tech Program of China (863 Project No. 2012AA020306), Shandong Natural Science Foundation of China (No. BS2013YY054 and ZR2010HL023), and the Intramural Research Program of the Center for Cancer Research, National Cancer Institute, National Institutes of Health.
Footnotes
Conflicts of Interest
None
Author Contributions
Conceived and designed the experiments: HNW ZZF FJG. Perform the experiments: HNW ZZF. Analyzed the data: HNW ZZF KZ. Contributed reagent/materials/analysis tools: DQS KWK YZ CYH. Wrote the paper: HNW ZZF. Review of the manuscript: HNW ZZF DQS JRI FJG.
Publisher's Disclaimer: This is a PDF file of an unedited manuscript that has been accepted for publication. As a service to our customers we are providing this early version of the manuscript. The manuscript will undergo copyediting, typesetting, and review of the resulting proof before it is published in its final citable form. Please note that during the production process errors may be discovered which could affect the content, and all legal disclaimers that apply to the journal pertain.
References
- 1.Jenkins-Holick DS, Kaul TL. Schistosomiasis. Urol Nurs. 2013;33:163–70. [PubMed] [Google Scholar]
- 2.Hagan P, Appleton CC, Coles GC, Kusel JR, Tchuem-Tchuente LA. Schistosomiasis control: keep taking the tablets. Trends Parasitol. 2004;20:92–7. doi: 10.1016/j.pt.2003.11.010. [DOI] [PubMed] [Google Scholar]
- 3.Melman SD, Steinauer ML, Cunningham C, Kubatko LS, Mwangi IN, Wynn NB, et al. Reduced susceptibility to praziquantel among naturally occurring Kenyan isolates of Schistosoma mansoni. PLoS Negl Trop Dis. 2009;3:e504. doi: 10.1371/journal.pntd.0000504. [DOI] [PMC free article] [PubMed] [Google Scholar]
- 4.Huang J, Bathena SP, Alnouti Y. Metabolite profiling of praziquantel and its analogs during the analysis of in vitro metabolic stability using information-dependent acquisition on a hybrid triple quadrupole linear ion trap mass spectrometer. Drug Metab Pharmacokinet. 2010;25:487–99. doi: 10.2133/dmpk.dmpk-10-rg-041. [DOI] [PMC free article] [PubMed] [Google Scholar]
- 5.Meier H, Blaschke G. Investigation of praziquantel metabolism in isolated rat hepatocytes. J Pharm Biomed Anal. 2001;26:409–15. doi: 10.1016/s0731-7085(01)00417-4. [DOI] [PubMed] [Google Scholar]
- 6.Masimirembwa CM, Hasler JA. Characterisation of praziquantel metabolism by rat liver microsomes using cytochrome P450 inhibitors. Biochem Pharmacol. 1994;48:1779–83. doi: 10.1016/0006-2952(94)90464-2. [DOI] [PubMed] [Google Scholar]
- 7.Li XQ, Bjorkman A, Andersson TB, Gustafsson LL, Masimirembwa CM. Identification of human cytochrome P(450)s that metabolise anti-parasitic drugs and predictions of in vivo drug hepatic clearance from in vitro data. Eur J Clin Pharmacol. 2003;59:429–42. doi: 10.1007/s00228-003-0636-9. [DOI] [PubMed] [Google Scholar]
- 8.Ridtitid W, Wongnawa M, Mahatthanatrakul W, Punyo J, Sunbhanich M. Rifampin markedly decreases plasma concentrations of praziquantel in healthy volunteers. Clin Pharmacol Ther. 2002;72:505–13. doi: 10.1067/mcp.2002.129319. [DOI] [PubMed] [Google Scholar]
- 9.Ridtitid W, Ratsamemonthon K, Mahatthanatrakul W, Wongnawa M. Pharmacokinetic interaction between ketoconazole and praziquantel in healthy volunteers. Journal of Clinical Pharmacy and Therapeutics. 2007;32:585–93. doi: 10.1111/j.1365-2710.2007.00862.x. [DOI] [PubMed] [Google Scholar]
- 10.Wu MH, Wei CC, Xu ZY, Yuan HC, Lian WN, Yang QJ, et al. Comparison of the therapeutic efficacy and side effects of a single dose of levo-praziquantel with mixed isomer praziquantel in 278 cases of schistosomiasis japonica. Am J Trop Med Hyg. 1991;45:345–9. doi: 10.4269/ajtmh.1991.45.345. [DOI] [PubMed] [Google Scholar]
- 11.Xiao SH, Catto BA. Comparative in vitro and in vivo activity of racemic praziquantel and its levorotated isomer on Schistosoma mansoni. J Infect Dis. 1989;159:589–92. doi: 10.1093/infdis/159.3.589. [DOI] [PubMed] [Google Scholar]
- 12.Staudt U, Schmahl G, Blaschke G, Mehlhorn H. Light and scanning electron microscopy studies on the effects of the enantiomers of praziquantel and its main metabolite on Schistosoma mansoni in vitro. Parasitol Res. 1992;78:392–7. doi: 10.1007/BF00931694. [DOI] [PubMed] [Google Scholar]
- 13.Lima RM, Ferreira MA, Ponte TM, Marques MP, Takayanagui OM, Garcia HH, et al. Enantioselective analysis of praziquantel and trans-4-hydroxypraziquantel in human plasma by chiral LC-MS/MS: Application to pharmacokinetics. J Chromatogr B Analyt Technol Biomed Life Sci. 2009;877:3083–8. doi: 10.1016/j.jchromb.2009.07.036. [DOI] [PubMed] [Google Scholar]
- 14.Li F, Patterson AD, Hofer CC, Krausz KW, Gonzalez FJ, Idle JR. A comprehensive understanding of thioTEPA metabolism in the mouse using UPLC-ESI-QTOFMS-based metabolomics. Biochem Pharmacol. 2011;81:1043–53. doi: 10.1016/j.bcp.2011.01.024. [DOI] [PMC free article] [PubMed] [Google Scholar]
- 15.Giri S, Idle JR, Chen C, Zabriskie TM, Krausz KW, Gonzalez FJ. A metabolomic approach to the metabolism of the areca nut alkaloids arecoline and arecaidine in the mouse. Chem Res Toxicol. 2006;19:818–27. doi: 10.1021/tx0600402. [DOI] [PMC free article] [PubMed] [Google Scholar]
- 16.Johnson CH, Patterson AD, Idle JR, Gonzalez FJ. Xenobiotic metabolomics: major impact on the metabolome. Annu Rev Pharmacol Toxicol. 2012;52:37–56. doi: 10.1146/annurev-pharmtox-010611-134748. [DOI] [PMC free article] [PubMed] [Google Scholar]
- 17.Fang ZZ, Krausz KW, Li F, Cheng J, Tanaka N, Gonzalez FJ. Metabolic map and bioactivation of the anti-tumour drug noscapine. Br J Pharmacol. 2012;167:1271–86. doi: 10.1111/j.1476-5381.2012.02067.x. [DOI] [PMC free article] [PubMed] [Google Scholar]
- 18.Li F, Lu J, Ma X. Profiling the reactive metabolites of xenobiotics using metabolomic technologies. Chem Res Toxicol. 2011;24:744–51. doi: 10.1021/tx200033v. [DOI] [PMC free article] [PubMed] [Google Scholar]
- 19.Fang ZZ, Zhang YY, Ge GB, Huo H, Liang SC, Yang L. Time-dependent inhibition (TDI) of CYP3A4 and CYP2C9 by noscapine potentially explains clinical noscapine-warfarin interaction. Br J Clin Pharmacol. 2010;69:193–9. doi: 10.1111/j.1365-2125.2009.03572.x. [DOI] [PMC free article] [PubMed] [Google Scholar]
- 20.Brocks DR, Jamali F. Stereochemical aspects of pharmacotherapy. Pharmacotherapy. 1995;15:551–64. doi: 10.1002/j.1875-9114.1995.tb02863.x. [DOI] [PubMed] [Google Scholar]
- 21.Brocks DR. Drug disposition in three dimensions: an update on stereoselectivity in pharmacokinetics. Biopharm Drug Dispos. 2006;27:387–406. doi: 10.1002/bdd.517. [DOI] [PubMed] [Google Scholar]
- 22.Torrado JJ, Blanco M, Farre M, Roset P, Garcia-Arieta A. Rationale and conditions for the requirement of chiral bioanalytical methods in bioequivalence studies. Eur J Clin Pharmacol. 2010;66:599–604. doi: 10.1007/s00228-010-0792-7. [DOI] [PubMed] [Google Scholar]
- 23.Perez-Trujillo M, Lindon JC, Parella T, Keun HC, Nicholson JK, Athersuch TJ. Chiral metabonomics: 1H NMR-based enantiospecific differentiation of metabolites in human urine via direct cosolvation with beta-cyclodextrin. Anal Chem. 2012;84:2868–74. doi: 10.1021/ac203291d. [DOI] [PubMed] [Google Scholar]
- 24.Rentsch KM. The importance of stereoselective determination of drugs in the clinical laboratory. J Biochem Biophys Methods. 2002;54:1–9. doi: 10.1016/s0165-022x(02)00124-0. [DOI] [PubMed] [Google Scholar]
- 25.Lu H. Stereoselectivity in drug metabolism. Expert Opin Drug Metab Toxicol. 2007;3:149–58. doi: 10.1517/17425255.3.2.149. [DOI] [PubMed] [Google Scholar]
- 26.Jamali F, Mehvar R, Pasutto FM. Enantioselective aspects of drug action and disposition: therapeutic pitfalls. J Pharm Sci. 1989;78:695–715. doi: 10.1002/jps.2600780902. [DOI] [PubMed] [Google Scholar]
- 27.Brooks WH, Guida WC, Daniel KG. The significance of chirality in drug design and development. Curr Top Med Chem. 2011;11:760–70. doi: 10.2174/156802611795165098. [DOI] [PMC free article] [PubMed] [Google Scholar]
- 28.Dong Y, Chollet J, Vargas M, Mansour NR, Bickle Q, Alnouti Y, et al. Praziquantel analogs with activity against juvenile Schistosoma mansoni. Bioorg Med Chem Lett. 2010;20:2481–4. doi: 10.1016/j.bmcl.2010.03.001. [DOI] [PubMed] [Google Scholar]
- 29.Andrews P. Praziquantel: mechanisms of anti-schistosomal activity. Pharmacol Ther. 1985;29:129–56. doi: 10.1016/0163-7258(85)90020-8. [DOI] [PubMed] [Google Scholar]
- 30.Liu YH. Levo-Praziquantel versus Praziquantel in experimental and clinical treatment of schistosomiases Japonica. Chinese Medicine Journal. 2005;106:593–6. [PubMed] [Google Scholar]
- 31.Liu YH, Qian MX, Wang XG, Jia J, Wang QN, Jiang YF, et al. Comparative efficacy of praziquantel and its optic isomers in experimental therapy of schistosomiasis japonica in rabbits. Chin Med J (Engl) 1986;99:935–40. [PubMed] [Google Scholar]
- 32.Meyer T, Sekljic H, Fuchs S, Bothe H, Schollmeyer D, Miculka C. Taste, a new incentive to switch to (R)-praziquantel in schistosomiasis treatment. PLoS Negl Trop Dis. 2009;3:e357. doi: 10.1371/journal.pntd.0000357. [DOI] [PMC free article] [PubMed] [Google Scholar]
- 33.Mano N, Goto T, Nikaido A, Narui T, Goto J. Inhibition of the rat hepatic microsomal flurbiprofen acyl glucuronidation by bile acids. J Pharm Sci. 2003;92:2098–108. doi: 10.1002/jps.10475. [DOI] [PubMed] [Google Scholar]
- 34.Nagao T, Tanino T, Iwaki M. Stereoselective pharmacokinetics of flurbiprofen and formation of covalent adducts with plasma protein in adjuvant-induced arthritic rats. Chirality. 2003;15:423–8. doi: 10.1002/chir.10227. [DOI] [PubMed] [Google Scholar]
- 35.Dong JQ, Smith PC. Glucuronidation and covalent protein binding of benoxaprofen and flunoxaprofen in sandwich-cultured rat and human hepatocytes. Drug Metab Dispos. 2009;37:2314–22. doi: 10.1124/dmd.109.028944. [DOI] [PMC free article] [PubMed] [Google Scholar]
- 36.Bailey MJ, Dickinson RG. Acyl glucuronide reactivity in perspective: biological consequences. Chem Biol Interact. 2003;145:117–37. doi: 10.1016/s0009-2797(03)00020-6. [DOI] [PubMed] [Google Scholar]
- 37.Dahl SL, Ward JR. Pharmacology, clinical efficacy, and adverse effects of the nonsteroidal anti-inflammatory agent benoxaprofen. Pharmacotherapy. 1982;2:354–66. doi: 10.1002/j.1875-9114.1982.tb03212.x. [DOI] [PubMed] [Google Scholar]
- 38.Sawamura R, Okudaira N, Watanabe K, Murai T, Kobayashi Y, Tachibana M, et al. Predictability of idiosyncratic drug toxicity risk for carboxylic acid-containing drugs based on the chemical stability of acyl glucuronide. Drug Metab Dispos. 2010;38:1857–64. doi: 10.1124/dmd.110.034173. [DOI] [PubMed] [Google Scholar]
- 39.Sanchez MB, Herranz JL, Leno C, Arteaga R, Oterino A, Valdizan EM, et al. Genetic factors associated with drug-resistance of epilepsy: relevance of stratification by patient age and aetiology of epilepsy. Seizure: the journal of the British Epilepsy Association. 2010;19:93–101. doi: 10.1016/j.seizure.2009.12.004. [DOI] [PubMed] [Google Scholar]
- 40.Cummings J, Ethell BT, Jardine L, Boyd G, Macpherson JS, Burchell B, et al. Glucuronidation as a mechanism of intrinsic drug resistance in human colon cancer: reversal of resistance by food additives. Cancer research. 2003;63:8443–50. [PubMed] [Google Scholar]


