Abstract
Aim: “Late motherhood” is associated with greater perinatal risks but the term lacks precise definition. We present an approach to determine what “late motherhood” associated with “high risk” is, based on parity and preterm birth rate. Materials and Methods: Using data from the German Perinatal Survey of 1998–2000 we analysed preterm birth rates in women with zero, one, or two previous live births. We compared groups of “late” mothers (with high preterm birth rates) with “control” groups of younger women (with relatively low preterm birth rates). Data of 208 342 women were analysed. For women with zero (one; two) previous live births, the “control” group included women aged 22–26 (27–31; 29–33) years. Women in the “late motherhood” group were aged > 33 (> 35; > 38) years. Results: The “late motherhood” groups defined in this way were also at higher risk of adverse perinatal events other than preterm birth. For women with zero (one; two) previous live births, normal cephalic presentation occurred in 89 % (92.7 %; 93.3 %) in the “control” group, but only in 84.5 % (90 %; 90.4 %) in the “late motherhood” group. The mode of delivery was spontaneous or at most requiring manual help in 71.3 % (83.4 %; 85.8 %) in the “control” group, but only in 51.4 % (72.2 %; 76.4 %) in the “late motherhood” group. Five-minute APGAR scores were likewise worse for neonates of “late” mothers and the proportion with a birth weight ≤ 2499 g was greater. Conclusion: “Late motherhood” that is associated with greater perinatal risks can be defined based on parity and preterm birth rate.
Key words: late motherhood, parity, preterm birth rate, perinatal risks, German Perinatal Survey
Abstract
Zusammenfassung
Zielstellung: „Späte Mutterschaft“ ist verbunden mit größeren perinatalen Risiken, der Begriff ist aber nicht genau definiert. Hier wird eine Herangehensweise beschrieben, um zu bestimmen, was „späte“, mit höheren Risiken verbundene Mutterschaft ist, basierend auf Parität und Frühgeborenenrate. Material und Methoden: Aufgrund von Daten der Deutschen Perinatalerhebung der Jahre 1998–2000 wurden Frühgeborenenraten bei Frauen mit keinen, einer oder zwei vorausgegangenen Lebendgeburten analysiert. Gruppen von „späten“ Müttern (mit hohen Frühgeborenenraten) wurden verglichen mit „Kontrollgruppen“ jüngerer Frauen (mit relativ niedrigen Frühgeborenenraten). Daten von 208 342 Frauen wurden analysiert. Für Schwangere mit keinen (einer; zwei) vorausgegangenen Lebendgeburten umfasste die „Kontrollgruppe“ Frauen im Alter von 22–26 (27–31; 29–33) Jahren. Frauen in der Gruppe „später“ Mütter waren > 33 (> 35; > 38) Jahre alt. Ergebnisse: Die Gruppen „später“ Mütter, die über eine erhöhte Frühgeburtlichkeit definiert wurden, hatten auch ein erhöhtes Risiko für andere ungünstige perinatale Outcomes. Für Frauen mit keinen (einer; zwei) vorausgegangenen Lebendgeburten fand sich eine regelrechte Schädellage bei 89 % (92,7 %; 93,3 %) in der „Kontrollgruppe“, aber nur bei 84,5 % (90 %; 90,4 %) in der Gruppe der „späten“ Mütter. Der Entbindungsmodus war spontan bzw. Manualhilfe notwendig bei 71,3 % (83,4 %; 85,8 %) in der „Kontrollgruppe“, aber nur bei 51,4 % (72,2 %; 76,4 %) in der Gruppe der „späten“ Mütter. Der 5-minütige APGAR-Score war ebenfalls schlechter bei den Neugeborenen „später“ Mütter, und der Anteil mit einem Geburtsgewicht ≤ 2499 g war größer. Schlussfolgerung: Die mit größeren perinatalen Risiken verbundene „späte Mutterschaft“ kann aufgrund von Parität und Frühgeborenenrate definiert werden.
Schlüsselwörter: späte Mutterschaft, Parität, Frühgeborenenrate, perinatale Risiken, Deutsche Perinatalerhebung
Introduction
“Late motherhood” (at least for singleton pregnancies) is associated with adverse perinatal and later outcomes for mother and child 1, 2, 3, 4, 5, 6, 7, 8, 9. Among the risks associated with “late motherhood” is an increased preterm birth rate 10, 11. This can to some extent be explained with the age-dependent distribution of risk factors for preterm birth 12. Preterm birth is an important risk because of its unfavourable clinical implications and because it is associated with substantial costs 13, 14.
However, it is unclear when precisely pregnant women should be labelled “old” and what should constitute “late motherhood”. This is especially important as maternal age at birth is increasing, at least in the developed world. Many healthy children are now born to mothers aged beyond 35 and beyond 40 years 2, 15.
We believe parity should be considered in deciding what is “late” and what is not. The same maternal age may be perceived old for women having their first child but not old for women having their second or third child.
Preterm birth rates vary with age and parity. The relationship between maternal age and preterm birth rates is biphasic. The rates of preterm delivery are high for very young women and also for older women with the lowest rates being observed for women of intermediate age. What the “intermediate” age range associated with the lowest preterm birth rates is, depends on parity. The “optimal age” for delivery – from the perspective of being associated with the lowest preterm birth rates – is earlier for women giving birth to their first child than for women giving birth to their second or third child. Likewise, the “high risk” age range, when the preterm birth rate increases substantially with maternal age, occurs earlier for women having their first child compared with women giving birth to a later child 10, 11.
Our approach presented in this paper is to use the preterm birth rate to determine what is “late motherhood” for women of a given parity. We aimed to contrast a “late motherhood” group of women at high risk of preterm birth with a “control” group of younger pregnant women with low preterm birth rates. We analysed perinatal outcomes other than preterm delivery in these groups to see if the groups also differed consistently with regard to other perinatal risks. To take account of the effect of parity we conducted analyses separately for women with zero, one, or two previous live births.
Materials and Methods
We had available data on singleton pregnancies from the routine data collection of the German Perinatal Survey of the years 1998–2000. Datasets contained a range of parameters of the pregnant women and their neonates, including maternal age, parity and perinatal outcomes. Data collection had been undertaken with standardised forms throughout Germany. Datasets were kindly provided to us by the chambers of physicians of the German federal states Bavaria, Brandenburg, Hamburg, Mecklenburg-Vorpommern, Lower Saxony, Saxony, Saxony-Anhalt, and Thuringia.
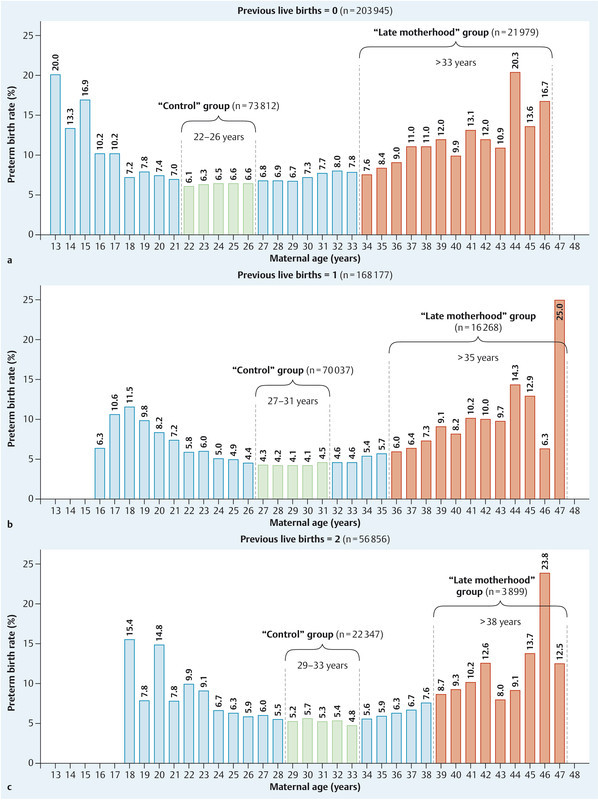
To take account of the effect of parity we analysed data separately for women with zero, one, or two previous live births. We compared “late motherhood” groups of older, “high risk” pregnant women – defined by increased preterm birth rates – with “control” groups of younger pregnant women – defined by lower preterm birth rates. Fig. 1 illustrates the way in which the high risk, “late motherhood” groups and the low risk “control” groups of younger pregnant women were formed. The groups were defined separately for women with no (Fig. 1 a), one (Fig. 1 b), and two (Fig. 1 c) previous live births. In each case the “control” group included women in the age range (over 5 years) associated with low preterm birth rates, i.e. in-between the relatively high preterm birth rates seen in young women and in older women. The ‘late motherhood’ group was defined by the age range associated with rising preterm birth rates. Overall 208 342 women were included in “late motherhood” and “control” groups.
Fig. 1 a.

to c Defining the “late motherhood” and “control” groups for women with no (a), one (b), and two (c) previous live births. In each case the “control” group was defined by the maternal age range (over 5 years) associated with low preterm birth rates and the “late motherhood” group by the age range associated with high preterm birth rates.
We also subdivided “late motherhood” groups further according to age to assess risk in very old pregnant women. Odds ratios (OR) were calculated; numbers in brackets after the OR represent the 95 % confidence interval. Statistical analysis was assisted by SPSS (Version 15.0.1, Computer Centre of the University of Rostock, Germany).
Results
The “late motherhood” groups of older pregnant women and “control” groups of younger pregnant women differed with regard to several important characteristics that are associated with increased perinatal risk. Selected parameters are illustrated in Table 1. The table also shows the proportion of women with previous infertility treatment. As expected, this was highest in older women with no previous live births.
Table 1 Risk factors for adverse perinatal outcomes in the “control” and “late motherhood” groups. The groups were defined as in Fig. 1 with the “late motherhood” groups of older women subdivided further according to age. Data are presented separately for women with zero, one, or two previous live births.
| Previous live births | Characteristic | “Control” groups (younger women) | “Late motherhood” groups (older women) | |
|---|---|---|---|---|
| Zero | Age | 22–26 years (n = 73 812) | 34–40 years (n = 21 020) | 41–46 years (n = 959) |
| Preterm birth rate | 6.5 % | 9.0 % | 13.0 % | |
| Previous stillbirths | 0.3 % | 0.8 % | 1.4 % | |
| Previous miscarriages | 9.1 % | 19.9 % | 33.6 % | |
| Previous terminations of pregnancy | 5.4 % | 10.1 % | 12.6 % | |
| Previous extrauterine pregnancies | 0.6 % | 1.9 % | 3.1 % | |
| Previous infertility treatment | 1.4 % | 9.5 % | 12.9 % | |
| One | Age | 27–31 years (n = 70 037) | 36–41 years (n = 15 564) | 42–47 years (n = 704) |
| Preterm birth rate | 4.2 % | 7.0 % | 10.7 % | |
| Previous stillbirths | 0.6 % | 1.2 % | 1.3 % | |
| Previous miscarriages | 17.3 % | 29.1 % | 40.8 % | |
| Previous terminations of pregnancy | 8.4 % | 12.4 % | 16.1 % | |
| Previous extrauterine pregnancies | 1.3 % | 2.3 % | 3.3 % | |
| Previous infertility treatment | 1.1 % | 2.8 % | 4.1 % | |
| Two | Age | 29–33 years (n = 22 347) | 39–43 years (n = 3 720) | 44–47 years (n = 179) |
| Preterm birth rate | 5.3 % | 9.5 % | 12.3 % | |
| Previous stillbirths | 0.9 % | 1.5 % | 1.7 % | |
| Previous miscarriages | 23.5 % | 33.4 % | 36.9 % | |
| Previous terminations of pregnancy | 12.9 % | 18.9 % | 22.3 % | |
| Previous extrauterine pregnancies | 1.7 % | 2.4 % | 1.1 % | |
| Previous infertility treatment | 0.5 % | 1.3 % | 2.2 % | |
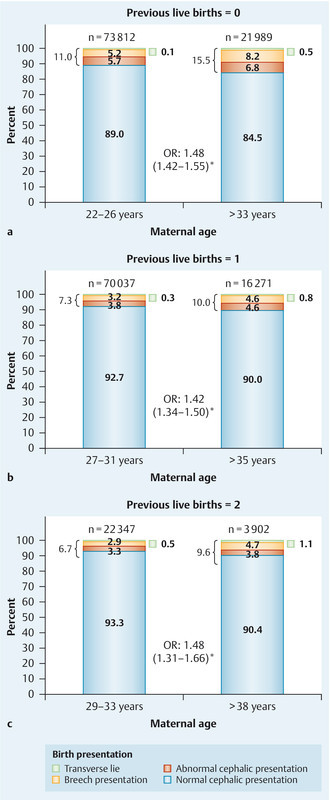
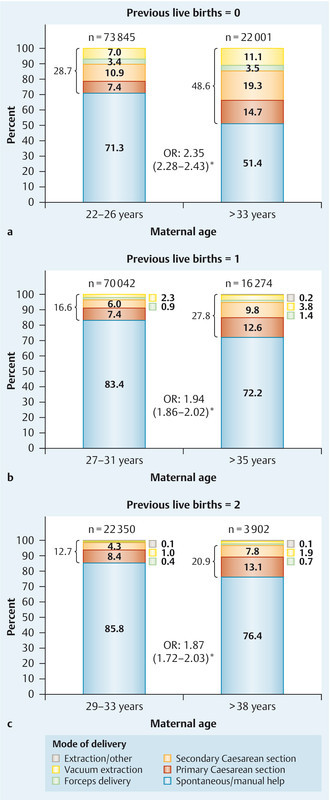
Fig. 2 compares the birth presentations in the “late motherhood” and “control” groups for women with no (Fig. 2 a), one (Fig. 2 b), and two (Fig. 2 c) previous live births. The groups were defined as in Fig. 1. The “late motherhood” groups always had a lower frequency of normal cephalic presentations and increased rates of other birth presentations compared with the “control” groups. Likewise, regarding the mode of delivery, the “late motherhood” groups had lower rates of spontaneous delivery or delivery requiring at most manual help and higher rates of other modes of delivery compared with the “control” groups (Fig. 3). Subdividing the “late motherhood” groups further by age, we found that – for women with no or one previous live birth – the proportion with a spontaneous delivery or delivery requiring manual help decreased even further with increasing age. For women without previous live births the proportion with spontaneous delivery or requiring manual help was 52.1 % for women aged 34–40 years and 36.9 % for women aged 41–46 years (OR 1.9). For those with one previous live birth the difference was less: 72.7 % for women aged 36–41 years and 62.5 % for women aged 42–47 years (OR 1.6). For women with two previous live births there was no age dependence within the “late motherhood” group with regard to the proportion of women with a spontaneous delivery or requiring manual help: 76.4 % for women aged 39–43 years and 76.0 % for women aged 44–47 years (OR 1.0). However, note the relatively low case number in the last subgroup (Table 1).
Fig. 2 a.

to c Birth presentations in the “late motherhood” and “control” groups for women with no (a), one (b), and two (c) previous live births; groups were as defined in Fig. 1. OR – odds ratio (with 95 % confidence interval); * indicates statistical significance.
Fig. 3 a.

to c Modes of delivery in the “late motherhood” and “control” groups for women with no (a), one (b), and two (c) previous live births; groups were as defined in Fig. 1. OR – odds ratio (with 95 % confidence interval); * indicates statistical significance.
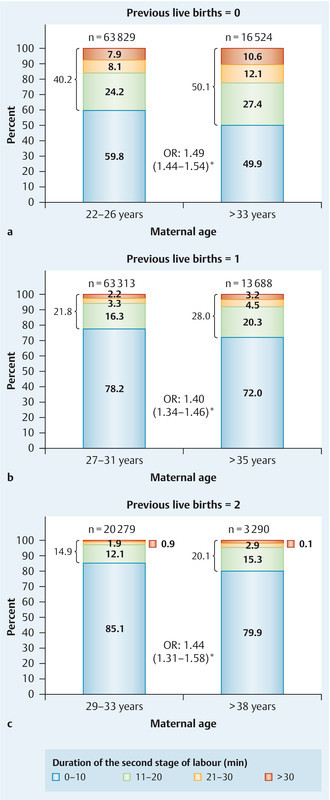
The proportions of women with a second stage of labour longer than 10 minutes were higher in the “late motherhood” groups (Fig. 4). The rates of neonates with a low birth weight (≤ 2499 g) were likewise greater in the “late motherhood” groups compared with the “control” groups (defined as in Fig. 1): 8.2 % vs. 5.3 % (OR 1.61 [1.52–1.70]) for women with no previous live births, 5.4 vs. 3 % (OR 1.83 [1.69–1.99]) for women with one previous live birth, and 7.5 vs. 3.8 % (OR 2.07 [1.80–2.38]) for women with two previous live births. Five-minute Apgar scores were also lower for children of women in the “late motherhood” groups. The proportions of children with an APGAR score of 8 or below were 9.3 vs. 7.9 % (OR 1.19 [1.13–1.25]) for the “late motherhood” vs. “control” groups of women with no previous live births, 7.1 vs. 5.2 % (OR 1.37 [1.28–1.47]) for women with one previous live birth, and 8 vs. 5.6 % (OR 1.46 [1.28–1.66]) for women with two previous live births (all groups as in Fig. 1).
Fig. 4 a.

to c Duration of the second stage of labour (in minutes) in the “late motherhood” and “control” groups for women with no (a), one (b), and two (c) previous live births; groups were as defined in Fig. 1. OR – odds ratio (with 95 % confidence interval); * indicates statistical significance.
Discussion
In this paper high risk, “late motherhood” groups of older pregnant women and low risk “control” groups were formed based on preterm birth rates and parity. We found that these groups of women also differed with regard to other important perinatal outcomes including birth presentation, mode of delivery, and duration of the second stage of labour 16. Our analysis may therefore be of help in defining what is “late motherhood” 17.
There are, however, some limitations to our approach. Most importantly, it was a retrospective, explorative analysis. The decision what is a high or low preterm birth rate for women of a given parity was made arbitrarily, based on the age dependence of preterm birth rates. Cut-points different to those chosen by us would also have been possible. Some important limitations arise because we were limited to data collected as part of the routine German Perinatal Survey. We could not verify the accuracy of the data and found that some data sets were incomplete. This accounts for the differences in the case numbers between analyses. Incomplete sets and some degree of data entry errors are inevitable in studies of this size. Furthermore, some information, for example on previous deliveries, was obtained from the medical history 18. Where communication was difficult due to language barriers, it is conceivable that such information may have been obtained incorrectly. We also had no information on the postnatal development of the children. This would have been an important outcome. Women having children late differ from those having children early with regard to socioeconomic characteristics 19, 20; this was not considered in the present paper. Therefore, our analysis needs to be replicated in other populations and in prospective studies before rigorous definitions of high and low risk groups can be arrived at 21.
To define what is “late motherhood” needs to take preterm birth rate and parity into account, but it also needs to consider other risks to mother and child and the relative importance of these risks 22. Furthermore, positive aspects of “late motherhood” should be considered. Birth at later maternal age can mean birth into a more secure socioeconomic environment.
Interestingly, the outcome for multiple pregnancies appears not to be inferior in women of advanced age compared with younger mothers. A recent study from Belgium even found that for twin pregnancies there was a lower incidence of preterm birth and low birth weight in primiparae aged 35 or over compared with primiparae aged 25–29 years 23. A study from the United States also found that among primiparae giving birth to twins, older women had a lower risk of very preterm delivery than women aged 25–29 years 24. A study from Greece compared twin pregnancies in women aged 35 years and older vs. women younger than 35. It found that for duration of pregnancy and birth weight there were no significant differences between younger and older mothers, though the rate of infants with a very low birth weight (less than 1500 g) was significantly higher for the older women 25. An older age at the last birth is also associated with longer maternal life span 26, 27, though this may be due to genetic make-up rather than the effects of a late pregnancy 28.
Plenty of evidence confirms higher perinatal risks in older mothers and their infants 29. Some studies indicate that good perinatal outcomes can be achieved for older women 30, even in postmenopausal women becoming pregnant after in vitro fertilization with donor oocytes 31. However, even though in some studies selected perinatal parameters may not appear inferior for older vs. younger mothers, on a population level perinatal risks are clearly higher in older women. Furthermore assisted reproduction in older women often is undertaken in selected, i.e. comparatively healthy, women.
Despite the above-mentioned limitations, we are confident that our analysis contributes to determining what is “late motherhood” from a risk perspective. Future work will need to take this approach further.
Footnotes
Conflict of Interest None.
References
- 1.Huang L, Sauve R, Birkett N. et al. Maternal age and risk of stillbirth: a systematic review. CMAJ. 2008;178:165–172. doi: 10.1503/cmaj.070150. [DOI] [PMC free article] [PubMed] [Google Scholar]
- 2.Montan S. Increased risk in the elderly parturient. Curr Opin Obstet Gynecol. 2007;19:110–112. doi: 10.1097/GCO.0b013e3280825603. [DOI] [PubMed] [Google Scholar]
- 3.Usta I M, Nassar A H. Advanced maternal age. Part I: obstetric complications. Am J Perinatol. 2008;25:521–534. doi: 10.1055/s-0028-1085620. [DOI] [PubMed] [Google Scholar]
- 4.Nassar A H, Usta I M. Advanced maternal age. Part II: long-term consequences. Am J Perinatol. 2009;26:107–112. doi: 10.1055/s-0028-1090593. [DOI] [PubMed] [Google Scholar]
- 5.Lampinen R, Vehviläinen-Julkunen K, Kankkunen P. A review of pregnancy in women over 35 years of age. Open Nurs J. 2009;3:33–38. doi: 10.2174/1874434600903010033. [DOI] [PMC free article] [PubMed] [Google Scholar]
- 6.Schoen C, Rosen T. Maternal and perinatal risks for women over 44 – a review. Maturitas. 2009;64:109–113. doi: 10.1016/j.maturitas.2009.08.012. [DOI] [PubMed] [Google Scholar]
- 7.Voigt M, Rochow N, Zygmunt M. et al. Risks of pregnancy and birth, birth presentation, and mode of delivery in relation to the age of primiparous women. Z Geburtshilfe Neonatol. 2008;212:206–210. doi: 10.1055/s-0028-1098732. [DOI] [PubMed] [Google Scholar]
- 8.Straube S, Voigt M, Jorch G. et al. Investigation of the association of Apgar score with maternal socio-economic and biological factors: an analysis of German perinatal statistics. Arch Gynecol Obstet. 2010;282:135–141. doi: 10.1007/s00404-009-1217-7. [DOI] [PMC free article] [PubMed] [Google Scholar]
- 9.Rath W H. Definitions and diagnosis of postpartum haemorrhage (PPH): underestimated problems! Geburtsh Frauenheilk. 2010;70:36–40. [Google Scholar]
- 10.Straube S, Voigt M, Scholz R. et al. 18th communication: preterm birth rates and maternal occupation – the importance of age and number of live births as confounding factors. Geburtsh Frauenheilk. 2009;69:698–702. [Google Scholar]
- 11.Voigt M, Briese V, Pietzner V. et al. Evaluierung von mütterlichen Merkmalen als Risikofaktoren für Frühgeburtlichkeit (Einzel- und Kombinationswirkung) Z Geburtshilfe Neonatol. 2009;213:138–146. doi: 10.1055/s-0029-1231027. [DOI] [PubMed] [Google Scholar]
- 12.Voigt M, Briese V, Carstensen M. et al. Age-specific preterm birth rates after exclusion of risk factors – an analysis of the German Perinatal Survey. Z Geburtshilfe Neonatol. 2010;214:161–166. doi: 10.1055/s-0030-1254140. [DOI] [PubMed] [Google Scholar]
- 13.Behrman R E, Butler A S, Institute of Medicine (US) Committee on Understanding Premature Birth and Assuring Healthy Outcomes, editors . Washington, DC: National Academies Press (US); 2007. Preterm Birth: Causes, Consequences, and Prevention. [PubMed] [Google Scholar]
- 14.Voigt M, Straube S, Fusch C. et al. Erhöhung der Frühgeborenenrate durch Rauchen in der Schwangerschaft und daraus resultierende Kosten für die Perinatalmedizin in Deutschland. Z Geburtshilfe Neonatol. 2007;211:204–210. doi: 10.1055/s-2007-981326. [DOI] [PubMed] [Google Scholar]
- 15.Heffner L J. Advanced maternal age – how old is too old? N Engl J Med. 2004;351:1927–1929. doi: 10.1056/NEJMp048087. [DOI] [PubMed] [Google Scholar]
- 16.Simoes E. Informed consent for cesarean delivery: method-associated morbidity gradients require the participation of pregnant women. Geburtsh Frauenheilk. 2010;70:732–738. [Google Scholar]
- 17.Beyer D A. Pregnancy risks and infant morbidity after assisted reproduction. Geburtsh Frauenheilk. 2010;70:30–35. [Google Scholar]
- 18.Haager-Burkert H. Perceived difficulties for clinics with maternity units in Germany in obtaining the certification “Baby Friendly Hospital”. Geburtsh Frauenheilk. 2010;70:726–731. [Google Scholar]
- 19.Toulemon L Who are the late mothers? Rev Epidemiol Sante Publique 200553(Spec No 2)2S13–2S24. [PubMed] [Google Scholar]
- 20.Hartge D R. Gravidas with a BMI above 25: challenges in antenatal and peripartal monitoring. Geburtsh Frauenheilk. 2010;70:463–471. [Google Scholar]
- 21.Gawlik S. Prenatal depression and anxiety – what is important for the obstetrician? Geburtsh Frauenheilk. 2010;70:361–368. [Google Scholar]
- 22.Billmann M-K. Pregnancies at an advanced maternal age: results from Zurich and review of the literature. Geburtsh Frauenheilk. 2010;70:273–280. [Google Scholar]
- 23.Delbaere I, Verstraelen H, Goetgeluk S. et al. Perinatal outcome of twin pregnancies in women of advanced age. Hum Reprod. 2008;23:2145–2150. doi: 10.1093/humrep/den134. [DOI] [PubMed] [Google Scholar]
- 24.Branum A M, Schoendorf K C. The influence of maternal age on very preterm birth of twins: differential effects by parity. Paediatr Perinat Epidemiol. 2005;19:399–404. doi: 10.1111/j.1365-3016.2005.00659.x. [DOI] [PubMed] [Google Scholar]
- 25.Prapas N, Kalogiannidis I, Prapas I. et al. Twin gestation in older women: antepartum, intrapartum complications, and perinatal outcomes. Arch Gynecol Obstet. 2006;273:293–297. doi: 10.1007/s00404-005-0089-8. [DOI] [PubMed] [Google Scholar]
- 26.Müller H G, Chiou J M, Carey J R. et al. Fertility and life span: late children enhance female longevity. J Gerontol A Biol Sci Med Sci. 2002;576:B202–B206. doi: 10.1093/gerona/57.5.b202. [DOI] [PubMed] [Google Scholar]
- 27.McArdle P F, Pollin T I, OʼConnell J R. et al. Does having children extend life span? A genealogical study of parity and longevity in the Amish. J Gerontol A Biol Sci Med Sci. 2006;61:190–195. doi: 10.1093/gerona/61.2.190. [DOI] [PubMed] [Google Scholar]
- 28.Smith K R, Gagnon A, Cawthon R M. et al. Familial aggregation of survival and late female reproduction. J Gerontol A Biol Sci Med Sci. 2009;64:740–744. doi: 10.1093/gerona/glp055. [DOI] [PMC free article] [PubMed] [Google Scholar]
- 29.Salihu H M, Shumpert M N, Slay M. et al. Childbearing beyond maternal age 50 and fetal outcomes in the United States. Obstet Gynecol. 2003;102:1006–1014. doi: 10.1016/s0029-7844(03)00739-7. [DOI] [PubMed] [Google Scholar]
- 30.Ziadeh S, Yahaya A. Pregnancy outcome at age 40 and older. Arch Gynecol Obstet. 2001;265:30–33. doi: 10.1007/s004040000122. [DOI] [PubMed] [Google Scholar]
- 31.Paulson R J, Boostanfar R, Saadat P. et al. Pregnancy in the sixth decade of life: obstetric outcomes in women of advanced reproductive age. JAMA. 2002;288:2320–2323. doi: 10.1001/jama.288.18.2320. [DOI] [PubMed] [Google Scholar]


