

Abstract
Motivation: Understanding gene regulation in Plasmodium, the causative agent of malaria, is an important step in deciphering its complex life cycle as well as leading to possible new targets for therapeutic applications. Very little is known about gene regulation in Plasmodium, and in particular, few regulatory elements have been identified. Such discovery has been significantly hampered by the high A-T content of some of the genomes of Plasmodium species, as well as the challenge in associating discovered regulatory elements to gene regulatory cascades due to Plasmodium's complex life cycle.
Results: We report a new method of using comparative genomics to systematically discover motifs in Plasmodium without requiring any functional data. Different from previous methods, our method does not depend on sequence alignments, and thus is particularly suitable for highly divergent genomes. We applied our method to discovering regulatory motifs between the human parasite, P.falciparum, and its rodent-infectious relative, P.yoelii. We also tested our procedure against comparisons between P.falciparum and the primate-infectious, P.knowlesi. Our computational effort leads to an initial catalog of 38 distinct motifs, corresponding to over 16 200 sites in the Plasmodium genome. The functionality of these motifs was further supported by their defined distribution within the genome as well as a correlation with gene expression patterns. This initial map provides a systematic view of gene regulation in Plasmodium, which can be refined as additional genomes become available.
Availability: The new algorithm, named motif discovery using orthologous sequences (MDOS), is available at http://www.ics.uci.edu/∼xhx/project/mdos/.
Contact: xhx@ics.uci.edu
Supplementary information: Supplementary data are available at Bioinformatics online.
1 INTRODUCTION
Comparative genomics provides a powerful tool for detecting regulatory elements in the genome. This is because functional elements often evolve at a much slower rate than neutral sequences due to selective pressure, and thus stand out from surrounding sequences by virtue of their greater levels of conservation. Previous work has demonstrated the utilities of comparative genomics for discovering novel regulatory motifs (Cliften et al., 2003) (Ettwiller et al., 2005; Kellis et al., 2003; Stark et al., 2007; Xie et al., 2005).
However, all these methods depend heavily on our ability of generating sequence alignments between the genomes that are being compared. The quality of the sequence alignment often has a huge effect on the success of the method. This could be problematic for distantly related species, for the sequence alignment between orthologous sequences might be impossible or be poor in quality. For instance, the two Plasmodium genomes, P.falciparum and P.yoelii are highly divergent, separated by over 100 million years of evolution (Carlton et al., 2002). This, coupled to the highly skewed AT nucleotide frequencies (∼80% AT on average) displayed in both genomes (Carlton et al., 2002; Gardner et al., 2002), has made it especially difficult to generate reliable sequence alignment between non-coding sequences of these two genomes. As such, no genome-wide motif discovery project using comparative genomics has been carried out previously in Plasmodium.
Recently, a method for motif discovery was developed that does not rely on sequence alignment (Elemento and Tavazoie, 2005), in which they measured the conservation of a motif by first calculating the frequency of motif co-occurrence in orthologous promoters, and subsequently quantified the significance of the observed number by assuming a null model in which the motif has equal probability to appear in any of the promoters. Although having been successfully applied for motif discovery in a number of species, the assumption underlying the model is, however, an over simplification due to two conditions. First, it does not account for the fact that orthologous sequences have a higher probability of sharing a motif than non-orthologous sequences due to their shared ancestries. As such, their method often suffers from the problem of inflated P-values. Second, the method ignores differences in promoter sequence length, which can also lead to unequal probabilities of motif occurrences. Our goal in this article is to propose a new method for measuring motif conservation that can account for both the orthologous relationships as well as unequal promoter sequence length.
We feel that the inherent difficulty in analyzing the Plasmodium genomes provides a unique opportunity to test our new comparative genomics approach to discovering regulatory elements. Beyond the analytical challenge, genomic analysis of Plasmodium has great interest to world health. Malaria infects nearly half a billion people annually, with 1–3 million deaths occurring as a result. Plasmodium is a protozoan parasite that infects vertebrate hosts as diverse as lizards (P.minasense), chickens (P.gallinaceum), rodents (P.yoelii) and humans (P.falciparum). The life cycle of Plasmodium is very complex, involving many distinct morphological and biological forms transitioning between assorted tissue and cell types as well as two obligatory hosts (vertebrate and vector insects, e.g. mosquitoes) (Tuteja, 2007). Distinct expression patterns can be observed for the various life stages as described by transcriptome and proteome analysis (Kooij et al., 2006; Le Roch et al., 2003; 2004; Llinas and del Portillo, 2005; Wilson, 2004). Despite the apparent well-coordinated expression patterns, detailed mechanisms of gene regulation behind the expression patterns seem rather complex and remain elusive (Deitsch et al., 2007; Gunasekera et al., 2007; Horrocks et al., 1998; Le Roch et al., 2004). In particular, the extent of transcriptional regulation in Plasmodium is still unclear, and few regulatory elements have been discovered (Deitsch et al., 2007; Gunasekera et al., 2007; Horrocks et al., 1998; Le Roch et al., 2004). Fully understanding these regulatory mechanisms will be essential for deciphering the complex life cycle of Plasmodium, and may lead to possible avenues for therapeutic development.
2 METHODS
2.1 Basic definitions
Suppose we are given N orthologous gene pairs between species A and B. Let SiA and SiB denote the regulatory sequences of gene i in species A and B, respectively, for all i = 1,…, N. Denote the length of SiB as niB, which are not necessarily equal for different sequences.
Consider a particular regulatory motif m. Suppose it occurred in the regulatory sequences of nA genes in species A and the regulatory sequences of nB genes in species B, and among these genes, nAB are orthologous pairs. We would like to determine the probability for this to happen by chance.
If the motif m has equal chance to occur in any of the N sequences in both A and B, the probability of observing nAB shared gene pairs can be described by the hypergeometric distribution. However, in reality, this is rarely the case due to two main reasons. First, the regulatory sequences may differ significantly in length, which can lead to highly uneven probabilities of random occurrences in different genes. Second, regulatory sequences of orthologous genes share ancestries, and as such can be highly correlated. This correlation can seriously undermine the assumption underlying the hypergeometric distribution.
We propose a new statistical model that can correct for complications due to the shared ancestries and the unequal sequence length. Specifically, we model the random occurrences of a motif by two processes: (1) occurrence through a background rate of β per nucleotide; and (2) occurrence due to orthologous relationship: if a motif appears in the regulatory sequence of a gene in species A, the motif will be preserved in the corresponding ortholog of the gene in species B with probability α.
With the above model, we can now write down the probability for the motif to occur in each sequence. Take the i-th gene in species B, for example. If the motif did not appear in SiA of species A (denoted as miA=0), the probability of observing the motif in SiB (denoted as miB=1) is
| (1) |
where we have assumed a binomial model for random occurrences of the motif. On the other hand, if the motif appeared in SiA of species A (miA=1), the probability of observing the motif in SiB (i.e. miB=1, after accounting for the orthologous correlation, is
| (2) |
Therefore, according to whether the motif appeared in regulatory sequences of species A, we can determine the probability of the motif occurrence in corresponding sequences in species B, accounting for both orthologous relationships and sequence length. We will use this as our null model for estimating how many genes with motif occurrence in both species are expected by chance.
2.2 Calculating statistical significance
We now go back to our original question on how to calculate statistical significance of observing nAB shared gene pairs for a motif, given that it occurred in nA genes in species A and nB genes in species B. Denote by miA∈{0, 1} the motif occurrences in genes of species A. Using Equations (1) and (2), we can calculate the probability for the motif to occur in the regulatory sequence of each gene in species B. Let pi denote such probabilities for all i=1,…, N. Suppose we pick nB genes randomly without replacement from the list of N genes in species B, with probability of choosing each gene proportional to p. The number of chosen genes with corresponding miA=1 defines a null model on the distribution of nAB.
The null model described earlier can be viewed as a generalization of the standard hypergeometric distribution, which corresponds to a special case where pi=1/N for all i. However, unlike the standard hypergeometric distribution, the distribution of nAB for more general forms of p is difficult to obtain analytically, and in most cases one has to resort to numerical simulation for estimating the distribution. This brings in considerable computational burden and is not desirable for motif discovery since we are testing tens of thousands of candidate motifs. Fortunately, we demonstrate in the Supplementary Material that the numerical sampling step can be eliminated entirely. This is due to the fact that nAB can be viewed as a sum of nB binary random variables. When nA and nB are not too small (which is case for real motifs), the distribution of nAB can be well approximated by a normal distribution. If we know the mean and variance of nAB, its distribution can then be fully specified. In the Supplementary Material, we prove that both the mean (μ) and the variance (σ2) of nAB for any form of p can be derived analytically and be calculated via the following formula:
| (3) |
| (4) |
where φ=∑ipimiA.
Provided with μ and σ, we define a conservation z-score to quantify the significance of the observed nAB as z-score=(nAB−μ)/σ. Because both μ and σ can be calculated analytically, the generalized hypergeometric distribution provides a fast and flexible statistical framework for defining the conservation score.
2.3 Learning parameters
We estimate parameters α and β based on the given regulatory sequences. Consider a motif with occurrences in species A denoted by miA∈{0, 1}, and occurrences in species B denoted by miB∈{0, 1}. The estimation of background rate β is relatively easy. We use the empirical frequency in all regulatory sequences of species B as an estimation of the background rate.
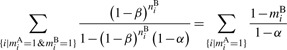
We use maximum likelihood method to estimate the parameter α. First, we notice that the log likelihood of observing motif occurrences in the regulatory sequences of species B can be written as
where we have excluded terms independent of α. The optimal α can be found by setting ∂ logL/∂ α=0, which is equivalent to finding the root of the following equation:
 |
which can be solved numerically, using, for instance, the Newton's method.
We assume equal β for motifs with the same size and similar AT content. For all k-mers with size k, we group them into k+1 classes depending on the number of CG nucleotides they contain. Within each class, we assign one β, which is taken to be the median of the estimated β values of all k-mers in the class. By using median, we hope to reduce the estimation error of the maximum likelihood estimator and to dilute the effect of increased β caused by true functional motifs.
2.4 Expanding k-mers to include degenerate code
We started by calculating conservation z-scores for all k-mers with size ranging from 6 bp to 8 bp. After identifying significantly conserved k-mers (with z-score above 2), we further proceeded to optimize these k-mers by introducing degenerate codes to certain positions. We used the conservation z-score as our objective function, and checked whether making any position degenerate could lead to an increased z-score. We used six types of 2-fold degenerate codes (R=[GA], Y=[CT], M=[AC], K=[GT], S=[GC], W=[AT]) and one 4-fold generate code (N). The degenerate codes are introduced iteratively. To calculate the conservation z-score of a degenerate motif, we first enumerate all potential k-mers consistent with the motif, and then calculate a new probability vector p for the motif using
where n is the total number of k-mers consistent with the motif, and pij is the probability of the j-th k-mer to occur in sequence i of species B. At each iteration, the motif with the highest z-score after introducing one degenerate code is kept and used for next round of optimization. For our analysis, we only allowed at most two degenerate codes in the motifs.
2.5 Gene orthology, upstream and downstream sequences
We used the orthologous gene maps between P.falciparum, P.yoelii generated by the OrthoMCL database (version 2, Li et al., 2003). Only gene pairs with one-to-one mapping were used. Overall, we curated 3512 gene pairs between P.falciparum and P.yoelii, and similarly 4084 gene pairs between P.falciparum and P.knowlesi. Sequences upstream and downstream of these genes were extracted from the PlasmoDB database (version 5.4, Bahl et al., 2003). For upstream sequences dataset, we extracted sequences in regions 1 kb upstream of the reported start codon, and 1 kb downstream from the reported stop codon for the downstream dataset. If there was a gene predicted to occur in either of these regions, the sequence was truncated accordingly to remove its presence.
3 RESULTS
3.1 Motif discovery in Plasmodium
We first checked the occurrences of all 7mer motifs in the upstream sequences of the 3512 (N) curated orthologous gene pairs of P.falciparum and P.yoelii. For each 7mer, we counted the number of genes containing at least one instance of the 7mer in its upstream sequence for each species separately (denoted the numbers by nF for P.falciparum and nY for P.yoelii). In addition, we also counted the number of genes containing at least one instance in the orthologous upstream sequences of both species (nFP). If the 7mer has equal probability to occur upstream in each of the genes, the number of co-occurrences nFP should follow the hypergeometric distribution with mean number nFnY/N. However, we noticed that there are many 7mers with an observed number of co-occurrences much higher than what is expected by chance. For instance, the 7mer AAAGACA appeared in 135 genes of P.falciparum and 201 genes of P.yoelii. By chance, only 7.7 genes are expected to possess the motif in both species. Instead, we observed 30 genes with co-occurred instances, nearly 4-fold higher than the expected number. This suggests that this 7mer motif showed a much higher level of evolutionary conservation than what we would expect by chance.
Of course, in reality the probability for a 7mer to occur in a promoter region for each of the genes is unlikely to be equal due to two main conditions. First, upstream sequences of orthologous genes share the same ancestry, and consequently if a 7mer occurs in P.falciparum, it will have a higher probably to also appear its P.yoelii ortholog, as opposed to a non-orthologous sequence. Second, upstream sequences can be of different lengths (e.g. a close neighboring gene can limit the intergenic region shared between both genes), which could lead to a bias of a higher probability for longer sequences as compared to shorter sequences (i.e. there is a greater probability of a motif occurring in a longer sequences simply by chance). These two factors could potentially complicate the conservation analysis performed earlier.
We have developed a new computational method to measure the conservation level of a motif, which accounts for the above-mentioned complications (see Section 2). The method does not require sequence alignment, and thus is particularly suitable for motif discovery in highly divergent genomes, such as the two Plasmodium genomes in the current study (separated by over 100 million years; Carlton et al., 2002). Importantly, our method also accounts for the increase in probability for motif co-occurrences in orthologous sequences. In our 7mer example discussed earlier, after correcting for orthologous correlation and unequal sequence length, we estimated that the AAAGACA motif has a conservation z-score of 7.5, which means that the number of observed co-occurrences is 7.5 SDs away from what is expected by chance.
We applied our method to characterize the conservation of all 7mer motifs. Because the Plasmodium genomes are AT-rich (∼80% of the genomes consists of AT nucleotides), we focused on motifs that contain at least one C or G nucleotide. The distribution of z-scores for these motifs is shown in Figure 1A. Overall, the distribution roughly follows a normal distribution. However, while the left side of the curve fits a normal distribution, the right-hand side deviates significantly from the normal distribution, displaying a much fatter tail. We estimated about 9% of the 7mers located to this tail, and thus, have extra levels of conservation than would be expected by chance.
Fig. 1.

Distribution of conservation z-score for all 7mers. Shown here are histograms of the z-scores for (A) measured between orthologous promoter sequences of P.falciparum and P.yoelii, and (B) measured between control orthologous promoter sequences. The dotted lines are normal distribution with mean 0 and variance 1. The blue region represents the portion of 7mers with z-score above the normal distribution and larger than 1.
As a comparison, we also generated a set of control sequences by randomly shuffling nucleotide sequences in P.yoelii, while keeping the sequence length and background levels of orthologous conservation levels unchanged. We calculated the conservation z-scores of 7mers in the control sequences using the same method described earlier. In contrast to the real sequences, the z-score distribution fits the normal distribution well on both sides (Fig. 1B). This suggests that the high level of conservation observed for some 7mers in the Plasmodium genomes is unlikely caused purely by chance.
3.2 Testing the algorithm against model organisms
Little is known about the transcriptional regulation in the Plasmodium genome and only a few motifs have been reported. To test the performance of our algorithm, we checked whether our method could identify functional motifs in three model organisms—Saccharomyces cerevisiae, Caenorhabditis elegans and Drosophila melanogaster, representing three phyla (yeast, worm and fly). For yeast, we used the upstream sequences of 4358 orthologus genes between S.cerevisiae and S.bayanus. For worm, we used the upstream sequences of 10 894 orthologous genes between C.elegans and C.briggsae. For fly, we used the upstream sequences of 11 306 orthologous genes between D.melanogaster and D.pseudoobscura (Supplementary Material).
For each genome pair, we calculated the conservation z-scores of all 7mers, and ranked the 7mers based on their z-scores from high to low. We then determined whether our 7mers matched to the known motifs deposited in the Transfac database, and whether the ranks of these 7mers are biased. A bias toward the lower ranks would indicate an enrichment of the matching k-mers with high conservation z-scores. To test the significance of the enrichment, we used Kolmogorov–Smirnov statistics. Based on the statistics, we found that the P-values of the enrichment for the three species are 10−14, 10−15 and 10−34 for yeast, worm and fly, respectively, suggesting that the algorithm is indeed able to separate functional motifs from neutral ones. More detailed analysis of the motifs in these organisms is presented in the Supplementary Material.
3.3 Expanding to degenerate codes and clustering
Regulatory motifs are frequently degenerate, that is, they often tolerate sequence variation at certain positions. After identifying an initial list of significant 7mers (with z-score >3) in Plasmodium, we further determined whether making nucleotides degenerate at some positions would improve the conservation z-score received. We hypothesized that as the z-score increased we were likely deriving the ‘truer’ motif. We have developed an efficient procedure for optimizing this motif pattern discovery process, and have identified motifs delivering the highest z-scores (see Section 2). For instance, the 7mer AAAGACA discussed earlier can be optimized to be WWAGACA with a z-score=11. This analysis represents a proof-of-principle analysis, because of course, regulatory motifs can be >7 nt in length, and thus, a better but albeit more computationally expensive process would be to expand such an analysis in both directions from the core of our discovered motifs.
We also performed the same procedure for k-mers motifs with size 6 and 9 bp. Because many of the discovered motifs are similar and likely represent different variants of the same motif, we further combined the identified motifs, and grouped them into distinct clusters, using a procedure developed previously (Xie et al., 2005). This exercise leads to a final list of 38 distinct motifs (Table 1, Supplementary Material), using a stringent cutoff of z-score=4.6 (or P-value <2e−6)
Table 1.
List of motifs discovered in regions upstream of genes
| Number | Number | Number in | Z-score | Z-score | |
|---|---|---|---|---|---|
| Motif | in PF | in PY | PF and PY | (PF:PY) | (PF:PK) |
| TGTCTW | 537 | 531 | 192 | 13.91 | 17.73 |
| TGTSTR | 1492 | 1414 | 786 | 12.29 | 12.41 |
| NTTGTCTN | 325 | 323 | 93 | 10.80 | 11.11 |
| GTGTRY | 1345 | 1305 | 648 | 9.78 | 8.44 |
| GTSTAN | 1701 | 1654 | 945 | 8.91 | 8.28 |
| TTKNTTG | 2536 | 2045 | 1585 | 6.35 | 2.04 |
| ATSTST | 1578 | 1356 | 719 | 6.34 | 6.51 |
| TTTKTTK | 2533 | 1984 | 1535 | 6.10 | 2.74 |
| TTNTTTKG | 2198 | 1640 | 1135 | 5.93 | 1.93 |
| YCTAYA | 1705 | 1505 | 834 | 5.84 | 6.45 |
| NKTGTC | 1048 | 995 | 376 | 5.84 | 5.58 |
| TTNTTGTY | 1601 | 1077 | 583 | 5.71 | 3.40 |
| AYACATM | 2490 | 1765 | 1357 | 5.40 | 1.21 |
| TTNTTTTWG | 1860 | 1182 | 714 | 5.26 | 2.94 |
| TGWTCTA | 235 | 164 | 29 | 5.22 | 0.37 |
| GTTSTM | 905 | 758 | 261 | 5.21 | 1.85 |
| TAKASA | 2904 | 2480 | 2143 | 5.10 | 0.05 |
| GATAKATR | 981 | 621 | 236 | 5.04 | −0.49 |
| TWNTTTG | 2878 | 2444 | 2087 | 5.03 | 1.06 |
| TRTACR | 2872 | 2403 | 2056 | 5.02 | 1.87 |
| KACATWTAT | 1872 | 760 | 487 | 5.00 | 1.96 |
| ACKAGC | 63 | 199 | 15 | 4.98 | 0.76 |
| YTMTGATT | 267 | 228 | 39 | 4.93 | 0.10 |
| TKTCTAWA | 557 | 459 | 116 | 4.93 | 0.74 |
| ATAMTAMG | 362 | 311 | 60 | 4.85 | −2.14 |
| TTNGTY | 2719 | 2382 | 1934 | 4.82 | 1.70 |
| TCTNTAWT | 938 | 710 | 245 | 4.78 | 1.53 |
| MATATACTA | 92 | 111 | 12 | 4.75 | 0.40 |
| WAWAATGA | 1284 | 1005 | 440 | 4.74 | 2.48 |
| AAACRR | 1846 | 2108 | 1205 | 4.73 | 4.40 |
| RTGTNG | 1416 | 1275 | 596 | 4.68 | 2.93 |
| TANAYAT | 2986 | 2357 | 2088 | 4.67 | 0.77 |
| AMTTAGRT | 113 | 99 | 13 | 4.66 | −0.75 |
| AAGMAATWA | 394 | 278 | 59 | 4.65 | −2.00 |
| TRYATATA | 2671 | 1760 | 1428 | 4.62 | 1.90 |
| RCACATKTT | 165 | 210 | 29 | 4.61 | 0.76 |
| ARAGAGAAR | 241 | 200 | 36 | 4.60 | −2.63 |
| TYCTNTA | 1714 | 1230 | 678 | 4.60 | 3.28 |
PF, P.Falciparum; FY, P.yoelii; PK, P.knowlesi.
3.4 Additional evidence for functionality of the motifs
As these motifs are identified from purely computational procedures, next we asked whether we could find additional, independent evidences to support the functionality of these motifs.
3.4.1 Conservation in other Plasmodium species
We determined the conservation of these motifs in a third, independent species. Recently, the genome sequence of primate-infectious P.knowlesi became available [PlasmoDB (Bahl et al., 2003)]. We calculated z-scores for the 38 motifs that we identified in the previous analysis, for conservation between P.falciparum and P.knowlesi. Interestingly, most of these motifs also showed conservation in P.knowlesi. Of them, 87% have positive z-scores, with 61% of them having z-scores above 1.5 (Fig. 2). However, we also observed a few motifs that show poor conservation in P.knowlesi. Whether these motifs are lineage-specific and have led to diverged regulatory programs are interesting questions that need to be studied further.
Fig. 2.

Comparison of conservation z-scores derived from two sets of genome comparison. The blue bar represents z-scores derived from the P.falciparum (pfa) and P.yoelii (pyo) comparison, whereas red bar presents z-scores derived from the P.falciparum and P.knowlesi (pkn) comparison. (A) 38 motifs with z-score >4.6. (B) all motifs with z-score >3.
3.4.2 Positional bias of motif sites relative to genes
We determined the locations of motif instances relative to the start codon for each gene. The upstream sequences have unequal length, and thus, we confined our analysis to a subset of genes with sequences predicted to be at least 500 bp in both species. We used the coding start as our reference because the transcriptional start sites are unknown for most genes in Plasmodium, which certainly affects our location analysis. Nonetheless, we observed a strong bias of positional distribution in regions near coding starts (Fig. 3). This is consistent with the notation that these motifs are involved in the transcriptional regulation of genes.
Fig. 3.

Distribution of motif sites relative to the start codon of genes in P.falciparum.
3.4.3 Enrichment in functional gene sets
We checked the expression patterns of the genes that possess our discovered motifs in their upstream regions. For this analysis, we used the 21 functional gene sets curated previously Young et al. (2008). These gene sets were derived using an ontology-based pattern identification algorithm to group genes with similar expression patterns measured in different stages of P.falciparum life cycle. For each of the 38 motifs, we identified genes that contain the motif in their upstream regions in both P.falciparum and P.yoelii, which we refer to as motif–gene sets. We tested the enrichment of these motif–gene sets in each of the 21 functional gene sets as defined by Young et al. (2008) using hypergeometric statistics. Most of the motifs displayed a strong enrichment in at least one of the functional gene sets (Fig. 4). Eighty-four percent of the motifs showed an enrichment P-value of <0.01 in at least one of functional gene sets, with 15 motifs showing especially high enrichment, with P-values <10−5.
Fig. 4.

Enrichment of discovered motifs in different functional gene sets. Motifs are in the rows and the functional gene sets in columns. P-values for enrichment are coded as pseudo-color. Only motif–gene set pairs with P-value <0.01 are shown. Scale=−log10 (P-value).
3.4.4 Comparison to previous discovered motifs
We also compared our 38 motifs to those reported recently by Young et al. (2008) and Gunasekera et al. (2007). Using a different strategy for motif discovery, Young et al. identified 34 motifs and Gunasekera et al. identified 3 motifs in P.falciparum. Using a similarity score cutoff of 0.75 (Xie et al., 2005), seven of our motifs matched to those previously identified (Supplementary Material). As a comparison, we also generated a control list of 38 motifs by randomly shuffling the bases of the discovered motifs, and none of these control motifs matched to the previously reported motifs. It is worth noting that the previous two papers use a different strategy for motif discovery, by searching for motifs enriched in the promoters of functionally related genes. The fact that the seven motifs show strong cross-species conservation provides additional evidence supporting functionality of these motifs. Interestingly, the most highly conserved motif we discovered, TGTCTW, also shows the most significant enrichment in the sexual development gene set (Young et al., 2008).
Taken together, the combined evidence suggests that the 38 motifs we discovered likely represent true functional motifs. The list provides a short, but reliable set of candidates for future experimental studies.
3.5 Motifs discovered in downstream regions
So far, we have focused on motif discovery in regions upstream of genes. It is well known that sequences downstream of genes also play important roles in gene regulation, commonly act via post-transcriptional mechanisms (a feature suggested for Plasmodium gene regulation; Deitsch et al., 2007). We have also sought to discover motifs that occur downstream of genes. However, one caveat of the analysis is that 3′UTRs for most Plasmodium genes have not been mapped. We, therefore, used sequences downstream from reported stop codons up to 1 kb as a surrogate to 3′UTR sequences. Applying the same procedure as employed for upstream sequences, we found 11 motifs displaying high conservation in downstream regions (z-score >4.6, Table 2, Supplementary Material). These motifs are distinct from the motifs discovered in upstream regions, and few of these downstream motifs have been reported previously in Plasmodium. The initial map of the downstream motifs could provide useful directions for future studies on post-transcriptional gene regulation in Plasmodium.
Table 2.
List of motifs discovered in regions downstream of genes
| Number | Number | Number in | Z-score | Z-score | |
|---|---|---|---|---|---|
| Motif | in PF | in PY | PF and PY | (PF:PY) | (PF:PK) |
| TYTTTTNGT | 1443 | 1026 | 552 | 7.50 | 11.46 |
| TTKTTTTR | 1783 | 1399 | 840 | 6.48 | 8.52 |
| TAGNAKTT | 221 | 302 | 46 | 5.45 | −0.76 |
| AGYRTTT | 413 | 533 | 111 | 5.45 | 1.13 |
| GGARGG | 78 | 93 | 11 | 5.30 | 0.26 |
| TTYGYCTA | 94 | 129 | 16 | 5.28 | 0.48 |
| ARTATKGTT | 133 | 99 | 16 | 5.10 | −1.42 |
| CWCRAA | 898 | 1086 | 355 | 4.77 | 3.24 |
| ATTGTKT | 720 | 879 | 245 | 4.74 | 1.27 |
| TACAAKTTT | 101 | 186 | 19 | 4.68 | −2.54 |
| ATYAAYCA | 140 | 142 | 19 | 4.61 | 0.49 |
PF, P.Falciparum; FY, P.yoelii; PK, P.knowlesi.
4 DISCUSSION
In summary, we have developed a novel computational method for motif discovery in highly divergent genomes, and applied this procedure to the discovery of regulatory motifs in Plasmodium. We discovered 26 highly conserved motifs and provided additional evidences to support the functionality of these motifs.
Our prediction method depends on comparative genomics to boost the signal-to-noise ratio of the motif signals. It is known that many regulatory sites are lineage-specific and do not appear to be conserved in other species (King et al., 2007). For these motif sites, methods other than sequence comparison are required. One potential direction could be to search for local clustering of motif sites rather than individual sites, as well as to combine sequence data with experimental data (e.g. microarray, high-throughput transcriptome analysis, etc.), the utility of which has been successfully demonstrated recently by two studies analyzing Plasmodium regulatory motifs (Elemento et al., 2007; Young et al., 2008). It would be interesting to develop a coherent model that can integrate cross-species sequence data and functional data for motif discovery.
The motifs we discovered mapped to over 13 000 sites in the P.Falciparum genome and may be incorporated into regulatory networks that can help in providing putative functional annotations to uncharacterized proteins (Zhou et al., 2008) as well as employing a systems biology approach in drug discovery (Winzeler, 2006).
The computational analysis for regulatory motif discovery presented here is, of course, only a first step toward a comprehensive mapping of regulatory elements in Plasmodium, and represents a proof of principle concept. The genomes of numerous members of the Plasmodium genus have been (and are being) sequenced (Coppel et al., 2004; Kooij et al., 2006). With the availability of these additional Plasmodium genomes, as well as a more exhaustive means of identifying motifs, the catalog of regulatory motifs can be further refined. A comprehensive mapping of regulatory motifs and their sites will significantly enhance our understanding of gene regulations in Plasmodium, and hopefully aid us in designing more efficient and targeted drugs in combating malaria.
Our approach can certainly be used to discover regulatory elements in other species, and we believe, with the flexibility of the underlying statistical model, its non-requirement for sequence alignment, and accounting for neutral conservation between orthologous sequences, our method provides an opportunity to discover regulatory elements in challenging comparisons. One such problematic comparison that we have begun to analyze is between the malaria mosquito, Anopheles gambiae, and the yellow fever mosquito, Aedes aegypti. Hopefully, our new methodology can help to elucidate the machinery of gene regulation in these challenging and less well-studied genomes.
Supplementary Material
ACKNOWLEDGEMENTS
We thank genome consortiums for making the sequence of Plasmodium genomes publicly available.
Funding: The project is supported by funding from University of California, Irvine.
Conflict of Interest: none declared.
REFERENCES
- Bahl A, et al. PlasmoDB: the Plasmodium genome resource. A database integrating experimental and computational data. Nucleic Acids Res. 2003;31:212–215. doi: 10.1093/nar/gkg081. [DOI] [PMC free article] [PubMed] [Google Scholar]
- Carlton JM, et al. Genome sequence and comparative analysis of the model rodent malaria parasite Plasmodium yoelii yoelii. Nature. 2002;419:512–519. doi: 10.1038/nature01099. [DOI] [PubMed] [Google Scholar]
- Cliften P, et al. Finding functional features in Saccharomyces genomes by phylogenetic footprinting. Science. 2003;301:71–76. doi: 10.1126/science.1084337. [DOI] [PubMed] [Google Scholar]
- Coppel RL, et al. The genomics of malaria infection. Trends Parasitol. 2004;20:553–557. doi: 10.1016/j.pt.2004.10.002. [DOI] [PubMed] [Google Scholar]
- Deitsch K, et al. Mechanisms of gene regulation in Plasmodium. Am. J. Trop. Med. Hyg. 2007;77:201–208. [PubMed] [Google Scholar]
- Elemento O, Tavazoie|S. Fast and systematic genome-wide discovery of conserved regulatory elements using a non-alignment based approach. Genome Biol. 2005;6:R18. doi: 10.1186/gb-2005-6-2-r18. [DOI] [PMC free article] [PubMed] [Google Scholar]
- Elemento O, et al. A universal framework for regulatory element discovery across all genomes and data types. Mol. Cell. 2007;28:337–350. doi: 10.1016/j.molcel.2007.09.027. [DOI] [PMC free article] [PubMed] [Google Scholar]
- Ettwiller L, et al. The discovery, positioning and verification of a set of transcription-associated motifs in vertebrates. Genome Biol. 2005;6:R104. doi: 10.1186/gb-2005-6-12-r104. [DOI] [PMC free article] [PubMed] [Google Scholar]
- Gardner MJ, et al. Genome sequence of the human malaria parasite Plasmodium falciparum. Nature. 2002;419:498–511. doi: 10.1038/nature01097. [DOI] [PMC free article] [PubMed] [Google Scholar]
- Gunasekera AM, et al. Regulatory motifs uncovered among gene expression clusters in Plasmodium falciparum. Mol. Biochem. Parasitol. 2007;153:19–30. doi: 10.1016/j.molbiopara.2007.01.011. [DOI] [PubMed] [Google Scholar]
- Horrocks P, et al. Control of gene expression in Plasmodium falciparum. Mol. Biochem. Parasitol. 1998;95:171–181. doi: 10.1016/s0166-6851(98)00110-8. [DOI] [PubMed] [Google Scholar]
- Kellis M, et al. Sequencing and comparison of yeast species to identify genes and regulatory elements. Nature. 2003;423:241–254. doi: 10.1038/nature01644. [DOI] [PubMed] [Google Scholar]
- King DC, et al. Finding cis-regulatory elements using comparative genomics: some lessons from ENCODE data. Genome Res. 2007;17:775–786. doi: 10.1101/gr.5592107. [DOI] [PMC free article] [PubMed] [Google Scholar]
- Kooij TW, et al. Plasmodium post-genomics: better the bug you know? Nat. Rev. Microbiol. 2006;4:344–357. doi: 10.1038/nrmicro1392. [DOI] [PubMed] [Google Scholar]
- Le Roch KG, et al. Discovery of gene function by expression profiling of the malaria parasite life cycle. Science. 2003;301:1503–1508. doi: 10.1126/science.1087025. [DOI] [PubMed] [Google Scholar]
- Le Roch KG, et al. Global analysis of transcript and protein levels across the Plasmodium falciparum life cycle. Genome Res. 2004;14:2308–2318. doi: 10.1101/gr.2523904. [DOI] [PMC free article] [PubMed] [Google Scholar]
- Li L, et al. OrthoMCL: identification of ortholog groups for eukaryotic genomes. Genome Res. 2003;13:2178–2189. doi: 10.1101/gr.1224503. [DOI] [PMC free article] [PubMed] [Google Scholar]
- Llinas M, del Portillo HA. Mining the malaria transcriptome. Trends Parasitol. 2005;21:350–352. doi: 10.1016/j.pt.2005.06.009. [DOI] [PubMed] [Google Scholar]
- Stark A, et al. Discovery of functional elements in 12 Drosophila genomes using evolutionary signatures. Nature. 2007;450:219–232. doi: 10.1038/nature06340. [DOI] [PMC free article] [PubMed] [Google Scholar]
- Tuteja R. Malaria – an overview. FEBS J. 2007;274:4670–4679. doi: 10.1111/j.1742-4658.2007.05997.x. [DOI] [PubMed] [Google Scholar]
- Wilson RJ. The transcriptome: malariologists ride the wave. Bioessays. 2004;26:339–342. doi: 10.1002/bies.20025. [DOI] [PubMed] [Google Scholar]
- Winzeler EA. Applied systems biology and malaria. Nat. Rev. Microbiol. 2006;4:145–151. doi: 10.1038/nrmicro1327. [DOI] [PubMed] [Google Scholar]
- Xie X, et al. Systematic discovery of regulatory motifs in human promoters and 3′ UTRs by comparison of several mammals. Nature. 2005;434:338–345. doi: 10.1038/nature03441. [DOI] [PMC free article] [PubMed] [Google Scholar]
- Young JA, et al. In silico discovery of transcription regulatory elements in Plasmodium falciparum. BMC Genomics. 2008;9:70. doi: 10.1186/1471-2164-9-70. [DOI] [PMC free article] [PubMed] [Google Scholar]
- Zhou Y, et al. Evidence-based annotation of the malaria parasite's genome using comparative expression profiling. PLoS ONE. 2008;3:e1570. doi: 10.1371/journal.pone.0001570. [DOI] [PMC free article] [PubMed] [Google Scholar]
Associated Data
This section collects any data citations, data availability statements, or supplementary materials included in this article.