Abstract
Introduction
Given the ever increasing number of obese patients and obesity related bypass surgery, dosing recommendations in the post-bypass population are needed. Using a population pharmacokinetic (PK) analysis and PK–pharmacodynamic (PD) simulations, we investigated whether adequate moxifloxacin concentrations are achieved in this population.
Methods
In this modelling and simulation study we used data from a trial on moxifloxacin PK. In this trial, volunteers who had previously undergone bariatric surgery (at least 6 months prior to inclusion), received two doses (intravenous and oral) of 400 mg moxifloxacin administered on two occasions.
Results
In contrast to other papers, we found that moxifloxacin PK were best described by a three compartmental model using lean body mass (LBM) as a predictor for moxifloxacin clearance. Furthermore, we showed that the probability of target attainment for bacterial eradication against a hypothetical Streptococcus pneumoniae infection is compromised in patients with higher LBM, especially when targeting microorganisms with minimum inhibitory concentrations (MICs) of 0.5 mg l−1 or higher (probability of target attainment (PTA) approaching zero). When considering the targets for suppression of bacterial resistance formation, even at MIC values as low as 0.25 mg l−1, standard moxifloxacin dosing does not attain adequate levels in this population. Furthermore, for patients with a LBM of 78 kg or higher, the probability of hitting this target approaches zero.
Conclusions
Throughout our PK–PD simulation study, it became apparent that, whenever optimal bacterial resistance suppression is deemed necessary, the standard moxifloxacin dosing will not be sufficient. Furthermore, our study emphasizes the need for a LBM based individualized dosing of moxifloxacin in this patient population.
Keywords: bariatric surgery, moxifloxacin, NONMEM, PK-PD, pharmacokinetics
WHAT IS ALREADY KNOWN ABOUT THIS SUBJECT
Oral bioavailability of moxifloxacin is not altered in post-bariatric surgery patients compared with healthy controls.
In healthy volunteers, a standard 400 mg moxifloxacin dose achieves adequate plasma concentrations for the eradication of the infecting micro-organism.
WHAT THIS STUDY ADDS
The standard 400 mg moxifloxacin dose is adequate to achieve optimal bacterial eradication in infections with a MIC value up to 0.5 mg l−1.
However, optimal suppression of bacterial resistance formation is not achieved with a standard 400 mg moxifloxacin dose.
Individualization of antimicrobial therapy, using a lean body mass (LBM) based dosing regimen, would aid in achieving the PK–PD target for optimal suppression of bacterial resistance formation.
Introduction
Recently, it was suggested that drug pharmacokinetics (PK) in post-bariatric surgery patients might differ significantly from PK in healthy volunteers due to, among other things, altered drug absorption [1–3]. In a previous study on the effect of roux-en-y gastric bypass surgery on moxifloxacin oral bioavailability, our group reported that non-compartmental analysis revealed no significant differences in absolute bioavailability compared with the absolute bioavailability in healthy volunteers [4]. Although our previous analysis showed that, on average, no differences exist between moxifloxacin exposure in post-bariatric surgery patients and healthy volunteers, this analysis did not address PK variability within the post-bariatric surgery cohort and its potential implications on antimicrobial therapy.
One of the types of infections where moxifloxacin therapy is deemed necessary is lower respiratory tract infections (LRTI), e.g. community acquired pneumonia (CAP). LRTIs are the most common infectious cause of death in the world and the third most common cause of death globally [5]. The pathogens most frequently occurring in CAP [6,7] are Streptococcus pneumoniae and to a lesser extent Staphylococcus aureus, both Gram-positive bacteria.
During antimicrobial chemotherapy there is no straightforward way to monitor the pharmacological effect of the treatment. Therefore, based on data from large clinical trials and/or in vitro (kinetic) studies, a priori specific treatment targets are defined in terms of PK–pharmacodynamic (PD) (PK–PD) indices.
For fluorquinolone antibiotics it is generally accepted that bacterial eradication and clinical cure are positively correlated with the AUIC (equation 1).
| (1) |
In the absence of data from large clinical trials on moxifloxacin PK–PD targets for treating LRTIs, in vitro (kinetic) models [8–11] are used to define AUIC targets. For Streptococcus pneumoniae infections, Odenholt & Cars [9] advise on the use of an AUIC target of 100 h to guide moxifloxacin dosing. This recommendation is in line with earlier findings by Zhanel et al. [12] and Klepser et al. [13]. They recommended targeting a free AUIC between 35 h–63 h [12] and total AUIC between 50 h–100 h [13].
Besides targets for optimal bacterial eradication, the in vitro kinetic models provide targets for optimal suppression of bacterial resistance formation. In line with the mutant selection window hypothesis (MSW) of Zinner et al. [14] AUIC targets for suppression of bacterial resistance formation are usually higher than those for optimal bacterial eradication.
In this study we will (i) use a population approach to describe PK variability in our post-bariatric surgery cohort and (ii) use this model in a PK–PD simulation study to assess the target attainment rate in this vulnerable patient population against a hypothetical Streptococcus pneumoniae infection.
Methods
Model building was based on data from a randomized crossover (oral and intravenous administration) trial of moxifloxacin administration to a cohort of post-bariatric surgery patients [4] published previously. In short, 12 volunteers, who had undergone roux-en-y gastric bypass at least 6 months prior to inclusion in the study, were administered moxifloxacin. Each volunteer received two single doses of 400 mg moxifloxacin, once as a tablet and once as a 1 h intravenous infusion, separated by a 1 week washout period. The study protocol was approved by the local institutional review board of Ghent University Hospital [4].
For all patients venous blood samples were taken prior to administration and at serial time points up to 72 h post-dose. Blood samples were collected in heparinized tubes. After centrifugation, plasma was collected and stored at −80°C until analysis. Samples were analyzed by a validated HPLC-fluorescence assay published earlier [15]. Assay characteristics were evaluated and complied with the FDA's guidance on bio-analytical method validation [16].
PK analysis
Model building
The moxifloxacin concentration vs. time data, for the oral as well as the intravenous moxifloxacin administration, were analyzed simultaneously using the FOCE-I estimation algorithm in nonmem® (Version 7.2; GloboMax LLC, Hanover, MD, USA). PLT-Tools (Version 4.6; PLTsoft, San Francisco, CA, USA) was used as a graphical user interface to nonmem®. Furthermore, R® (R foundation for statistical computing, Vienna, Austria) was used to assess graphically the model's goodness of fit and to evaluate the model's predictive capabilities.
As a starting point for the development of the structural model we used a two compartmental model with a linear absorption into and a linear elimination from the central compartment, as published earlier by Grosjean & Urien [17] and Simon et al. [18]. Subsequently several other higher order structural models were fitted to our data and their goodness of fit assessed (e.g. LAG-time and TRANSIT [19] absorption models). Throughout the course of this iterative procedure of fitting and evaluating different models, the Akaike information criterion (AICc) was used to compare the goodness of fit of different models. In addition, graphical evaluation was used to show the goodness of fit according to the EMA Guideline on Reporting the Results of Population Pharmacokinetic Analyses [20]. Furthermore, the condition number was calculated on the covariance matrix of parameter estimates to detect possible ill-conditioning.
Covariate screening was empirically approached by direct incorporation of different covariates in the PK model and comparison of the goodness of fit using the AICc and graphical techniques. Shrinkage (calculated by PLT-Tools) was considered prior to incorporating patient covariates in our final structural model. When shrinkage (calculated on the post hoc parameter estimates) was high, inclusion of patient covariates on that particular model parameter was deemed unfeasible. Finally, model parsimony was assessed by selectively removing different parameters from the model and evaluating the goodness of fit of the reduced model.
Internal model validation
R® (R foundation for statistical computing, Vienna, Austria) and PLT-Tools (Version 4.6; PLTsoft, San Francisco, CA, USA) were used for model validation. The final PK model was validated using different methods: (i) visual predictive check (VPC) method [21] and (ii) the normalized prediction distribution error (NPDE) method [22]. Both methods address validation through the use of simulated data. Using the final PK population model, with all parameters fixed at final parameter estimates, 100 concentrations were simulated for all observed time points. These simulations were performed using the $SIM statement in nonmem®. Afterwards, for method (i), these simulated concentration–time profiles were analyzed by non-compartmental PK using the PK package (version 1.2–5) for R®. The distribution of the calculated AUCs for the simulated concentration–time profiles were then compared with the observed AUCs from our dataset (similarly calculated using the PK package in R®). The validity of the model was assessed by graphically comparing the degree of similarity in the distribution of both sets of calculated AUCs. For specific details regarding method (ii), we refer to the work of Comets et al. [22]
PK–PD simulations
Using the calculated AUC24hs of the simulated concentration–time profiles for the oral data, the AUIC was assessed for typical wild-type Streptococcus pneumoniae MIC values [23]. Subsequently, these AUICs were plotted against typical AUIC thresholds to visualize the probability of target attainment (PTA) against Streptococcus pneumoniae MIC values for the 400 mg dosage regimen.
Based on the findings by Odenholt & Cars [9] we decided to use an AUIC target for bacterial eradication of 100 h in our simulation study. Furthermore, based on the results of the in vitro dynamic model published by Zinner et al. [14], on the emergence of resistant Streptococcus pneumoniae, we used, as a target for optimal suppression of bacterial resistance formation, a free AUIC target of 100 h. When accounting for plasma protein binding (approximately 50% for moxifloxacin [24]), this latter free AUIC target is equivalent to an AUIC target of 200 h (to avoid confusion with the target for bacterial eradication defined as AUIC rather than free AUIC, in our simulation study we will define both targets as (total) AUIC targets).
Finally, the effect of possible covariates identified in the final PK model, on PK–PD target attainment, was evaluated using graphical techniques.
Results
Patients and data
The PK analysis was based on 432 observed total plasma concentrations from 12 healthy volunteers who recently underwent bariatric surgery, obtained from a study performed by De Smet et al. [4] The following patient covariates were available: age, total body weight (TBM), lean body mass (LBM) calculated according to the James equation [25], gender, height, serum albumin, creatinine clearance estimated using the Cockroft & Gault equation (CLcr) and estimated according to the Modification of Diet in Renal Disease equation (MDRD). A summary of the demographic information is given in Table 1. The observed concentration–time profiles for all patients are shown in Figure 1.
Table 1.
Summary of patient demographics
| Characteristic | Median [range] |
|---|---|
| Age (years) | 41 [25–57] |
| TBM (kg) | 78.1 [57.4–104.0] |
| LBM (kg) | 51.7 [41.9–77.6] |
| Height (m) | 1.68 [1.58–1.99] |
| Gender (males : females) | 4 : 8 |
| Serum albumin (g dl−1) | 3.96 [3.54–4.40] |
| CLcr (Cockroft & Gault) (ml min−1) | 131.9 [100.4–221.5] |
| CLcr (MDRD) (ml min−1) | 101.5 [91.9–134.9] |
Figure 1.
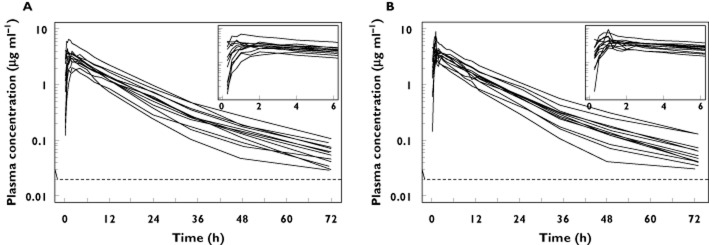
Observed moxifloxacin plasma concentration–time profiles after oral dosing (A) and after a 1 h i.v. infusion (B) The LLOQ of the assay is depicted by the dashed line
PK model building
According to Grosjean & Urien [17] and Simon et al. [18], a two compartmental model was found to be superior to a one compartmental model in describing moxifloxacin PK for a standard 400 mg dose. In their final model Grosjean & Urien [17] incorporated an allometric scaling approach to predict volume and CL terms as a function of LBM. On the other hand, Simon et al. [18] incorporated no parameter-covariate relationship in their population model. Given the thorough study conducted by Grosjean & Urien [17] on the body size effects on moxifloxacin PK and the number of subjects included in their population analysis relative to Simon et al. [18] (number of subjects included in the population analyses respectively 99 and 16) we decided to, as a starting point, fit the Grosjean & Urien [17] model with CL and volume terms allometrically scaled to LBM. However, given the relatively small number of subjects in our data set, we initially simplified the Grosjean & Urien [17] model by excluding the TRANSIT absorption model and treating all model parameters as fixed effects.
Subsequently, we investigated which of the model parameters were suitable to be included in the model as random effects, using the condition number as a measure of ill-conditioning. A two compartmental model treating only the absorption constant (ka), the central volume of distribution (Vc) and CL from the central compartment (CL) as random effects, whilst estimating the random effects variance-covariance matrix using a diagonal matrix, provided us with an initial model with an acceptable condition number (approximately 103). The hierarchical model building procedure is depicted in Figure 2.
Figure 2.
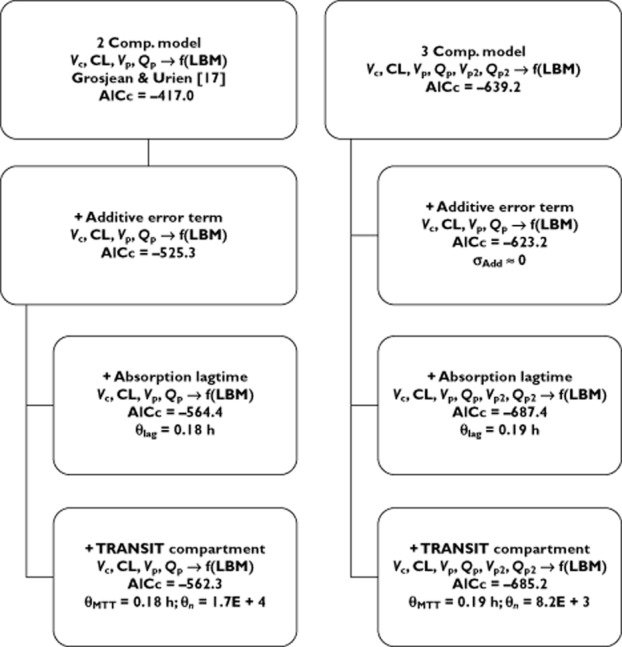
Overview of the structural model building: Vc: volume of distribution for the central compartment; CL: vlearance from central compartment; Vp and Vp2: volume of distribution for the first and second peripheral compartment; Qp and Qp2: inter-compartmental clearance from the central compartment to the first and second peripheral compartment; θlag: absorption lag time; θMTT: mean transit time; θn: number of transit compartments; σAdd: residual error variance explained by the additive error term
In their analysis, Grosjean & Urien [17] observed that including a LAG-time or TRANSIT compartment model significantly reduced the model's objective function value. Therefore, after addition of an additive error term parameter to our model (which proved to be a requisite to fit an absorption model), we fitted both absorption models. Similar to Grosjean & Urien [17], we also observed a better fit for both models. However, when our structural model was fitted with an additional peripheral compartment we observed an even higher decrease in AICc (as seen from Figure 2). Therefore, as a starting point to append more complex absorption submodels we chose the three compartmental model rather than the two compartmental model as proposed by Grosjean & Urien [17].
Subsequently, the TRANSIT compartment and LAG-time absorption model were appended to our three compartmental model. Both significantly reduced the model's AICc. However, the condition number (approximately 1011 for the LAG-time model) indicated serious ill-conditioning in both cases. Although some of the estimated parameters for both models would suffer from poor precision, as indicated by the condition number, the estimated values (as noted in Figure 2) for the absorption model parameters point out that in our dataset little evidence is present to assume a delayed absorption of moxifloxacin (estimated LAG-time ≈ 0.19 h, estimated mean transit time (MTT) ≈ 0.19 h). Based on the potential problem of poor precision of the estimated parameters and the lack of clinical significance of an estimated absorption delay of 0.20 h, neither the TRANSIT compartment nor the LAG-time absorption model was found feasible for inclusion in our structural model.
Finally, we (i) evaluated the feasibility of including covariates other than LBM in our model and (ii) studied whether we could simplify our model by removing, among other things, the allometric scaling component. After plotting of the post hoc random effects estimates vs. the patient covariates and calculation of the shrinkage, we decided to evaluate only CLcr and MDRD for incorporation into our model. Hereto, CL was modelled as a linear function of CLcr or MDRD in two separate models. The first model, using CLcr as a predictor for CL resulted in a slightly lower AICc (ΔAICc = −2.3), but goodness-of-fit plots (data not shown) revealed no observable difference in the fits of both models. Incorporation of MDRD into the model, as predictor for CL did not result in a decrease in AICc, and was therefore not incorporated in our final model.
By removing or substituting some of the model parameters we studied whether our final model could be simplified further. We started out by fitting a model using an allometric scaling of TBM rather than LBM as a way to predict CL and volume terms. The resulting increase in AICc (ΔAICc = 27.3) stressed the better model fit using an allometric scaling of LBM rather than TBM as a predictor of CL and volume terms. Furthermore, leaving out the LBM covariate or the allometric exponent of 0.75 on the model's CL terms did not result in an improved goodness-of-fit (ΔAICc = +56.9 and −0.50 respectively).
Final PK model and internal model validation
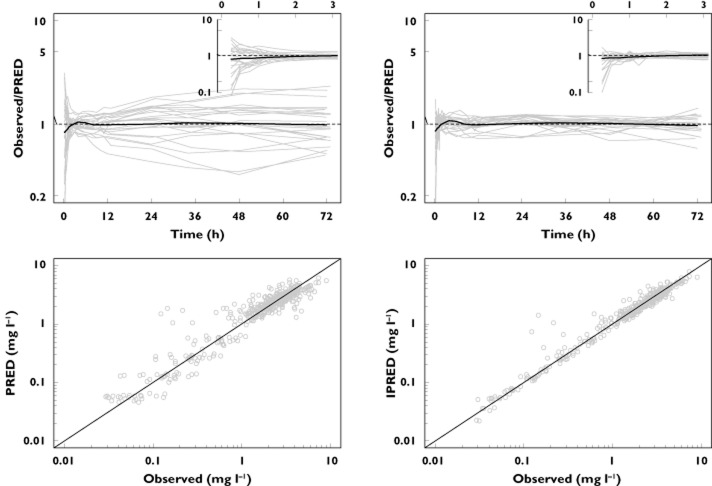
The final parameter estimates and the estimated standard errors (SE) for our three compartmental model are shown in Table 2. Figures 3 and 4 illustrate the model's goodness-of-fit. In Figure 3 the observed plasma concentrations are contrasted with the plasma concentrations predicted by the final model, whilst in Figure 4 the observed plasma concentrations are plotted along with the median, 5% and 95% percentile of the simulated plasma concentrations for every observed time point. As seen from Figure 4, the model gives a good prediction of the mean response at every time point. Furthermore, it adequately describes the variation around this mean response (this is seen by comparing the observed variation in plasma concentrations at every time point vs. the percentiles of the simulated distributions at these time-points). Alternatively, Figure 5 presents the results of the VPC method as described earlier. Again, it is noted that our model provides a good estimation of the mean observed AUC, as well as the observed variation around this mean AUC. The goodness-of-fit of our model was further confirmed by inspection of the distribution of the NPDEs (data not shown). Upon comparison against the standard normal distribution, no deviations were observed, hence demonstrating the goodness-of-fit of our model.
Table 2.
Population parameter estimates of the final pharmacokinetic model and the associated 95% bootstrap confidence intervals calculated on 100 bootstrap samples. All model parameters except ka were centred for a typical subject with a LBM of 60 kg
| Parameter | Final pharmacokinetic model |
|---|---|
| Fixed effects | |
| ka (h−1) | 0.95 [0.72, 1.21] |
 |
47.7 [31.6, 78.6] |
 |
8.60 [7.80, 9.70] |
 |
61.5 [37.6–75.7] |
 |
105.3 [55.2–140.0] |
 |
48.4 [34.4–92.9] |
 |
1.35 [1.23–1.56] |
| Inter-individual variability | |
| ω2 (ka) | 0.24 |
| ω2 (V1) | 0.14 |
| ω2 (CL) | 0.04 |
| Residual error | |
| σ2 (Proportional) | 0.03 |
CL, clearance from central compartment; ka, absorption constant; Q2 and Q3, inter-compartmental clearance from the central compartment to the first and second peripheral compartment; V1, volume of distribution for the central compartment; V2 and V3, volume of distribution for the first and second peripheral compartment; σ, variance term describing residual unexplained error; ω2, variance terms describing inter-individual variation in a particular model parameter.
Figure 3.
Goodness of fit plots for our final PK model, insets show the first 3 h post-dosing. The black line represents a LOESS smoother
Figure 4.
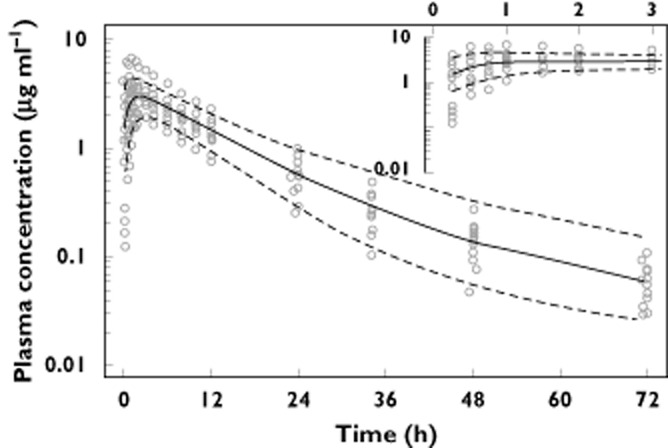
Observed moxifloxacin plasma concentrations after a standard 400 mg oral dose (open circles). The model simulated median moxifloxacin plasma concentration (solid line) along with the 5% and 95% percentile (dashed lines) from the simulations are shown to assess the model's goodness of fit
Figure 5.
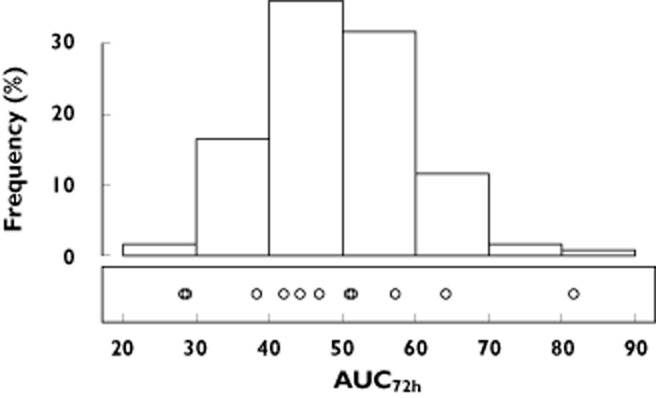
Visual predictive check comparing the distribution of the 100 model simulated AUC72h values (histogram on top) against the observed AUC72h values (open circles) after a standard 400 mg oral dose of moxifloxacin
PK–PD simulations
The distribution of simulated AUICs for the standard 400 mg daily dose of moxifloxacin against typical Streptococcus pneumoniae MIC values is depicted in Figure 6. To evaluate the expected efficacy of this treatment at every MIC value, we simultaneously plotted the AUIC targets for bacterial eradication (AUIC > 100 h) and suppression of bacterial resistance formation (AUIC > 200 h).
Figure 6.
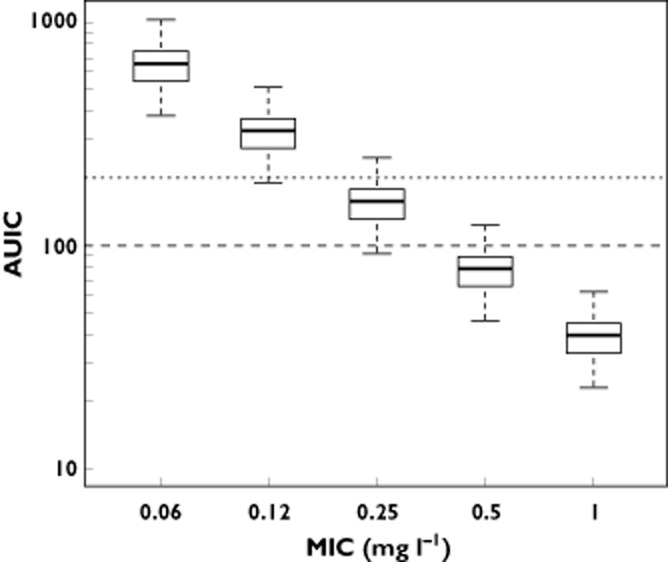
AUIC values calculated as the ratio of the model simulated moxifloxacin AUC24h values after a standard 400 mg oral dose vs. the theoretical Streptococcus pneumoniae MIC values. Simultaneously the AUIC cut-off values for bacterial eradication as well as suppression of bacterial resistance formation, as proposed in the literature, are shown. (long dashes: AUIC = 100; short dashed lines: AUIC = 200)
For MIC values up until 0.5 mg l−1, the distribution of simulated AUICs remained well above the indicated targets for bacterial eradication. However, for MIC values in excess of 0.5 mg l−1, the median of the predicted AUICs was smaller than the proposed target of AUIC > 100 h, leading to a PTA (bacterial eradication) below 50%. Furthermore, when comparing the simulated AUICs vs. the proposed target [14] for the control of antimicrobial resistance formation, it was clear that even at MIC values as low as 0.25 mg l−1 the proposed target was attained for only a very small fraction of the simulated population (<25%, given that the 75% percentile of the simulated distribution was below the AUIC threshold).
To elucidate the effect of LBM on moxifloxacin PK–PD target attainment rate, we simulated two patient subpopulations. On one hand we simulated 100 plasma concentration–time profiles for a patient population with a LBM of 42 kg (for a person of average height, this would correspond to a TBM of around 60 kg, this is the lowest observed LBM in our cohort). On the other hand, simulations were performed for a population with a LBM of 78 kg (corresponding to a TBM of approximately 100 kg, highest observed LBM in our cohort). Figure 7 provides the information on the simulated AUICs as a function of Streptococcus pneumoniae MIC values. From this graph it is apparent that, for patients with a higher LBM, the PTA at every MIC value was lower as compared with patients with a lower LBM (on average, the AUC24h in the high LBM group was 40.5% lower than the AUC24h in the low LBM group).
Figure 7.
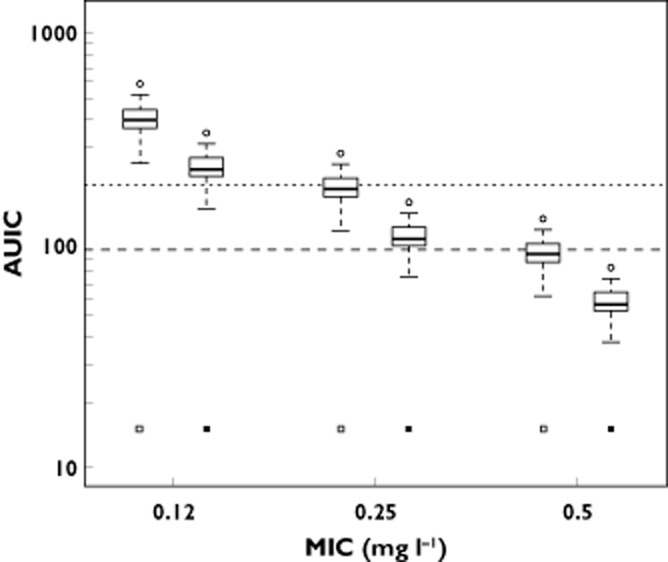
AUIC values calculated as the ratio of the model simulated moxifloxacin AUC24h values for subjects with a LBM of 42 kg (open squares) and 78 kg (solid squares) after a standard 400 mg oral dose vs. the theoretical Streptococcus pneumoniae MIC values. Simultaneously the AUIC cut-off values for bacterial eradication as well as suppression of bacterial resistance formation, as proposed in the literature, are shown. (long dashes: AUIC = 100; short dashed lines: AUIC = 200) Overall, AUIC values for the high LBM group are 40.5% lower than those for the low LBM group
Furthermore, all simulated AUICs from the high LBM group dropped below the recommended AUIC target of 100 h when targeting a microorganism with an MIC of 0.5 mg l−1, and hence the PTA for bacterial eradication for those patients approached zero. Furthermore, when evaluating the PTA for suppression of bacterial resistance formation, for patients with a higher LBM, this PTA approached zero at MIC values as low as 0.25 mg l−1.
Discussion
Many authors have reported in the literature that moxifloxacin PK were best described using a one compartmental [26] or a two compartmental [17,18] model, with [17,26] or without [18] additional parameters to account for the observed absorption delay. In contrast to these observations, we found that a three compartmental model produced a superior fit as compared with a two compartmental model. This discrepancy was explained by the difference in sampling times between our study (up until 72 h post-dose) and the studies reported in literature earlier (restricted to 24 h post-dose). Given the relatively short sampling schemes of the foregoing studies, it would have been nearly impossible for these authors to identify reliably this third compartment. Although this third compartment might not have a significant impact on the single dose simulations performed in our study, it is expected to have an impact whenever trying to simulate moxifloxacin exposure after repeated doses. Moreover, not taking into account this third compartment when simulating moxifloxacin PK will result in an underestimation of a subjects true (unobservable) AUC.
As opposed to Florian et al. [26] and Grosjean & Urien [17] our study, as well as the study reported by Simon et al. [18], found no evidence in favour of a clinically significant delayed absorption and therefore no LAG-time nor TRANSIT-model was fitted. These differences are likely explained by the fact that Florian et al. [26] and Grosjean & Urien [17] used data originating from double-blind trials in which moxifloxacin tablets were overencapsulated, thereby most likely prolonging the absorption phase.
Based on our data, it seems that allometric scaling of LBM by an exponent of 0.75 was superior, compared with a simple linear regression model, for the prediction of moxifloxacin CL terms. Furthermore, in concordance with the findings of Grosjean & Urien [17] we found that LBM rather than TBM should be used in the prediction of moxifloxacin PK. However, since it is well known [27] that the James equation [25] tends to an overestimation of the subjects' percentage body fat, thereby underestimating the true LBM, care has to be taken when using this model to estimate PK parameters in the morbidly obese (BMI > 30 kg m−2).
Although the appropriate PK–PD targets to pursue when trying to optimize moxifloxacin treatment are still under debate, our PK–PD simulations showed that, when taking into account currently propagated AUIC thresholds, in this population the PTA for bacterial eradication against a Streptococcus pneumoniae organism with a MIC value of 0.5 mg l−1 was already below 50%. When we looked at the PTA for the simulated population with LBM of 78 kg, this probability approached zero at the MIC value of 0.5 mg l−1. Furthermore, when evaluating the PTA of suppression of bacterial resistance formation it was apparent that at standard 400 mg doses of moxifloxacin, even at MIC values of 0.25 mg l−1 this PTA was unacceptably low.
Given the relatively low prevalence of MIC values of 0.50 mg l−1 for the wild type Streptococcus pneumoniae species [23], at first glance, our results do not seem to have an important impact on the average PTA for bacterial eradication of moxifloxacin therapy in this population. However, as indicated in Figure 7, for subjects with a LBM of 78 kg, approximately 25% will attain AUIC values below the recommended target of 100 h. (as seen by the near-overlap of the 25% percentile of the simulated distribution and the dashed line for the AUIC target of 100 h). Moreover, although not included in our simulated population, from our model it is apparent that post-bariatric surgery patients with a LBM higher than 78 kg are likely to fail in achieving an AUIC of 100 h.
When considering an AUIC target of 200 h, as proposed in the literature [14] to suppress optimally bacterial resistance formation, we saw that the overall PTA was low (well below 50%) even at MIC values of 0.25 mg l−1 for the entire simulated population. Furthermore, when considering the effect of LBM on this particular PTA, we observed that for subjects with a higher LBM (78 kg) the PTA for suppression of bacterial resistance formation approached zero at this MIC value.
This study has a number of limitations. At first, changes induced in the PK of moxifloxacin by the infection are not captured. Furthermore, given that the subjects in our study were included after having stabilized from their bariatric surgery, i.e. they were in a generally good condition, the observed PK variability might underestimate the variability seen in infected patient populations. The consequence of this limitation is that both PK and the PTA are likely to be even more variable in a patient population treated with moxifloxacin.
In conclusion, this analysis demonstrates that for antimicrobial dosing the ‘one dose fits all’ paradigm is not correct. Throughout this simulation study, it was clear that optimization of moxifloxacin dosing should take into account the effect of LBM on PK and, ultimately, the PK–PD endpoints. Our study results show that in order to optimize moxifloxacin chemotherapy, both in terms of bacterial eradication and optimal suppression of resistance development during therapy, individualized dosing strategies should be developed.
Acknowledgments
We thank the Drug Research Unit Ghent of Ghent University Hospital for clinical study support.
Competing Interests
All authors have completed the Unified Competing Interest form at http://www.icmje.org/coi_disclosure.pdf (available on request from the corresponding author) and declare no support from any organization for the submitted work, no financial relationships with any organizations that might have an interest in the submitted work in the previous 3 years and no other relationships or activities that could appear to have influenced the submitted work.
References
- 1.Brocks DR, Ben-Eltriki M, Gabr RQ, Padwal RS. The effects of gastric bypass surgery on drug absorption and pharmacokinetics. Expert Opin Drug Metab Toxicol. 2012;8:1505–1519. doi: 10.1517/17425255.2012.722757. [DOI] [PubMed] [Google Scholar]
- 2.Padwal RS, Ben-Eltriki M, Wang XM, Langkaas LA, Sharma AM, Birch DW, Karmali S, Brocks DR. Effect of gastric bypass surgery on azithromycin oral bioavailability. J Antimicrob Chemother. 2012;67:2203–2206. doi: 10.1093/jac/dks177. [DOI] [PubMed] [Google Scholar]
- 3.Darwich AS, Henderson K, Burgin A, Ward N, Whittam J, Ammori BJ, Ashcroft DM, Rostami-Hodjegan A. Trends in oral drug bioavailability following bariatric surgery: examining the variable extent of impact on exposure of different drug classes. Br J Clin Pharmacol. 2012;74:774–787. doi: 10.1111/j.1365-2125.2012.04284.x. [DOI] [PMC free article] [PubMed] [Google Scholar]
- 4.De Smet J, Colin P, De Paepe P, Ruige J, Batens H, Van Nieuwenhove Y, Vogelaers D, Blot S, Van Bocxlaer J, Van Bortel LM, Boussery K. Oral bioavailability of moxifloxacin after Roux-en-Y gastric bypass surgery. J Antimicrob Chemother. 2012;67:226–229. doi: 10.1093/jac/dkr436. [DOI] [PubMed] [Google Scholar]
- 5.Wiemken TL, Peyrani P, Ramirez JA. Global changes in the epidemiology of community-acquired pneumonia. Semin Respir Crit Care Med. 2012;33:213–219. doi: 10.1055/s-0032-1315633. [DOI] [PubMed] [Google Scholar]
- 6.Stass H, Dalhoff A. The integrated use of pharmacokinetic and pharmacodynamic models for the definition of breakpoints. Infection. 2005;33:29–35. doi: 10.1007/s15010-005-8205-z. [DOI] [PubMed] [Google Scholar]
- 7.Ferrara AM. New fluoroquinolones in lower respiratory tract infections and emerging patterns of pneumococcal resistance. Infection. 2005;33:106–114. doi: 10.1007/s15010-005-4102-8. [DOI] [PubMed] [Google Scholar]
- 8.Bhagunde P, Singh R, Ledesma KR, Chang KT, Nikolaou M, Tam VH. Modelling biphasic killing of fluoroquinolones: guiding optimal dosing regimen design. J Antimicrob Chemother. 2011;66:1079–1086. doi: 10.1093/jac/dkr054. [DOI] [PubMed] [Google Scholar]
- 9.Odenholt I, Cars O. Pharmacodynamics of moxifloxacin and levofloxacin against Streptococcus pneumoniaeStaphylococcus aureusKlebsiella pneumoniae and Escherichia coli: simulation of human plasma concentrations after intravenous dosage in an in vitro kinetic model. J Antimicrob Chemother. 2006;58:960–965. doi: 10.1093/jac/dkl356. [DOI] [PubMed] [Google Scholar]
- 10.Firsov AA, Zinner SH, Vostrov SN, Portnoy YA, Lubenko IY. AUC/MIC relationships to different endpoints of the antimicrobial effect: multiple-dose in vitro simulations with moxifloxacin and levofloxacin. J Antimicrob Chemother. 2002;50:533–539. doi: 10.1093/jac/dkf177. [DOI] [PubMed] [Google Scholar]
- 11.Firsov AA, Lubenko IY, Vostrov SN, Portnoy YA, Zinner SH. Antistaphylococcal effect related to the area under the curve/MIC ratio in an in vitro dynamic model: predicted breakpoints versus clinically achievable values for seven fluoroquinolones. Antimicrob Agents Chemother. 2005;49:2642–2647. doi: 10.1128/AAC.49.7.2642-2647.2005. [DOI] [PMC free article] [PubMed] [Google Scholar]
- 12.Zhanel GG, Walters M, Laing N, Hoban DJ. In vitro pharmacodynamic modelling simulating free serum concentrations of fluoroquinolones against multidrug-resistant Streptococcus pneumoniae. J Antimicrob Chemother. 2001;47:435–440. doi: 10.1093/jac/47.4.435. [DOI] [PubMed] [Google Scholar]
- 13.Klepser ME, Ernst EJ, Petzold CR, Rhomberg P, Doern GV. Comparative bactericidal activities of ciprofloxacin, clinafloxacin, grepafloxacin, levofloxacin, moxifloxacin, and trovafloxacin against Streptococcus pneumoniae in a dynamic in vitro model. Antimicrob Agents Chemother. 2001;45:673–678. doi: 10.1128/AAC.45.3.673-678.2001. [DOI] [PMC free article] [PubMed] [Google Scholar]
- 14.Zinner SH, Lubenko IY, Gilbert D, Simmons K, Zhao XL, Drlica K, Firsov AA. Emergence of resistant Streptococcus pneumoniae in an in vitro dynamic model that simulates moxifloxacin concentrations inside and outside the mutant selection window: related changes in susceptibility, resistance frequency and bacterial killing. J Antimicrob Chemother. 2003;52:616–622. doi: 10.1093/jac/dkg401. [DOI] [PubMed] [Google Scholar]
- 15.De Smet J, Boussery K, Colpaert K, De SP, De PP, Decruyenaere J, Van BJ. Pharmacokinetics of fluoroquinolones in critical care patients: a bio-analytical HPLC method for the simultaneous quantification of ofloxacin, ciprofloxacin and moxifloxacin in human plasma. J Chromatogr B Analyt Technol Biomed Life Sci. 2009;877:961–967. doi: 10.1016/j.jchromb.2009.02.039. [DOI] [PubMed] [Google Scholar]
- 16.Guidance for industry-Bioanalytical method validation. 2002. FDA CDER.
- 17.Grosjean P, Urien S. Reevaluation of Moxifloxacin Pharmacokinetics and Their Direct Effect on the QT Interval. J Clin Pharmacol. 2012;52:329–338. doi: 10.1177/0091270011398361. [DOI] [PubMed] [Google Scholar]
- 18.Simon N, Sampol E, Albanese J, Martin C, Arvis P, Urien S, Lacarelle B, Bruguerolle B. Population pharmacokinetics of moxifloxacin in plasma and bronchial secretions in patients with bronchopneumonia. Clin Pharmacol Ther. 2003;74:353–363. doi: 10.1016/S0009-9236(03)00201-7. [DOI] [PubMed] [Google Scholar]
- 19.Savic RM, Jonker DM, Kerbusch T, Karlsson MO. Implementation of a transit compartment model for describing drug absorption in pharmacokinetic studies. J Pharmacokinet Pharmacodyn. 2007;34:711–726. doi: 10.1007/s10928-007-9066-0. [DOI] [PubMed] [Google Scholar]
- 20.EMA; CHMP. Guideline on reporting the results of population pharmacokinetic analyses. 2007. CHMP/EWP/185990/06. Available at http://www.ema.europa.eu/docs/en_GB/document_library/Scientific_guideline/2009/09/WC500003067.pdf (last accessed 10 September 2012)
- 21.Bonate PL. Pharmacokinetic-Pharmacodynamic Modeling and Simulation. 2nd edn. London: Springer; 2011. [Google Scholar]
- 22.Comets E, Brendel K, Mentre F. Computing normalised prediction distribution errors to evaluate nonlinear mixed-effect models: the npde add-on package for R. Comput Methods Programs Biomed. 2008;90:154–166. doi: 10.1016/j.cmpb.2007.12.002. [DOI] [PubMed] [Google Scholar]
- 23.European Commitee on Antimicrobial Susceptibility Testing (EUCAST) Available at http://mic.eucast.org. 20-11-2012. 20-11-0012 (last accessed 10 September 2012)
- 24.Stass H, Dalhoff A, Kubitza D, Schuhly U. Pharmacokinetics, safety, and tolerability of ascending single doses of moxifloxacin, a new 8-methoxy quinolone, administered to healthy subjects. Antimicrob Agents Chemother. 1998;42:2060–2065. doi: 10.1128/aac.42.8.2060. [DOI] [PMC free article] [PubMed] [Google Scholar]
- 25.Hallynck TH, Soep HH, Thomis JA, Boelaert J, Daneels R, Dettli L. Should clearance be normalized to body-surface or to lean body-mass. Br J Clin Pharmacol. 1981;11:523–526. doi: 10.1111/j.1365-2125.1981.tb01163.x. [DOI] [PMC free article] [PubMed] [Google Scholar]
- 26.Florian JA, Tornoe CW, Brundage R, Parekh A, Garnett CE. Population pharmacokinetic and concentration–QTc models for moxifloxacin: pooled analysis of 20 thorough QT studies. J Clin Pharmacol. 2011;51:1152–1162. doi: 10.1177/0091270010381498. [DOI] [PubMed] [Google Scholar]
- 27.Green B, Duffull S. Caution when lean body weight is used as a size descriptor for obese subjects. Clin Pharmacol Ther. 2002;72:743–744. doi: 10.1067/mcp.2002.129306. [DOI] [PubMed] [Google Scholar]


