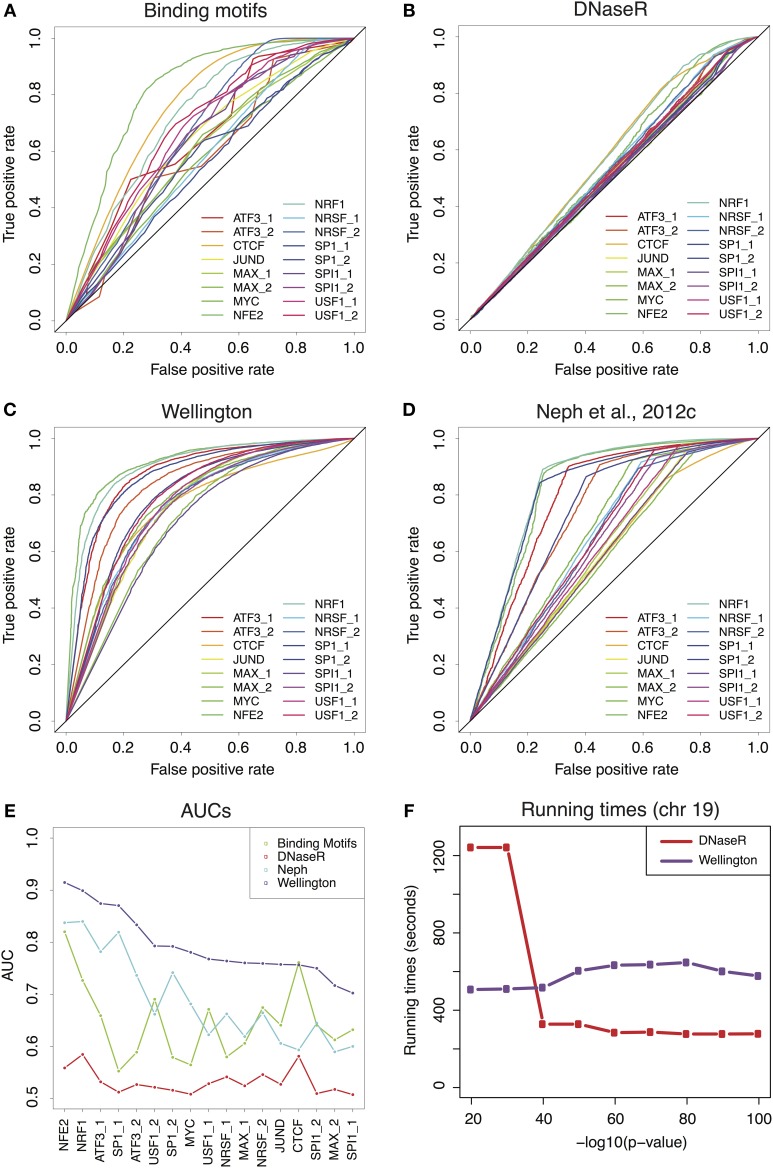
Figure 1 of the article Comparative evaluation of DNase-seq footprint identification strategies, by Barozzi et al. (2014) contained a minor mistake, which we correct here. In panel E, the y axis ranges from 0.5 to 1 and not from 0 to 1 as indicated in the original figure. We resubmit a corrected version of Figure 1.
Figure 1.
(A) Receiver-Operator Characteristic (ROC) curves for the predictions provided by the binding motifs alone. (B–D) ROCs for the sets of footprints obtained by DNaseR, Wellington and for the set used in Neph et al.(2012c). (E) Area Under the Curve (AUC) corresponding to the ROCs of (A–D) Wellington scores consistently better than all theother methods. (F) Running times for DNaseR and Wellington on chromosome19, for different significance thresholds.
Conflict of interest statement
The authors declare that the research was conducted in the absence of any commercial or financial relationships that could be construed as a potential conflict of interest.
References
- Barozzi I., Bora P., Morelli M. J. (2014). Comparative evaluation of DNase-seq footprint identification strategies. Front. Genet. 5:278 10.3389/fgene.2014.00278 [DOI] [PMC free article] [PubMed] [Google Scholar]


