

Abstract

The thermodynamics of ligand–receptor interactions at the surface of living cells represents a fundamental aspect of G protein-coupled receptor (GPCR) biology; thus, its detailed elucidation constitutes a challenge for modern pharmacology. Interestingly, fluorescent ligands have been developed for a variety of GPCRs in order to monitor ligand–receptor binding in living cells. Accordingly, new methodological strategies derived from noninvasive fluorescence-based approaches, especially fluorescence resonance energy transfer (FRET), have been successfully developed to characterize ligand–receptor interactions. Importantly, these technologies are supplanting more hazardous and expensive radioactive binding assays. In addition, FRET-based tools have also become extremely powerful approaches for visualizing receptor–receptor interactions (i.e., GPCR oligomerization) in living cells. Thus, by means of the synthesis of compatible fluorescent ligands these novel techniques can be implemented to demonstrate the existence of GPCR oligomerization not only in heterologous systems but also in native tissues. Finally, there is no doubt that these methodologies would also be relevant in drug discovery in order to develop new high-throughput screening approaches or to identify new therapeutic targets. Overall, herein, we provide a thorough assessment of all technical and biological aspects, including strengths and weaknesses, of these fluorescence-based methodologies when applied to the study of GPCR biology at the plasma membrane of living cells.
G protein-coupled receptors (GPCRs) constitute the largest family of cell-surface receptors and mediate the physiological responses to a plethora of cellular signals including neurotransmitters, hormones, and exogenous sensory stimuli perceived by the senses (i.e., light, odor, and taste).1 Historically, the way in which GPCRs transduce extracellular signals into cellular changes has been thought to be a simple linear paradigm. First, the extracellular agonist binds to and prompts a conformational rearrangement of the receptor from an inactive to an active state, which catalyzes the activation of guanine nucleotide binding proteins (G proteins).2 Alternately, an agonist might select an active conformation of the receptor to which it has a higher affinity. Next, the activation of the heterotrimeric G protein (Gαβγ), which involves the exchange of GDP for GTP within the Gα subunit, promotes Gαβγ dissociation into its respective Gα and Gβγ subunits. Finally, both Gα and Gβγ subunits can promote either the activation or the inhibition of effector enzymes (e.g., phosphodiesterases, adenylyl cyclases, or phospholipases) and ion channels that in turn trigger many intracellular signaling pathways.3 Moreover, apart from the interaction with and activation of G proteins, GPCRs also bind a plethora of GPCR-interacting proteins (GIPs). GIPs, either intracellular or associated with cell membranes, contain specific GPCR-interacting domains that sustain, under some cellular conditions, the formation of functional multiprotein complexes necessary for both G protein-dependent and independent signaling. In addition, some GIPs may act only as scaffold proteins that anchor GPCRs to specific plasma membrane domains (e.g., lipid rafts, cell junctions, etc.) and thus contribute to the targeting and subcellular distribution of GPCRs. Overall, GIPs, by impinging on GPCR trafficking, localization and/or pharmacological properties, play a prominent role in GPCR biology, thus instituting a further sophisticated paradigm in which receptors are functionally fine-tuned.4
GPCRs were classically believed to function as single units (i.e., monomers), although this simplistic view has been shifted during the past decade, and now, it is well-accepted by the scientific community that GPCRs may form dimeric or higher-order oligomeric complexes under certain circumstances.5 Indeed, the identification of receptor oligomeric complexes at the surface of living cells and the discernment of how oligomerization can impinge on receptor function seem critical to wholly understand GPCR pharmacology. A forthcoming step to study direct receptor–receptor interactions has consisted of the development of fluorescence resonance energy transfer (FRET)-based approaches. Thus, upon labeling of the GPCR of interest with specific chromophores a RET process can be engaged if the chromophores are in close proximity (see Box 1). Of note, FRET-based tools can be devoted to study direct receptor–receptor interactions at the plasma membrane, and it is worth mentioning the use of fluorescent-labeled ligands. Fluorescent probes have opened a new and productive path to study GPCR oligomerization, since they can be used to detect receptor–receptor interactions in their native context. Importantly, the design of a fluorescent GPCR ligand must take into account structure activity relationships in order to maintain high affinity, and, optionally, to direct the fluorophore to a particular region of a receptor. The growing body of knowledge of the conformational details of GPCRs and their bound ligands is also helpful in this context.8 In this manner, in contrast to peptides and other large ligands, GPCR ligands are often small molecules, and their fluorescent derivatives, if properly functionalized, can maintain high affinities for their cognate receptors. Thus, as commented above, these kinds of tools would eventually allow performing experiments that mimicking naïve conditions.6 Finally, it is important to consider that the sensitivity of these FRET approaches, based on the study of ligand–receptor interactions by means of fluorescent ligands, may not be as high as with radioactive ligands. However, FRET-based fluorescent ligands have advantages over classical radioligands in other aspects, such as the delivery and disposal of the radioactive material, the relatively short shelf life or the long signal acquisition times required to reach an acceptable sensitivity. Moreover, radioligand binding assays are more expensive, hazardous, time-consuming, and difficult to automate and miniaturize.6,7
Box 1. Principle of Resonance Energy Transfer.
The biophysical principle of resonance energy transfer (RET) was primarily described by Theodor Förster late in the 40s and is based on the nonradiative (dipole–dipole) transfer of energy from a chromophore in an excited state, known as the “donor”, to an “acceptor” molecule.65,66 Thus, as a consequence of this energy transfer, a reduction in the donor chromophore emission occurs and a matched increase in the emission of the acceptor is produced. Interestingly, the efficiency of this transference of energy, indicated as ERET, is inversely proportional to the sixth power of the distance (r) between donor and acceptor molecules following the equation:
where R0 is the distance guiding the 50% of energy transfer from the donor to the acceptor. Therefore, the ERET is extremely sensitive to the donor–acceptor distance (e.g., increasing twice R0 reduces more than 30 times the ERET). In practice the effective threshold for energy transfer is approximately 10 nm. On the other hand, apart from the distance between chromophores the RET efficiency depends on other variables, for instance the orientation between the donor and the acceptor molecules (e.g., the dipole moments should not be perpendicular), the overlapping degree between donor and acceptor spectra, the quantum yield of the donor, and the extinction coefficient of the acceptor.66,67 Accordingly, when a pair of chromophores is selected to engage in a RET process, it is important to consider those chromophores with the optimal highest donor-quantum yield and absorbing acceptor, together with significant spectral overlap.68
Classical RET techniques, including fluorescence-RET (FRET) and bioluminescence-RET (BRET), use fluorescent (i.e., CFP) and bioluminescent (i.e., Rluc) donor chromophores, respectively. Interestingly, dynamic FRET measurements between two appropriated pair of FRET fluorophores (i.e., CFP and YFP) are often monitored as acceptor/donor emission intensity ratio (FYFP/FCFP) upon donor excitation following the equation:
where FYFPex433/em527 and FCFPex433/em475 represent the respective emission intensities of YFP (at 527 nm) and CFP (at 475 nm) upon excitation at 433 nm; a and b represent correction factors for the bleed-through of CFP into the 527 nm channel (a), and the cross-talk due to the direct YFP excitation by light at 433 nm (b). FYFPex500/em527 represents the emission intensity of YFP (recorded at 527 nm) upon direct excitation at 500 nm and is recorded at the beginning of each experiment. It is important to remark here that nonspecific FRET can be achieved if the density of donor and acceptor is high enough to promote random collision between both molecules, a situation easily encountered when transient heterologous overexpression of tagged partners is performed. In such situations, careful control experiments of RET dilution, saturation and competition assays should be performed in order to discriminate between real interaction and random collision due to overexpression.68 Indeed, this last issue has been arduously debated in the framework of GPCR oligomerization69 and remains somewhat controversial.70 Overall, if two RET-tagged partners do interact, either directly or as part of a multimeric complex, these partners can bring donor and acceptor molecules into close proximity (within 10 nm) and energy transfer might take place, thus increasing the ratio FYFP/FCFP.
Overall, in the present review, we focus on recent contributions of ligand–receptor FRET-based studies devoted to the understanding of GPCR biology in general and GPCR oligomerization in particular. The information gained using these tools will likely contribute in the future to a better management of those related pathologies in which receptor–receptor interactions (i.e., oligomerization) might play a key role.
GPCR Fluorescent Ligands
The development of GPCR pharmacophores tethered to fluorescent moieties that remain active constitutes an important step in the pharmacology associated with this family of receptors.8−10 Interestingly, the chemistry of such compounds has followed the trail of commercially available fluorophores.11,12 Thus, the synthesis of low molecular weight organic dyes with tunable fluorescence signaling that fit the instrumental readout requirements has propelled the chemistry of GPCR fluorescent ligands. Initially, a very limited number of dyes were coupled to target pharmacophores by reactive groups in easy to handle conjugation reactions.13−18 However, nowadays there is a predominant trend to develop linkers and dyes that can offer varied advantages, for instance higher chemical- and photostability or compatibility with donor and other acceptors to perform multiwavelength detection. Of note, a recent approach consists of the use of dyes that fluoresce at longer (i.e., infrared) wavelengths, thus widening the measurement spectra or allowing both multicolor experiments and fluorescence imaging in vivo.19 On the other hand, infrared fluorescent dyes have lower chemical and photochemical stability (for review see ref (20)), but one of the most important advantages of these infrared fluorescent labels is the reduced fluorescence background when used in biological experiments (i.e., cells and tissues). An attractive alternative for classical dyes are quantum dots (QDs),21 which have been used as fluorophores for both small molecular GPCR ligands and peptide ligands.8 QDs are fluorescent semiconductor nanostructures with the ability to emit light through the visible and near-infrared spectra. These nanocrystals are efficiently excited and have narrow emission bands. However, QDs present some drawbacks; for instance, their large physical size that can impede the diffusion across membranes and potential cell toxicity. Another important aspect of QDs is termed “blinking” behavior, in which dark periods of no emission interrupt longer periods of fluorescence.22 Overall, the synthesis of small fluorescent ligands of GPCRs is not a trivial process, especially if the site for fluorophore attachment is in close proximity to the pharmacophore and thus much more likely to affect ligand affinity and efficacy.
In the mid 1970s, fluorescent ligands were introduced in the pharmacology toolbox in order to study GPCRs in their native environment with a high spatial resolution.8 However, since their synthesis was laborious, and thus commercially unavailable, the regular use of fluorescent ligands was during many years restricted to only a few laboratories. Back in the 1990s, the use of fluorescent ligands reborn, and the objective consisted of synthesizing high-affinity compounds that would remain fluorescent when bound to their receptors and that also would dissociate slowly when the unbound molecule was removed by washing.8 For instance, following these criterion, several vasopressin V1a receptor agonists and antagonists were synthesized23 (Table 1) to visualize cell surface and endocytosed receptors in living cells.24 Alternatively, by synthesizing a fluorescent labeled neurokinin NK2 antagonist, it was possible to study the structure of ligand–receptor complexes and the environment of the ligand when bound to the receptor.25 Interestingly, antagonists often offer a higher affinity than agonists and thus, since lower concentrations can be used, they provide a better signal-to-noise ratio than agonists.26 Finally, during the past decade, fluorescent ligands have been developed for numerous GPCRs, providing novel tools to address fundamental questions regarding GPCR biology, for instance, the phenomenon of GPCR oligomerization on which we focus here. It is important to mention that although the design of GPCR fluorescent ligands is not an easy task, as different aspects have to be considered (i.e., pharmacological, photophysical, and also physicochemical properties),27 the current number of marketed GPCR fluorescent ligands is growing rapidly.
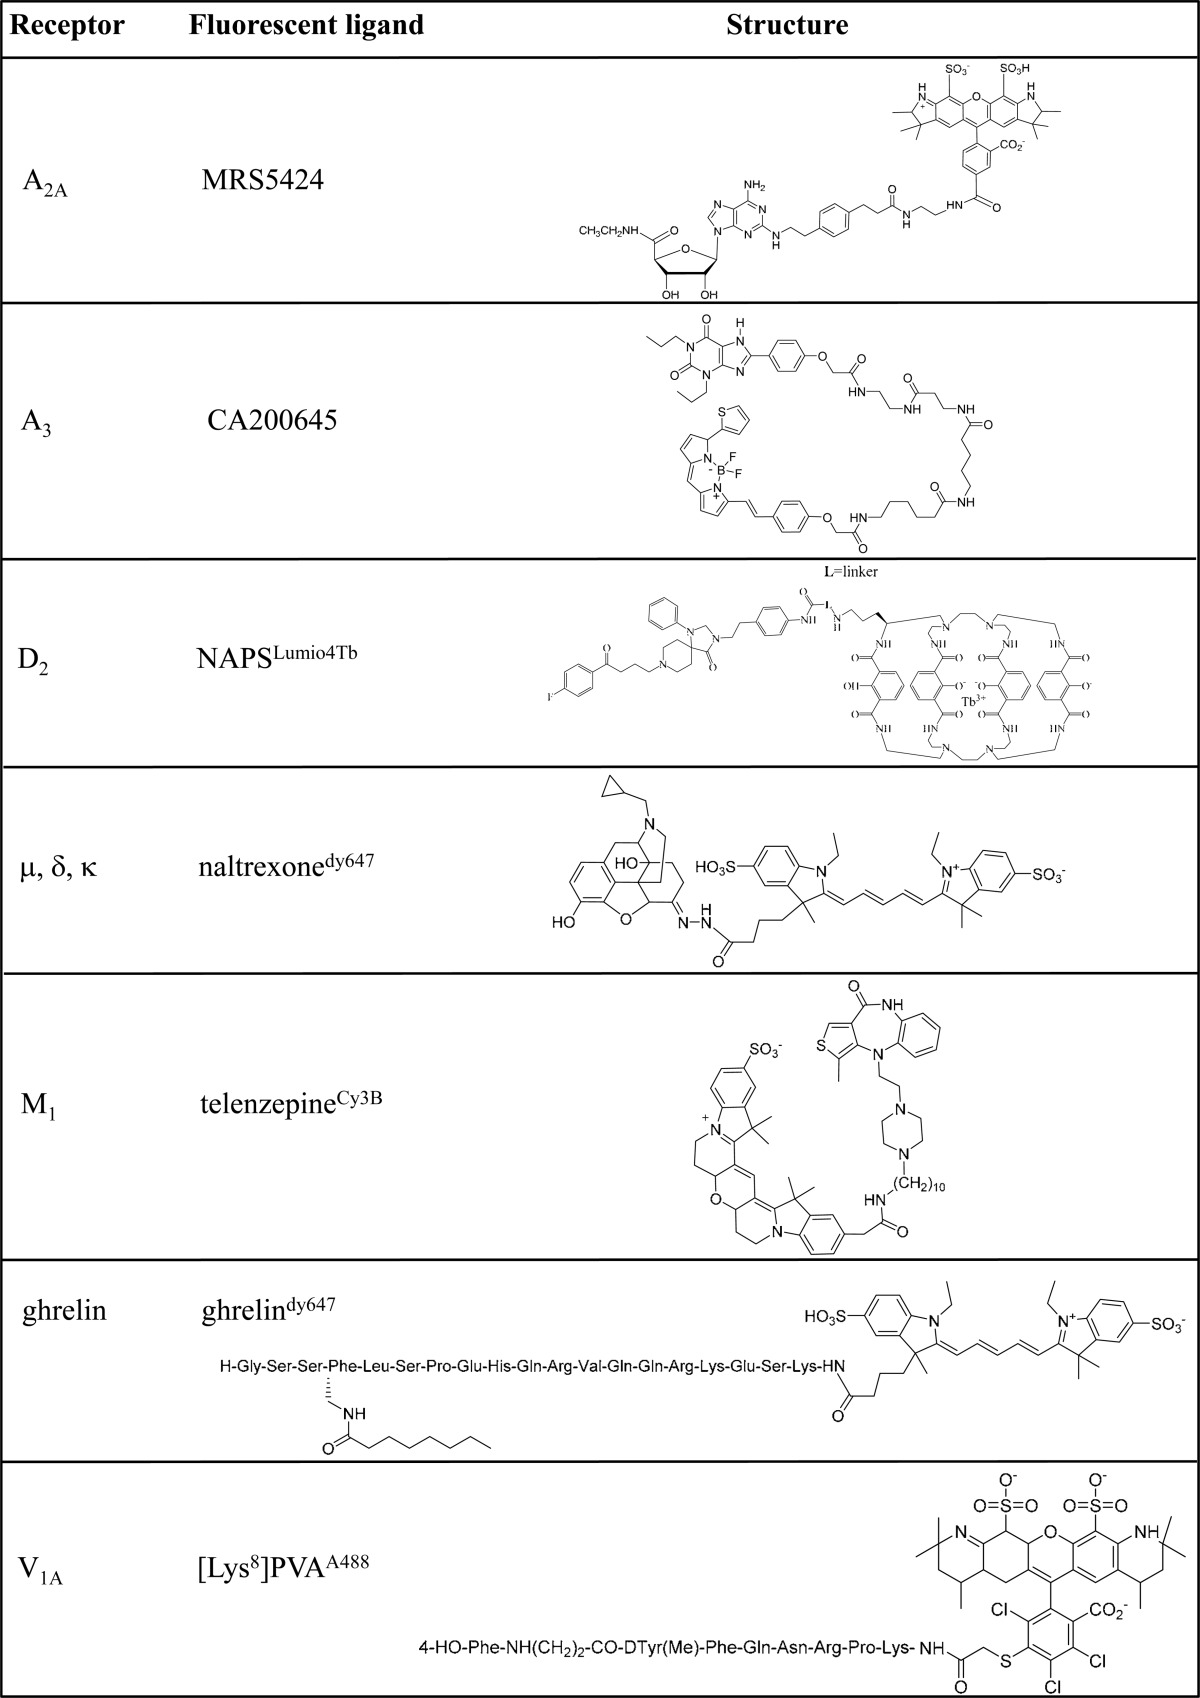
Table 1. Representative GPCRs Tagged with Fluorescent Ligands.
| receptor | G protein | transduction mechanismsb | physiological actions | fluorescent ligands |
|---|---|---|---|---|
| A2A | Gsa, Golf, G15,16§ | activates: ACa, PLC | platelet aggregation inhibition;71 vasodilation;72 neurotransmitter release;73 regulation of sensorimotor integration in basal ganglia;74 sleep promotion75 | MRS5424, MRS5206, SCH442416dy647 |
| inhibits: Ca2+ channels | ||||
| A3 | Gi/oa | inhibits: ACa | mast cell activation;76preconditioning;77 coronary vasodilation;78 regulation of intraocular pressure;79 hypotension80 | CA200645 |
| activates: PLC | ||||
| D2 | Gi/oa | inhibits: ACa | modulation of locomotor activity;81 control of renal blood flow;82 learning and memory modulation83 | NAPSdy647, NAPSLumio4Tb, spiperonedy647 |
| activates: GIRKs | ||||
| μ, δ, κ | Gi/oa, Gq/11, G12/13 | inhibits: AC | analgesia;84 respiratory depression;85 feeding;86 neurotransmitter release;87 body temperature regulation88 | naltrexonedy647 |
| activates: PLC, GIRKs, PLA2, PLD | ||||
| M1 | Gq/11a | activates: PLC | bronchoconstriction;89 vasodilation;90 memory function;91 hypothermia;92 stimulation of water consumption93 and urination94 | telenzepineCy3B, telenzepineA488 |
| ghrelin | Gq/11a, Gi/o, G12/13 | activates: PLC | feeding95 and release of GH96 | ghrelindy647 |
| V1A | Gq/11a | activates: PLC | vasoconstriction;97 hypertension;98 platelet aggregation99 | [Lys8]PVAA488, [Lys8]PVAEu⊂PBBP |
Main mechanism of coupling.
AC, adenylyl cyclase; PLC, phospholipase C; PLA2, phospholipase A2; PLD, phospholipase D; GIRKs, G protein-dependent inwardly rectifying K+ channels.
Fluorescence-Based Tools for the Study of Ligand–Receptor Binding at the Cell Surface of Living Cells
GPCR fluorescent ligands were first utilized in receptor binding assays by measuring the fluorescence intensity contained in the fraction of ligand bound to the receptors on the surface of intact cells. Importantly, a separation of the free ligand and bound ligand fractions is required, as it is done in classical radioligand binding assays; thus, these techniques share some advantages and disadvantages. Needless to say, the fluorescent ligands use led either to diminished sensitivity and increased noise (e.g., higher nonspecific binding of the fluorescent ligand and autofluorescence of the sample) when compared to the radioactivity-based binding assays, or to the impossibility of a precise determination of pharmacological parameters such as maximal binding (Bmax) (for review, see ref (28)). On the other hand, it is clear that the use of fluorescent tracers to visualize GPCRs has several advantages over conventional radioisotopically labeled ligands. For example, this approach not only avoids the liability associated with scintillation detection or use and disposal of radioisotopes, but also it enhances safety and reduces costs. In addition, fluorescent ligands can provide immediate “real-time” readout of the ligand–receptor interaction. Thus, the above-mentioned approach is suitable for kinetic binding experiments and visual confirmation of receptor localization, allowing not only localized saturation binding experiments but also internalization experiments. Finally, the capability for miniaturization makes fluorescence-based tools more economical technologies. However, as mentioned above, it is important to underline the need for washing or centrifugation steps to separate the bound and free ligand fractions, which adds complexity to these assays, thus making such procedures more difficult to adapt to high-throughput screening (HTS) assays. Noteworthy, an exception within this scenario, for example with regard to autofluorescence leading to a low signal-to-noise ratio or to the difficulty of performing assays in a HTS mode, is the dissociation-enhanced lanthanide fluoro-immunoassay (DELFIA) technology.29 Interestingly, in DELFIA-based binding assays, ligands are labeled with lanthanides, which among other characteristics have long fluorescence lifetimes. Accordingly, a delay can be applied between the excitation pulse and the measurement of the fluorescence emission, allowing to get rid of most of the background fluorescence. Also, lanthanide-based assays have been reported to be highly reproducible, easy to set up, and amenable to HTS.30 However, the separation method used in the former techniques to eliminate the excess of unbound fluorescent ligand may preclude conducting kinetics experiments.
Several approaches have been designed to allow the direct measurement of the fluorescent ligand bound to the receptor without the need of washing steps, in other words, in a homogeneous mode. One of the first approaches allowing homogeneous binding experiments was based on the optical separation of bound and free fluorescent molecules, the so-called laser-scanning imaging (LSI).31 This technique, which was readily designed for the clinical analysis of CD4+ lymphocytes in blood samples, uses a “volumetric cytometer” device.32 Thus, by means of this laser-scanning fluorometric cytometry technique the receptor-bound ligand is discriminated from the free ligand in solution.31 However, although this new assay may allow miniaturization in a HTS way, the performance of real-time kinetic binding experiments is unrealistic. Conversely, fluorescence polarization assays allow easy and fast kinetics studies that can be performed inexpensively on both ectopic and native receptors. In addition, homogeneous GPCR binding experiments can also be done by means of this tool. In brief, fluorescence polarization assays are based on the differential polarized fluorescence emission between restrained and freely moving fluorophores; thus, while a nonbound fluorescent ligand (i.e., freely diffusing) will emit a nonpolarized fluorescence, a receptor-bound ligand (i.e., with restricted mobility) will emit a polarized signal, a fact that leads to a high fluorescence anisotropy.33,34 However, the main drawback of this method consists of the narrow window of measurement; thus, although the measures are very reproducible, they are highly dependent on the nonspecific binding of the fluorescent ligands. In such way, a high ratio of bound/unbound ligand is needed in order to achieve a significant fluorescent polarization signal. Indeed, the fluorescent ligand intrinsic properties (i.e., affinity and fluorescent lifetime) may determine the possibility to perform this assay. Thus, if affinity is too low, high concentrations of the ligand would be required, which would limit the proportion of bound ligand; while if affinity is too high, low concentrations would lead to small signals difficult to isolate from the background. Similar to the previous methods, some fluorescent-based binding assays with reasonable sensitivity and resolution have been developed thanks to the synthesis of high-quality fluorescent ligands for GPCRs.35,36 Importantly, these assays can be performed in living cells and therefore maintain the organized membrane environment where receptors transduce the signal, while as commented above the characterization of pharmacological parameters is not as precise as with radioligand binding approaches. For example, a competition binding assay using a fluorescent antagonist for A3 receptor37 (Table 1 and 2) and a high-content screening system for the automated capture and analysis of images was developed.37 Noteworthily, these authors demonstrated that accurate affinity values for these ligands could be obtained by just measuring total cell image intensity, thus potentially allowing the screening of a fragment library to identify low-affinity lead compounds with a low molecular weight and complexity, desirable characteristics for a drug candidate lead.38 Overall, although the above-mentioned techniques offer good experimental outputs, they also present several drawbacks that preclude their extensive use as generalized tools for the study of ligand–receptor binding.
Table 2. Archetypal Fluorescent GPCR Ligands.
An important step forward in the pharmacological characterization of GPCRs was the incorporation of fluorescent receptor ligands into the RET-based technologies (see Box 1). Thus, fluorescent ligands can act either as donor or as acceptor chromophores to engage in a FRET process with a fluorescently tagged receptor (Figure 1a). In addition, the use of RET technologies allows the performance of homogeneous FRET-based binding assays. Interestingly, in these FRET-based ligand–receptor binding experiments the unbound fluorescent ligand does not engage in the FRET process, thus only the bound ligand is FRET effective, a fact that allows increasing the signal-to-noise ratio. Indeed, several strategies have been developed to set up FRET-based binding assays at the cell surface. Initially, receptors were tagged at their N-terminus with fluorescent proteins (e.g., green fluorescent protein, GFP; yellow fluorescent protein, YFP; or cyan fluorescent protein, CFP) and then challenged with FRET-compatible fluorescent ligands (Figure 1a). Thus, upon binding, the fluorescent ligand would interact with the tagged receptor, and since the distance between the two fluorophores would be small enough, a FRET process would be engaged. By using this approach, the binding to the human M1 muscarinic receptor (Table 1) of the fluorescent antagonist pirenzepine labeled with fluorophore Bodipy was described.39 Similarly, we recently developed a FRET-based approach to study the agonist binding properties of adenosine A2A receptor (A2AR; Tables 1 and 2) in single cell and in a real-time mode (Figure 1).40 To this end, we synthesized an A2AR fluorescent ligand in which the fluorescent dye Alexa Fluor 532 was covalently attached to the A2AR agonist 2-[[2-[4-[2-(2-aminoethyl)-aminocarbonyl]ethyl]phenyl]ethylamino]-5′-N-ethyl-carboxamidoadenosine (APEC) (Table 2). In addition, we also engineered an N-terminal CFP-tagged A2AR, which could engage in a FRET process with the fluorescent ligand under binding conditions (Figure 1a). Thus, by recording the FRET signal in real-time mode, we were able to monitor its association to and dissociation from A2AR (Figure 1b).40 An alternative approach consists of tagging the receptor at the N-terminus with self-labeling proteins or suicide enzymes (e.g., SNAP- or CLIP-tag), which can be covalently labeled with the corresponding substrates41−45 and thus act as donor or acceptor molecules in a FRET process with the fluorescent receptor ligand. On the other hand, the use of lanthanides, such as europium (Eu3+) or terbium (Tb3+) complexed with either chelates or cryptates, as donor molecules has permitted the development of highly sensitive and reproducible tools for use in time-resolved FRET (TR-FRET). Thus, lanthanides, as commented above, present a long-lived emission fluorescence that permits temporally separating excitation and detection events (time-resolved) of the energy transfer.46−48 Furthermore, the bleed-through of the lanthanide emission (e.g., 340 nm for Lumi4-Tb) into the acceptor emission wavelength (e.g., 647 nm for dy647) is negligible, which in addition to a highly efficient energy transfer confers a high signal-to-noise ratio to this tool.49,50 Overall, TR-FRET has overcome classical FRET approaches mainly based on its temporal selectivity and spectral compatibility. Interestingly, Zwier and collaborators recently developed a TR-FRET-based binding assay in which SNAP-tagged μ, δ, and κ opioid receptors (Table 1) were labeled with the highly emissive Lumi4-Tb lanthanide as a donor and subsequently challenged with a ligand for these receptors bearing either a green or red acceptor (i.e., red-naltrexone) (Table 2).7 Importantly, by inhibiting the FRET signal with a nonlabeled compound (e.g., competitive binding experiments), it would be possible to identify and characterize new GPCR ligands from a compound library, furthermore ensuring high specificity of the assay for the GPCR of interest.51 Next, another strategy explored consists of the noncovalent labeling of receptors with specific antibodies containing attached fluorophores that may engage in a FRET process with a fluorescent ligand bound to the same antibody-detected receptor. Interestingly, a TR-FRET competition method was recently developed in which a TR-FRET process was engaged between a selective vasopressin V1a receptor ligand labeled with europium cryptate and an Alexa Fluor 647-labeled monoclonal antibody against an HA-tag located at the N-terminal tail of the former receptor.52 Thereafter, once the ligand-antibody TR-FRET process achieved equilibrium conditions, the receptor could be challenged with nonlabeled ligands, for instance vasopressin, in order to study the receptor–ligand binding kinetics.52 It is necessary to mention that antibody-based approaches largely rely on the specificity of the antibody used and on the accessibility of the receptor extracellular epitope (i.e., flag-tag or native epitope).53 Finally, it is interesting to mention one of the latest technical approaches developed, based on the use of quenchers. In brief, quenching consists of suppressing fluorescence intensity of a given substance. There exist distinct experimental approaches. For instance, in order to detect ligand–receptor interactions fluorescent ligands can be substituted by ligands carrying quenchers. These nonfluorescent probes present the main advantage of eliminating the potential problem of fluorescence background resulting from direct acceptor excitation. Therefore, only when ligand binding occurs the ligand-quencher molecule behaves as an efficient acceptor partner for a GFP-tagged receptor leading to a dramatic decrease of GFP emission, which is comparable to that obtained with fluorescent derivatives.54 Alternatively, fluorescent ligands can be used and determining changes on their fluorescence emission by means of a quencher. In this manner, a quenching resonance energy transfer assay was developed for the δ-opioid receptor.55 Thus, a luminescent signal was only observed when the labeled ligand was bound to the receptor, while when it was displaced by an unlabeled ligand, quenching occurred, since protection from quenching was mainly due to steric hindrance by the cell.55 Importantly, this assay permitted the study of ligand–receptor interactions in nonengineered receptors; thus, it could be implemented in native tissues. Furthermore, it was carried out in homogeneous conditions; thus, it may be rapidly added to the toolbox available to design efficient ligand–receptor FRET-based assays.
Figure 1.

Receptor ligand binding by real-time FRET in single living cells. (a) Schematic representation of FRET between a fluorescent ligand (LAlexa Fluor 532) and the corresponding fluorescently tagged receptor (RCFP). The GPCR and CFP structures were prepared using PyMOL and the PDBs 3EML and 1EMA, respectively. (b) Single-cell time-resolved changes in receptor–ligand FRET signal. The recording shows the changes in the F554/F480 ratio (orange trace) upon rapid superfusion of the fluorescent ligand. Adapted from Fernandez-Duenas et al.40
Ligand–Receptor FRET on the Study of GPCR Oligomerization
The incorporation of GPCR fluorescent ligands into the pharmacological toolbox devoted to receptor characterization constitutes, as commented above, a significant step forward in GPCR pharmacology. Thus, by means of these tools, it has been possible to design efficient strategies in order to elucidate unresolved questions concerning GPCR biology, as it is GPCR oligomerization. In such way, from the tools previously described, it seems likely that FRET tools based on ligand–receptor interactions represent a very valuable approach to detect oligomeric complexes at the plasma membrane of living cells. Thus, these approaches are compatible with physiological conditions of ligand–receptor interactions, and furthermore, they permit the study of GPCR oligomerization not only in heterologous systems but also in native tissues. In this manner, different approaches based on the use of fluorescent ligands interacting with particular receptors have been applied to ascertain receptor oligomerization (Figure 2) and also to reveal allosteric interactions within GPCR oligomeric complexes.
Figure 2.

Schematic representation of FRET-based methods using fluorescent ligands applied to the study of GPCR oligomerization in the cell surface of living cells. A putative receptor bearing a fluorescent tag (FT) on its N-terminal domains (R1FT) can engage in a FRET process with a compatible fluorescent ligand (FL) bound to the counterpart receptor (R2) of the oligomer (a). This approach requires the ectopic expression of the R1FT construct, thus precluding the study of native GPCRs. Alternatively, one of the receptors forming the oligomer can be detected by means of a specific antibody (i.e., Anti-R1) bearing a FT, which is FRET compatible with the FL (b). Finally, the receptors forming the oligomer can be detected with FRET compatible specific fluorescent ligands (i.e., FL1 and FL2), which upon binding to their respective receptors within the oligomer can engage in a FRET process (c). Interestingly, the experimental approaches shown in b and c allow the detection of both ectopic expressed and native receptors. The structures were prepared using PyMOL, as described in Figure 1.
First, in order to perform FRET studies on unmodified receptors, selective fluorescent-labeled ligands, either agonists or antagonists, can eventually be bound to their receptors within the oligomer, and then assess the close proximity between the former receptors by means of the engagement of a FRET process between the attached fluorophores (Figure 2c). In this manner, in cells cotransfected with somatostatin type 1 and 5 receptors the formation of homo- and heteromers was assessed by monitoring the FRET process engaged between two fluorescent ligands, in which either the fluorophore FITC or Texas Red was attached to the peptidic somatostatin receptor ligand SST-14.56 Similarly, the dimerization of the M1 muscarinic receptor (Table 1) was demonstrated using the antagonist telenzepine, prefunctionalized as an extended alkylamino derivative and labeled with either Cy3B or Alexa Fluor 488 chromophores (Table 2).57 In this case, by using total internal reflection fluorescence microscopy (TIRFM) in living cells, the position of individual receptors over time and their mobility, clustering, and dimerization kinetics were determined with a resolution of ∼30 ms and ∼20 nm.57
Another parallel strategy developed to study GPCR oligomerization under physiological conditions consists of eliciting a FRET process between a receptor fluorescent ligand and a labeled antibody against the cognate receptor (Figure 2b). Needless to say, apart from the fact that specific antibodies for GPCRs with high affinity are difficult to obtain, this strategy presents a major drawback, that is, the size of antibodies. They can generate important steric hindrance in the vicinity of receptors, and thus, adequate controls are needed to correctly interpret receptor oligomerization. Furthermore, it must be considered that antibodies are bivalent proteins and that it would be possible that they may artificially drive oligomerization of receptors.58 Interestingly, this kind of approach has been used to assess GPCR oligomerization in both heterologous systems and native tissues. Accordingly, it was demonstrated that ghrelin and dopamine D2 receptors (GHS-R1a and D2R, respectively; Table 1) do oligomerize, both in HEK293 cells and in hypothalamic mice neurons.59 Briefly, the detection of the formation of GHS-R1a/D2R oligomers was first assessed in vitro by performing TR-FRET between fluorophore-tagged receptors, using terbium cryptate as a donor and Alexa Fluor 647 as an acceptor. Subsequently, the authors succeeded in detecting the formation of the oligomer in membrane preparations from mouse hypothalamus by monitoring the specific TR-FRET signal elicited between a red-labeled GHS-R1a ligand (acceptor) (Table 2) and a terbium cryptate secondary antibody (donor) detecting a primary anti-D2R antibody.59 Noteworthily, although the latter study represents a great advance in the detection of receptor–receptor interactions in native tissue, the proof of concept of this theory was devised by Durroux’s group through evidence for vasopressin or oxytocin receptor dimers.60 Thus, taking advantage of the synthesis of vasopressin receptor antagonists, for instance phenylpropionyl-linear-vasopressin labeled either with europium cryptate or Alexa Fluor 647, the formation of vasopressin or oxytocin dimers was first demonstrated in COS-7 cells expressing both receptors. Interestingly, negative binding cooperativity within receptor oligomers was assessed by using fluorescent derivatized agonists, revealed by weaker TR-FRET signals compared to that obtained with antagonists.60 Collectively, these results were compatible with the assumption that positive or noncooperative receptor binding would be observed for some antagonists and negative cooperative receptor binding for agonists, thus highlighting the impact of oligomerization in GPCR pharmacology (for review see refs (61 and 62)). Interestingly, the hypothesis that receptor oligomerization might facilitate the phenomena of ligand binding cooperativity was subsequently validated by similar experiments but using the D2R. Therefore, by means of a TR-FRET compatible set of fluorescent-labeled antagonists (Table 2) and agonists, similar qualitative results were obtained demonstrating the formation of D2R dimers.60 Finally, since results obtained in heterologous expression systems could potentially be impaired by different factors (e.g., the use of chimeric receptors, overexpression, etc.), the detection of receptor oligomers was assessed in native tissue, namely rat mammary glands, by using the same TR-FRET approach. Interestingly, as occurs in cell lines, a specific FRET signal resulting from the interaction between fluorescent ligands bound to the endogenous oxytocin receptors was observed, thus demonstrating the close proximity existing between oxytocin binding sites. Importantly, as in the heterologous system the TR-FRET signal obtained when challenging the membranes with agonists was lower than that obtained with antagonists, thus substantiating the existence of the observed direct receptor–receptor interaction.60
The main advantage of the above-mentioned approaches consists of the possibility of detecting receptor–receptor interactions in the native context. Nevertheless, other technical approaches have been used to study GPCR oligomerization phenomena, and these have allowed tackling other aspects surrounding receptor oligomerization, for instance the effects of a ligand-activated receptor to the counterpart protomer of the oligomer, in other words, to assess the occurrence of receptor–receptor allosterism. These tools are based on the interaction of a fluorescent ligand with a fluorophore-tagged receptor, as described above. Thus, the fluorescent ligand can bind to its own self-labeled-protomer within the oligomer (i.e., R1*), and then, the receptor–receptor mediated allosterism is studied by monitoring ligand–receptor FRET changes promoted by a nonlabeled ligand specifically challenging the counterpart protomer (i.e., R2). Alternatively, the fluorescent ligand can be bound to the nonlabeled receptor (i.e., R2) and engage in a FRET process with the counterpart fluorophore-tagged receptor (i.e., R1*) (Figure 2a). Similar to this last approach, when studying the D2R/GHS-R1a oligomers, the set of experiments validating the oligomer formation in transfected cells included the determination of a TR-FRET process between D2R receptors labeled with a cryptate fluorophore and the red-GHS-R1a ligand.59 Interestingly, these experiments also demonstrated functional effects of such receptor–receptor interaction. Thus, while D2R activation did not induce Ca2+ transients, upon coexpression of GHS-R1a and D2R, it was possible to detect Ca2+ transients induced by D2R agonists.59
On the other hand, as described above, it is also possible to take advantage of the binding of the fluorescent ligand to its own labeled receptor. Accordingly, we studied the allosteric modulation of adenosine A2AR agonist binding by using our single-cell real-time FRET experimental set up (Figure 1).40 Interestingly, by means of this approach, we were able to analyze the allosteric modulation of A2AR agonist binding by the D2R within the A2AR/D2R oligomer framework. Therefore, upon A2AR-D2R coexpression the binding of the A2AR ligand and consequently the FRET obtained was diminished when challenging the A2AR with the A2AR fluorescent agonist in the presence of the D2R agonist quinpirole.40 Thus, D2R agonists would exert a negative allosteric modulation (NAM) on A2AR binding. Interestingly, we have recently obtained data63 indicating that it would be possible to characterize distinct D2R agonists in terms of their NAM-A2AR binding activity. Thus, we studied the effects of distinct antiparkinsonian drugs in current clinical use (i.e., pramipexole, rotigotine, and apomorphine) on A2AR binding and provided evidence for the existence of a differential D2R-mediated negative allosteric modulation on A2AR agonist binding that was oligomer-formation dependent, and with apomorphine being the most effective antiparkinsonian drug in attenuating A2AR agonist binding.63 These recent results might be valuable information for designing efficacious drugs for the management of distinct CNS pathologies in which the adenosine–dopamine systems play a key role, for example, Parkinson’s disease.
Concluding Remarks
Fluorescence-based methodologies to label GPCRs initially provided the possibility to monitor the expression and cellular localization of these receptors. However, receptor visualization by means of fluorescent ligands represents only the first step toward a variety of potential applications for unravelling GPCR biology. Thus, these methodologies may also allow the investigation of GPCR functionality, trafficking and biosynthesis/degradation as well as the identification and visualization of protein–protein interactions including receptor oligomerization. Concerning the oligomerization phenomena, the development and optimization of such tools based on ligand–receptor interactions promise in the near future to allow an accurate study of the role of these complexes, and importantly both in normal and pathological conditions. Accordingly, these advances might likely contribute to the development of new drug targets, in order to achieve a better management of diseases in which receptor–receptor interactions would play a key role. In addition, since GPCR oligomers might constitute unique targets, they might propel innovative drug discovery studies for specifically tackling individual pathologies.64 Finally, it is important to mention that recent advances in instrumentation have accelerated rapid qualitative and quantitative data analysis, thus permitting the development of HTS applications. Overall, the study of receptor–receptor interactions (i.e., GPCR oligomerization) continues to be a major challenge for modern pharmacology, and the development and optimization of new and innovative tools will stimulate major advances in this area.
Acknowledgments
This work was supported by grants SAF2011-24779, Consolider-Ingenio CSD2008-00005 and PCIN-2013-019-C03-03 from Ministerio de Economía y Competitividad and ICREA Academia-2010 from the Catalan Institution for Research and Advanced Studies to FC and the NIDDK-NIH Intramural Research Program. Also, VF-D and FC belong to the “Neuropharmacology and Pain” accredited research group (Generalitat de Catalunya, 2009 SGR 232).
The authors declare no competing financial interest.
Funding Statement
National Institutes of Health, United States
References
- Lefkowitz R. J. (2000) The superfamily of heptahelical receptors. Nat. Cell Biol. 2, E133–6. [DOI] [PubMed] [Google Scholar]
- Gilman A. G. (1987) G proteins: Transducers of receptor-generated signals. Annu. Rev. Biochem. 56, 615–649. [DOI] [PubMed] [Google Scholar]
- Wettschureck N.; Offermanns S. (2005) Mammalian G proteins and their cell type specific functions. Physiol. Rev. 85, 1159–1204. [DOI] [PubMed] [Google Scholar]
- Ritter S. L.; Hall R. A. (2009) Fine-tuning of GPCR activity by receptor-interacting proteins. Nat. Rev. Cell Biol. 10, 819–830. [DOI] [PMC free article] [PubMed] [Google Scholar]
- Ciruela F.; Vilardaga J.-P.; Fernández-Dueñas V. (2010) Lighting up multiprotein complexes: Lessons from GPCR oligomerization. Trends Biotechnol. 28, 407–415. [DOI] [PMC free article] [PubMed] [Google Scholar]
- Cottet M.; Faklaris O.; Maurel D.; Scholler P.; Doumazane E.; Trinquet E.; Pin J. P.; Durroux T. (2012) BRET and time-resolved FRET strategy to study GPCR oligomerization: From cell lines toward native tissues. Front. Endocrinol. (Lausanne) 3, 92. [DOI] [PMC free article] [PubMed] [Google Scholar]
- Zwier J. M.; Roux T.; Cottet M.; Durroux T.; Douzon S.; Bdioui S.; Gregor N.; Bourrier E.; Oueslati N.; Nicolas L.; Tinel N.; Boisseau C.; Yverneau P.; Charrier-Savournin F.; Fink M.; Trinquet E. (2010) A fluorescent ligand-binding alternative using Tag-lite(R) technology. J. Biomol. Screening 15, 1248–1259. [DOI] [PubMed] [Google Scholar]
- McGrath J. C.; Arribas S.; Daly C. J. (1996) Fluorescent ligands for the study of receptors. Trends Pharmacol. Sci. 17, 393–399. [DOI] [PubMed] [Google Scholar]
- Kozma E.; Jayasekara P. S.; Squarcialupi L.; Paoletta S.; Moro S.; Federico S.; Spalluto G.; Jacobson K. A. (2013) Fluorescent ligands for adenosine receptors. Bioorg. Med. Chem. Lett. 23, 26–36. [DOI] [PMC free article] [PubMed] [Google Scholar]
- Vernall A. J.; Hill S. J.; Kellam B. (2013) The evolving small-molecule fluorescent-conjugate toolbox for class A GPCRs. Br. J. Pharmacol. 171, 1073–84. [DOI] [PMC free article] [PubMed] [Google Scholar]
- Waggoner A. (2006) Fluorescent labels for proteomics and genomics. Curr. Opin. Chem. Biol. 10, 62–66. [DOI] [PubMed] [Google Scholar]
- Lavis L. D.; Raines R. T. (2014) Bright building blocks for chemical biology. ACS Chem. Biol. 9, 855–866. [DOI] [PMC free article] [PubMed] [Google Scholar]
- Madsen B. W.; Beglan C. L.; Spivak C. E. (2000) Fluorescein-labeled naloxone binding to mu opioid receptors on live Chinese hamster ovary cells using confocal fluorescent microscopy. J. Neurosci. Methods 97, 123–131. [DOI] [PubMed] [Google Scholar]
- Pick H.; Preuss A. K.; Mayer M.; Wohland T.; Hovius R.; Vogel H. (2003) Monitoring expression and clustering of the ionotropic 5HT3 receptor in plasma membranes of live biological cells. Biochemistry 42, 877–884. [DOI] [PubMed] [Google Scholar]
- Tahtaoui C.; Parrot I.; Klotz P.; Guillier F.; Galzi J. L.; Hibert M.; Ilien B. (2004) Fluorescent pirenzepine derivatives as potential bitopic ligands of the human M1 muscarinic receptor. J. Med. Chem. 47, 4300–4315. [DOI] [PubMed] [Google Scholar]
- Fabry M.; Cabrele C.; Hocker H.; Beck-Sickinger A. G. (2000) Differently labeled peptide ligands for rapid investigation of receptor expression on a new human glioblastoma cell line. Peptides 21, 1885–1893. [DOI] [PubMed] [Google Scholar]
- Hegener O.; Prenner L.; Runkel F.; Baader S. L.; Kappler J.; Haberlein H. (2004) Dynamics of β2-adrenergic receptor–ligand complexes on living cells. Biochemistry 43, 6190–6199. [DOI] [PubMed] [Google Scholar]
- Strong A. E.; Thierry A. C.; Cousin P.; Moulon C.; Demotz S. (2006) Synthetic chemokines directly labeled with a fluorescent dye as tools for studying chemokine and chemokine receptor interactions. Eur. Cytokine Netw. 17, 49–59. [PubMed] [Google Scholar]
- Rao J.; Dragulescu-Andrasi A.; Yao H. (2007) Fluorescence imaging in vivo: Recent advances. Curr. Opin. Biotechnol. 18, 17–25. [DOI] [PubMed] [Google Scholar]
- Bohme I.; Beck-Sickinger A. G. (2009) Illuminating the life of GPCRs. Cell Commun. Signal 7, 16. [DOI] [PMC free article] [PubMed] [Google Scholar]
- Yildiz I.; Tomasulo M.; Raymo F. M. (2006) A mechanism to signal receptor–substrate interactions with luminescent quantum dots. Proc. Natl. Acad. Sci. U.S.A. 103, 11457–11460. [DOI] [PMC free article] [PubMed] [Google Scholar]
- Resch-Genger U.; Grabolle M.; Cavaliere-Jaricot S.; Nitschke R.; Nann T. (2008) Quantum dots versus organic dyes as fluorescent labels. Nat. Methods 5, 763–75. [DOI] [PubMed] [Google Scholar]
- Lutz W. H.; Londowski J. M.; Kumar R. (1990) The synthesis and biological activity of four novel fluorescent vasopressin analogs. J. Biol. Chem. 265, 4657–4663. [PubMed] [Google Scholar]
- Lutz W.; Sanders M.; Salisbury J.; Lolait S.; O’Carroll A. M.; Kumar R. (1993) Vasopressin receptor-mediated endocytosis in cells transfected with V1-type vasopressin receptors. Kidney Int. 43, 845–852. [DOI] [PubMed] [Google Scholar]
- Turcatti G.; Nemeth K.; Edgerton M. D.; Knowles J.; Vogel H.; Chollet A. (1997) Fluorescent labeling of NK2 receptor at specific sites in vivo and fluorescence energy transfer analysis of NK2 ligand-receptor complexes. Receptors Channels 5, 201–7. [PubMed] [Google Scholar]
- Schneider E.; Keller M.; Brennauer A.; Hoefelschweiger B. K.; Gross D.; Wolfbeis O. S.; Bernhardt G.; Buschauer A. (2007) Synthesis and characterization of the first fluorescent nonpeptide NPY Y1 receptor antagonist. ChemBioChem 8, 1981–1988. [DOI] [PubMed] [Google Scholar]
- Briddon S. J.; Kellam B.; Hill S. J. (2011) Design and use of fluorescent ligands to study ligand-receptor interactions in single living cells. Methods Mol. Biol. 746, 211–236. [DOI] [PubMed] [Google Scholar]
- Cottet M.; Faklaris O.; Falco A.; Trinquet E.; Pin J. P.; Mouillac B.; Durroux T. (2013) Fluorescent ligands to investigate GPCR binding properties and oligomerization. Biochem. Soc. Trans. 41, 148–153. [DOI] [PubMed] [Google Scholar]
- Hemmilä I.; Dakubu S.; Mukkala V. M.; Siitari H.; Lövgren T. (1984) Europium as a label in time-resolved immunofluorometric assays. Anal. Biochem. 137, 335–43. [DOI] [PubMed] [Google Scholar]
- Handl H. L.; Vagner J.; Yamamura H. I.; Hruby V. J.; Gillies R. J. (2005) Development of a lanthanide-based assay for detection of receptor–ligand interactions at the δ-opioid receptor. Anal. Biochem. 343, 299–307. [DOI] [PubMed] [Google Scholar]
- Zuck P.; Lao Z.; Skwish S.; Glickman J. F.; Yang K.; Burbaum J.; Inglese J. (1999) Ligand–receptor binding measured by laser-scanning imaging. Proc. Natl. Acad. Sci. U. S.A. 96, 11122–11127. [DOI] [PMC free article] [PubMed] [Google Scholar]
- Dietz L. J.; Dubrow R. S.; Manian B. S.; Sizto N. L. (1996) Volumetric capillary cytometry: A new method for absolute cell enumeration. Cytometry 23, 177–186. [DOI] [PubMed] [Google Scholar]
- Parker G. J.; Law T. L.; Lenoch F. J.; Bolger R. E. (2000) Development of high throughput screening assays using fluorescence polarization: nuclear receptor–ligand-binding and kinase/phosphatase assays. J. Biomol. Screening 5, 77–88. [DOI] [PubMed] [Google Scholar]
- Allen M.; Reeves J.; Mellor G. (2000) High throughput fluorescence polarization: A homogeneous alternative to radioligand binding for cell surface receptors. J. Biomol. Screening 5, 63–69. [DOI] [PubMed] [Google Scholar]
- Daly C. J.; Ross R. A.; Whyte J.; Henstridge C. M.; Irving A. J.; McGrath J. C. (2010) Fluorescent ligand binding reveals heterogeneous distribution of adrenoceptors and “cannabinoid-like” receptors in small arteries. Br. J. Pharmacol. 159, 787–796. [DOI] [PMC free article] [PubMed] [Google Scholar]
- May L. T.; Self T. J.; Briddon S. J.; Hill S. J. (2010) The effect of allosteric modulators on the kinetics of agonist-G protein-coupled receptor interactions in single living cells. Mol. Pharmacol. 78, 511–523. [DOI] [PMC free article] [PubMed] [Google Scholar]
- Stoddart L. A.; Vernall A. J.; Denman J. L.; Briddon S. J.; Kellam B.; Hill S. J. (2012) Fragment screening at adenosine-A(3) receptors in living cells using a fluorescence-based binding assay. Chem. Biol. 19, 1105–1115. [DOI] [PMC free article] [PubMed] [Google Scholar]
- Hopkins A. L.; Groom C. R.; Alex A. (2004) Ligand efficiency: A useful metric for lead selection. Drug Discovery Today 9, 430–431. [DOI] [PubMed] [Google Scholar]
- Ilien B.; Franchet C.; Bernard P.; Morisset S.; Weill C. O.; Bourguignon J. J.; Hibert M.; Galzi J. L. (2003) Fluorescence resonance energy transfer to probe human M1 muscarinic receptor structure and drug binding properties. J. Neurochem. 85, 768–778. [DOI] [PubMed] [Google Scholar]
- Fernandez-Duenas V.; Gomez-Soler M.; Jacobson K. A.; Kumar S. T.; Fuxe K.; Borroto-Escuela D. O.; Ciruela F. (2012) Molecular determinants of A(2A) R-D(2) R allosterism: Role of the intracellular loop 3 of the D(2) R. J. Neurochem. 123, 373–384. [DOI] [PMC free article] [PubMed] [Google Scholar]
- Sun X.; Zhang A.; Baker B.; Sun L.; Howard A.; Buswell J.; Maurel D.; Masharina A.; Johnsson K.; Noren C. J.; Xu M. Q.; Correa I. R. Jr. (2011) Development of SNAP-tag fluorogenic probes for wash-free fluorescence imaging. ChemBioChem 12, 2217–2226. [DOI] [PMC free article] [PubMed] [Google Scholar]
- Gautier A.; Juillerat A.; Heinis C.; Correa I. R. Jr.; Kindermann M.; Beaufils F.; Johnsson K. (2008) An engineered protein tag for multiprotein labeling in living cells. Chem. Biol. 15, 128–136. [DOI] [PubMed] [Google Scholar]
- Keppler A.; Gendreizig S.; Gronemeyer T.; Pick H.; Vogel H.; Johnsson K. (2003) A general method for the covalent labeling of fusion proteins with small molecules in vivo. Nat. Biotechnol. 21, 86–89. [DOI] [PubMed] [Google Scholar]
- Keppler A.; Kindermann M.; Gendreizig S.; Pick H.; Vogel H.; Johnsson K. (2004) Labeling of fusion proteins of O6-alkylguanine-DNA alkyltransferase with small molecules in vivo and in vitro. Methods 32, 437–444. [DOI] [PubMed] [Google Scholar]
- Keppler A.; Pick H.; Arrivoli C.; Vogel H.; Johnsson K. (2004) Labeling of fusion proteins with synthetic fluorophores in live cells. Proc. Natl. Acad. Sci. U.S.A. 101, 9955–9959. [DOI] [PMC free article] [PubMed] [Google Scholar]
- Mathis G. (1993) Rare earth cryptates and homogeneous fluoroimmunoassays with human sera. Clin. Chem. 39, 1953–1959. [PubMed] [Google Scholar]
- Mathis G. (1995) Probing molecular interactions with homogeneous techniques based on rare earth cryptates and fluorescence energy transfer. Clin. Chem. 41, 1391–1397. [PubMed] [Google Scholar]
- Bazin H.; Preaudat M.; Trinquet E.; Mathis G. (2001) Homogeneous time resolved fluorescence resonance energy transfer using rare earth cryptates as a tool for probing molecular interactions in biology. Spectrochim. Acta Part A, Mol. Biomol. Spectrosc. 57, 2197–2211. [DOI] [PubMed] [Google Scholar]
- Bazin H.; Trinquet E.; Mathis G. (2002) Time resolved amplification of cryptate emission: A versatile technology to trace biomolecular interactions. J. Biotechnol. 82, 233–250. [DOI] [PubMed] [Google Scholar]
- Terrillon S.; Durroux T.; Mouillac B.; Breit A.; Ayoub M. A.; Taulan M.; Jockers R.; Barberis C.; Bouvier M. (2003) Oxytocin and vasopressin V1a and V2 receptors form constitutive homo- and heterodimers during biosynthesis. Mol. Endocrinol. 17, 677–691. [DOI] [PubMed] [Google Scholar]
- Cottet M.; Albizu L.; Comps-Agrar L.; Trinquet E.; Pin J. P.; Mouillac B.; Durroux T. (2011) Time resolved FRET strategy with fluorescent ligands to analyze receptor interactions in native tissues: application to GPCR oligomerization. Methods Mol. Biol. 746, 373–387. [DOI] [PubMed] [Google Scholar]
- Albizu L.; Teppaz G.; Seyer R.; Bazin H.; Ansanay H.; Manning M.; Mouillac B.; Durroux T. (2007) Toward efficient drug screening by homogeneous assays based on the development of new fluorescent vasopressin and oxytocin receptor ligands. J. Med. Chem. 50, 4976–4985. [DOI] [PubMed] [Google Scholar]
- Maurel D.; Kniazeff J.; Mathis G.; Trinquet E.; Pin J. P.; Ansanay H. (2004) Cell surface detection of membrane protein interaction with homogeneous time-resolved fluorescence resonance energy transfer technology. Anal. Biochem. 329, 253–262. [DOI] [PubMed] [Google Scholar]
- Tahtaoui C.; Guillier F.; Klotz P.; Galzi J.-L.; Hibert M.; Ilien B. (2005) On the use of nonfluorescent dye labeled ligands in FRET-based receptor binding studies. J. Med. Chem. 48, 7847–59. [DOI] [PubMed] [Google Scholar]
- Kopra K.; Shweta; Martikkala E.; Hänninen P.; Petäjä-Repo U.; Härmä H. (2013) A homogeneous single-label quenching resonance energy transfer assay for a δ-opioid receptor–ligand using intact cells. Analyst 138, 4907–14. [DOI] [PubMed] [Google Scholar]
- Patel R. C.; Kumar U.; Lamb D. C.; Eid J. S.; Rocheville M.; Grant M.; Rani A.; Hazlett T.; Patel S. C.; Gratton E.; Patel Y. C. (2002) Ligand binding to somatostatin receptors induces receptor-specific oligomer formation in live cells. Proc. Natl. Acad. Sci. U.S.A. 99, 3294–3299. [DOI] [PMC free article] [PubMed] [Google Scholar]
- Hern J. A.; Baig A. H.; Mashanov G. I.; Birdsall B.; Corrie J. E.; Lazareno S.; Molloy J. E.; Birdsall N. J. (2010) Formation and dissociation of M1 muscarinic receptor dimers seen by total internal reflection fluorescence imaging of single molecules. Proc. Natl. Acad. Sci. U.S.A. 107, 2693–2698. [DOI] [PMC free article] [PubMed] [Google Scholar]
- Maurel D.; Comps-Agrar L.; Brock C.; Rives M. L.; Bourrier E.; Ayoub M. A.; Bazin H.; Tinel N.; Durroux T.; Prezeau L.; Trinquet E.; Pin J. P. (2008) Cell-surface protein–protein interaction analysis with time-resolved FRET and SNAP-tag technologies: Application to GPCR oligomerization. Nat. Methods 5, 561–567. [DOI] [PMC free article] [PubMed] [Google Scholar]
- Kern A.; Albarran-Zeckler R.; Walsh H. E.; Smith R. G. (2012) Apo-ghrelin receptor forms heteromers with DRD2 in hypothalamic neurons and is essential for anorexigenic effects of DRD2 agonism. Neuron 73, 317–332. [DOI] [PMC free article] [PubMed] [Google Scholar]
- Albizu L.; Cottet M.; Kralikova M.; Stoev S.; Seyer R.; Brabet I.; Roux T.; Bazin H.; Bourrier E.; Lamarque L.; Breton C.; Rives M. L.; Newman A.; Javitch J.; Trinquet E.; Manning M.; Pin J. P.; Mouillac B.; Durroux T. (2010) Time-resolved FRET between GPCR ligands reveals oligomers in native tissues. Nat. Chem. Biol. 6, 587–594. [DOI] [PMC free article] [PubMed] [Google Scholar]
- Durroux T. (2005) Principles: A model for the allosteric interactions between ligand binding sites within a dimeric GPCR. Trends Pharmacol. Sci. 26, 376–384. [DOI] [PubMed] [Google Scholar]
- Rovira X.; Pin J. P.; Giraldo J. (2010) The asymmetric/symmetric activation of GPCR dimers as a possible mechanistic rationale for multiple signalling pathways. Trends Pharmacol. Sci. 31, 15–21. [DOI] [PubMed] [Google Scholar]
- Fernandez-Duenas V.; Gomez-Soler M.; Morato X.; Nunez F.; Das A.; Kumar T. S.; Jauma S.; Jacobson K. A.; Ciruela F. (2013) Dopamine D2 receptor-mediated modulation of adenosine A2A receptor agonist binding within the A2AR/D2R oligomer framework. Neurochem. Int. 63, 42–46. [DOI] [PMC free article] [PubMed] [Google Scholar]
- Fribourg M.; Moreno J. L.; Holloway T.; Provasi D.; Baki L.; Mahajan R.; Park G.; Adney S. K.; Hatcher C.; Eltit J. M.; Ruta J. D.; Albizu L.; Li Z.; Umali A.; Shim J.; Fabiato A.; MacKerell A. D. Jr.; Brezina V.; Sealfon S. C.; Filizola M.; Gonzalez-Maeso J.; Logothetis D. E. (2011) Decoding the signaling of a GPCR heteromeric complex reveals a unifying mechanism of action of antipsychotic drugs. Cell 147, 1011–1023. [DOI] [PMC free article] [PubMed] [Google Scholar]
- Cardullo R. A. (2007) Theoretical principles and practical considerations for fluorescence resonance energy transfer microscopy. Methods Cell Biol. 81, 479–494. [DOI] [PubMed] [Google Scholar]
- Förster T. (1948) Zwischenmolekulare energiewanderung und fluoreszenz. Ann. Phys. 2, 55–75. [Google Scholar]
- Stryer L.; Haugland R. P. (1967) Energy transfer: A spectroscopic ruler. Proc. Natl. Acad. Sci. U.S.A. 58, 719–726. [DOI] [PMC free article] [PubMed] [Google Scholar]
- Piston D. W.; Kremers G. J. (2007) Fluorescent protein FRET: The good, the bad, and the ugly. Trends Biochem. Sci. 32, 407–414. [DOI] [PubMed] [Google Scholar]
- James J. R.; Oliveira M. I.; Carmo A. M.; Iaboni A.; Davis S. J. (2006) A rigorous experimental framework for detecting protein oligomerization using bioluminescence resonance energy transfer. Nat. Methods 3, 1001–1006. [DOI] [PubMed] [Google Scholar]
- Bouvier M.; Heveker N.; Jockers R.; Marullo S.; Milligan G. (2007) BRET analysis of GPCR oligomerization: Newer does not mean better. Nat. Methods 4, 3–4. [DOI] [PMC free article] [PubMed] [Google Scholar]
- Varani K.; Portaluppi F.; Gessi S.; Merighi S.; Ongini E.; Belardinelli L.; Borea P. A. (2009) Dose and time effects of caffeine intake on human platelet adenosine A(2A) receptors: Functional and biochemical aspects. Circulation 102, 285–9. [DOI] [PubMed] [Google Scholar]
- Carroll M. A.; Doumad A. B.; Li J.; Cheng M. K.; Falck J. R.; McGiff J. C. (2006) Adenosine2A receptor vasodilation of rat preglomerular microvessels is mediated by EETs that activate the cAMP/PKA pathway. Am. J. Physiol. Renal Physiol. 291, F155–61. [DOI] [PubMed] [Google Scholar]
- Popoli P.; Betto P.; Reggio R.; Ricciarello G. (199) Adenosine A2A receptor stimulation enhances striatal extracellular glutamate levels in rats. Eur. J. Pharmacol. 287, 215–7. [DOI] [PubMed] [Google Scholar]
- Nagel J.; Schladebach H.; Koch M.; Schwienbacher I.; Müller C. E. (2003) Effects of an adenosine A2A receptor blockade in the nucleus accumbens on locomotion, feeding, and prepulse inhibition in rats. Synapse 49, 279–86. [DOI] [PubMed] [Google Scholar]
- Scammell T. E.; Gerashchenko D. Y.; Mochizuiki T.; McCarthy M. T.; Estabrooke I. V.; Sears C. A.; Scaper C. B.; Urade Y.; Hayaishi O. (2001) An adenosine A2a agonist increases sleep and induces Fos in ventrolateral preoptic neurons. Neuroscience 107, 653–63. [DOI] [PubMed] [Google Scholar]
- Zhong H.; Shlykov S. G.; Molina J. G.; Sanborn B. M.; Jacobson M. A.; Tilley S. L.; Blackburn M. R. (2003) Activation of murine lung mast cells by the adenosine A3 receptor. J. Immunol. 171, 338–45. [DOI] [PubMed] [Google Scholar]
- Das S.; Cordis G. A.; Maulik N.; Das D. K. (2005) Pharmacological preconditioning with resveratrol: role of CREB-dependent Bcl-2 signaling via adenosine A3 receptor activation. Am. J. Physiol. Heart Circ. Physiol. 288, H328–35. [DOI] [PubMed] [Google Scholar]
- Hinschen A. K.; Rose’Meyer R. B.; Headrick J. P. (2003) Adenosine receptor subtypes mediating coronary vasodilation in rat hearts. J. Cardiovasc. Pharmacol. 41, 73–80. [DOI] [PubMed] [Google Scholar]
- Avila M. Y.; Stone R. A.; Civan M. M. (2002) Knockout of A3 adenosine receptors reduces mouse intraocular pressure. Invest. Ophthalmol. Vis. Sci. 43, 3021–6. [PubMed] [Google Scholar]
- Stella L.; de Novellis V.; Marabese I.; Berrino L.; Maione S.; Filippelli A.; Rossi F. (1998) The role of A3 adenosine receptors in central regulation of arterial blood pressure. Br. J. Pharmacol. 125, 437–40. [DOI] [PMC free article] [PubMed] [Google Scholar]
- Breese G. R.; Duncan G. E.; Napier T. C.; Bondy S. C.; Iorio L. C.; Mueller R. A. (1987) 6-hydroxydopamine treatments enhance behavioral responses to intracerebral microinjection of D1- and D2-dopamine agonists into nucleus accumbens and striatum without changing dopamine antagonist binding. J. Pharmacol. Exp. Ther. 240, 167–76. [PMC free article] [PubMed] [Google Scholar]
- Bughi S.; Jost-Vu E.; Antonipillai I.; Nadler J.; Horton R. (1994) Effect of dopamine2 blockade on renal function under varied sodium intake. J. Clin. Endocrinol. Metab. 78, 1079–84. [DOI] [PubMed] [Google Scholar]
- Setlow B.; McGaugh J. L. (2000) D2 dopamine receptor blockade immediately post-training enhances retention in hidden and visible platform versions of the water maze. Learn. Mem. 7, 187–91. [DOI] [PubMed] [Google Scholar]
- Pasternak G. W. (1993) Pharmacological mechanisms of opioid analgesics. Clin. Neuropharmacol. 16, 1–18. [DOI] [PubMed] [Google Scholar]
- Boom M., Niesters M., Sarton E., Aarts L., Smith T. W., and Dahan A. (2012) Non-analgesic effects of opioids: Opioid-induced respiratory depression. Curr. Pharm. Des. 18, 5994–6004. [DOI] [PubMed]
- Marczak E. D.; Jinsmaa Y.; Myers P. H.; Blankenship T.; Wilson R.; Balboni G.; Salvadori S.; Lazarus L. H. (2009) Orally administered H-Dmt-Tic-Lys-NH-CH2-Ph (MZ-2), a potent μ/δ-opioid receptor antagonist, regulates obese-related factors in mice. Eur. J. Pharmacol. 616, 115–21. [DOI] [PMC free article] [PubMed] [Google Scholar]
- Samways D. S. K.; Henderson G. (2006) Opioid elevation of intracellular free calcium: Possible mechanisms and physiological relevance. Cell. Signalling 18, 151–61. [DOI] [PubMed] [Google Scholar]
- Handler C. M.; Geller E. B.; Adler M. W. (1992) Effect of μ-, κ-, and δ-selective opioid agonists on thermoregulation in the rat. Pharmacol. Biochem. Behav. 43, 1209–16. [DOI] [PubMed] [Google Scholar]
- Lammers J. W.; Minette P.; McCusker M.; Barnes P. J. (1989) The role of pirenzepine-sensitive (M1) muscarinic receptors in vagally mediated bronchoconstriction in humans. Am. Rev. Respir. Dis. 139, 446–9. [DOI] [PubMed] [Google Scholar]
- Wilson P. S.; Khimenko P. L.; Barnard J. W.; Moore T. M.; Taylor A. E. (1995) Muscarinic agonists and antagonists cause vasodilation in isolated rat lung. J. Appl. Physiol. 78, 1404–11. [DOI] [PubMed] [Google Scholar]
- Messer W. S.; Bohnett M.; Stibbe J. (1990) Evidence for a preferential involvement of M1 muscarinic receptors in representational memory. Neurosci. Lett. 116, 184–9. [DOI] [PubMed] [Google Scholar]
- Sen A. P.; Bhattacharya S. K. (1991) Thermic response of selective muscarinic agonists and antagonists in rat. Indian J. Exp. Biol. 29, 131–5. [PubMed] [Google Scholar]
- Polidori C.; Massi M.; Lambrecht G.; Mutschler E.; Tacke R.; Melchiorre C. (1990) Selective antagonists provide evidence that M1 muscarinic receptors may mediate carbachol-induced drinking in the rat. Eur. J. Pharmacol. 179, 159–65. [DOI] [PubMed] [Google Scholar]
- Kono M.; Nakamura Y.; Ishiura Y.; Komatsu K.; Kontani H.; Namiki M. (2006) Central muscarinic receptor subtypes regulating voiding in rats. J. Urol. 175, 353–7. [DOI] [PubMed] [Google Scholar]
- Wren A. M.; Seal L. J.; Cohen M. A.; Brynes A. E.; Frost G. S.; Murphy K. G.; Dhillo W. S.; Ghatei M. A.; Bloom S. R. (2001) Ghrelin enhances appetite and increases food intake in humans. J. Clin. Endocrinol. Metab. 86, 5992. [DOI] [PubMed] [Google Scholar]
- Takaya K.; Ariyasu H.; Kanamoto N.; Iwakura H.; Yoshimoto A.; Harada M.; Mori K.; Komatsu Y.; Usui T.; Shimatsu A.; Ogawa Y.; Hosoda K.; Akamizu T.; Kojima M.; Kangawa K.; Nakao K. (2000) Ghrelin strongly stimulates growth hormone release in humans. J. Clin. Endocrinol. Metab. 85, 4908–11. [DOI] [PubMed] [Google Scholar]
- Shi W.; Cui N.; Shi; Zhang X.; Yang Y.; Jiang C. (2007) Arginine vasopressin inhibits Kir6.1/SUR2B channel and constricts the mesenteric artery via V1a receptor and protein kinase C. Am. J. Physiol. Regul. Integr. Comp. Physiol. 293, R191–9. [DOI] [PubMed] [Google Scholar]
- Tachikawa K.; Yokoi H.; Nagasaki H.; Arima H.; Murase T.; Sugimura Y.; Miura Y.; Hirabayashi M.; Oiso Y. (2003) Altered cardiovascular regulation in arginine vasopressin-overexpressing transgenic rat. Am. J. Physiol. Endocrinol. Metab. 285, E1161–6. [DOI] [PubMed] [Google Scholar]
- Hasan K. N.; Shoji M.; Tsutaya S.; Kudo R.; Matsuda E.; Saito J.; Kimura T.; Yasujima M. (2006) Study of V1a vasopressin receptor gene single nucleotide polymorphisms in platelet vasopressin responsiveness. J. Clin. Lab. Anal. 20, 87–92. [DOI] [PMC free article] [PubMed] [Google Scholar]