

Abstract
Significant resources have been invested in sequencing studies to investigate the role of rare variants in complex disease etiology. However, the diagnostic interpretation of individual rare variants remains a major challenge, and may require accurate variant functional classification and the collection of large numbers of variant carriers. Utilizing sequence data from 458 individuals with hypertriglyceridemia and 333 controls with normal plasma triglyceride levels, we investigated these issues using GCKR, encoding glucokinase regulatory protein. Eighteen rare non-synonymous GCKR variants identified in these 791 individuals were comprehensively characterized by a range of biochemical and cell biological assays, including a novel high-throughput-screening-based approach capable of measuring all variant proteins simultaneously. Functionally deleterious variants were collectively associated with hypertriglyceridemia, but a range of in silico prediction algorithms showed little consistency between algorithms and poor agreement with functional data. We extended our study by obtaining sequence data on family members; however, functional variants did not co-segregate with triglyceride levels. Therefore, despite evidence for their collective functional and clinical relevance, our results emphasize the low predictive value of rare GCKR variants in individuals and the complex heritability of lipid traits.
INTRODUCTION
The past several years have seen a substantial investment in sequencing projects aimed at exploring the association of rare variants with genetically complex traits such as plasma lipid levels (1). Emerging work suggests that rare non-synonymous variants are important contributors to complex disease susceptibility (2,3). However, studies focusing on rare variants are by their nature limited by sample size (4). Increasing the number of variant carriers available for analysis by grouping rare variants or through family-based studies may increase the power to detect associations. For both approaches, determining the functional consequences of individual rare variants is critical. As the pace of variant discovery currently far outstrips functional characterization, analyses will likely continue to focus on non-synonymous variants classified by computational mutation prediction algorithms. However, the ability of current in silico programs to assign pathogenicity correctly to novel non-synonymous variants remains in question (5).
GCKR, encoding glucokinase regulatory protein (GKRP), represents a powerful opportunity to investigate the effects of vertically transmitted heterozygous rare variants in relation to plasma triglyceride levels, a complex trait with an estimated heritability of 35–40% (6). A common non-synonymous variant (p.P446L, rs1260326; minor allele frequency = 0.40 in Western Europeans) shows robust evidence for association with triglyceride levels both as a quantitative trait and with hypertriglyceridemia, defined as fasting plasma triglyceride levels above the 95th percentile, utilizing a case–control design (7,8). Additionally, rare non-synonymous GCKR variants collectively have been shown to affect triglyceride levels, and also appear enriched in hypertriglyceridemia (3,8). Perhaps most importantly, there is significant biological knowledge about the role of GKRP in the regulation of hepatic glucokinase (GCK), which has allowed the development of assays capable of discerning the effects of non-synonymous variants on protein function. These assays have provided compelling functional evidence biologically consistent with the direction of genetic effects (3,9,10).
The finding that rare variants in genes including GCKR are strongly enriched in the cases of hypertriglyceridemia suggests that these variants are collectively relevant to the hypertriglyceridemia phenotype (8). However, the contributions of individual genes and variants remain unclear. We therefore aimed to characterize extensively all rare, non-synonymous GCKR variants identified through sequencing of individuals with hypertriglyceridemia and controls with normal plasma triglyceride levels in a range of functional assays, to evaluate the performance of in silico tools for assigning pathogenicity, and to investigate the penetrance and heritability of rare GCKR variants by exploring co-segregation between heterozygous carriers of functional variants and metabolic phenotypes in families.
RESULTS
Utilizing a previously described cohort of 458 individuals with hypertriglyceridemia (defined as fasting plasma triglyceride levels above the 95th percentile) and 333 control individuals with normal plasma triglyceride levels, 30 individuals (24 cases, 6 controls) harboring a total of 18 rare (minor allele frequency <0.01) GCKR variants were identified by targeted exon sequencing (8). Seven variants (p.R51Q, p.E77G, p.Q234P, p.A519T, p.S183CfsX34, p.T379NfsX36, p.R540X) overlapped with variants reported in a previous population-based sequencing study of GCKR (3). These seven variants were observed in both hypertriglyceridemia cases (n = 13 individuals) and controls (n = 6); the non-overlapping variants (n = 11) were therefore each unique to a single individual with hypertriglyceridemia. To provide functional information on uncharacterized GCKR variants and to elucidate further the consequences of previously described variants, we carried out functional characterization of all 18 variants.
Three frameshift variants, as well as one nonsense variant, did not show any detectable expression in preliminary cell-based assays (Fig. 1A). One additional variant, a 23-base duplication causing a frameshift near the N-terminus of the protein (c.170_192dup; p.G65MfsX24) was assumed to cause complete loss of function and was not characterized. All 11 GCKR missense variants, as well as one in-frame duplication (c.17_22dup; p.R6_F7dup—previously reported as p.Q8_H9insRF), were selected for comprehensive functional characterization. Five variants (p.L37Q, p.G129R, p.Q234P, p.H438Y, p.P446L) resulted in significantly reduced protein expression (Fig. 1A). These results complement previous findings suggesting that the cellular behaviors of p.R51Q-GKRP and p.E77G-GKRP are qualitatively similar to WT-GKRP, while p.Q234P causes a number of defects (3). The phase of the common p.P446L variant could unambiguously be determined in all cases; four variants (p.R6_F7dup, p.E77G, p.M344I and p.D414E) that arose on the minor leucine-446 haplotype were therefore also characterized on the L446 background (Fig. 1B).
Figure 1.

Comparison and quantification of GKRP variant protein expression via western blot analysis. A representative experiment showing protein levels relative to endogenous tubulin for all variants in the p.P446 background (A) and p.L446 background (B). Quantification of multiple independent transfections [n = 4 in (A), n = 2 in (B)], performed in duplicate, is displayed underneath. Results shown are mean ± SEM. P-values relative to WT *<0.05; **<0.01; ****<0.0001 (unpaired t-test).
The primary recognized function of GKRP is to interact with and inhibit the glucose sensor GCK in the hepatocyte nucleus. We expressed and purified recombinant human GCK and wild-type (WT) and variant human GKRP to explore the effects of rare GCKR variants on the GCK–GKRP interaction. In an effort to increase sensitivity and throughput relative to existing kinetic assays, and to enable robust comparison between variants, we simultaneously measured the interaction between GCK and each variant GKRP (including the common p.P446L variant) using a sensitive, quantitative and miniaturized homogenous time-resolved fluorescence (HTRF) assay (Fig. 2A). All five variants which showed reduced protein levels in Figure 1A also demonstrated significantly reduced interaction with GCK. The GCK–GKRP interaction is enhanced by binding of the glycolytic intermediate fructose-6-phosphate (F6P) to GKRP, and is reduced by binding of fructose-1-phosphate (F1P). The additional effect of both phosphate esters on the GCK–GKRP interaction in the HTRF assay was therefore measured (Supplementary Material, Figs S1 and S2A), as was the direct affinity of variant GKRPs for F1P and F6P in the absence of GCK using microscale thermophoresis (MST) (Fig. 2B and C, Supplementary Material, Fig. S2B). While this manuscript was in preparation, the crystal structure of human GKRP complexed with F1P was solved (11). Mapping of each variant within this structure supported our experimental findings, with those variants in closest proximity to the sugar-binding site (p.R259W, p.M344I) showing the most pronounced effects on F1P and F6P binding affinity (Fig. 3).
Figure 2.

Functional properties of GKRP variants. Comparison of the affinity of recombinant WT or variant GKRP proteins for GCK via homogenous time-resolved fluorescence (A), and F1P (B) and F6P (C) via microscale thermophoresis. Interaction strength for each variant is depicted as a percentage of WT GKRP in (A) and as a negative log half-maximal effective concentration (B) or inhibitory concentration (C). An F6P dose–response curve could not be reliably fit for R259W because it did not appreciably respond to F6P (see Supplementary Material, Fig. S2B). Validation of high-throughput results using transient transfection-based cellular assays for the representative variant Q234P is shown in (D). This variant was tested for GKRP fluorescence localization in mouse hepatocytes (i) and HeLa cells (ii), effect on GCK fluorescence localization in mouse hepatocytes (iii) and GKRP–GCK interaction strength via quantitative fluorescence resonance energy transfer (FRETN) in mouse hepatocytes (iv). Results shown are mean ± SD of three to four replicates using two independent protein preparations per variant (A–C), and mean ± SEM in (D) (n = 3). White and black bars in (D), 5.5 mmol/l and 25 mmol/l glucose, respectively. The nucleus is indicated with an arrow. P-values *<0.05, **<0.01, ***<0.001 (ANOVA/Bonferroni correction).
Figure 3.
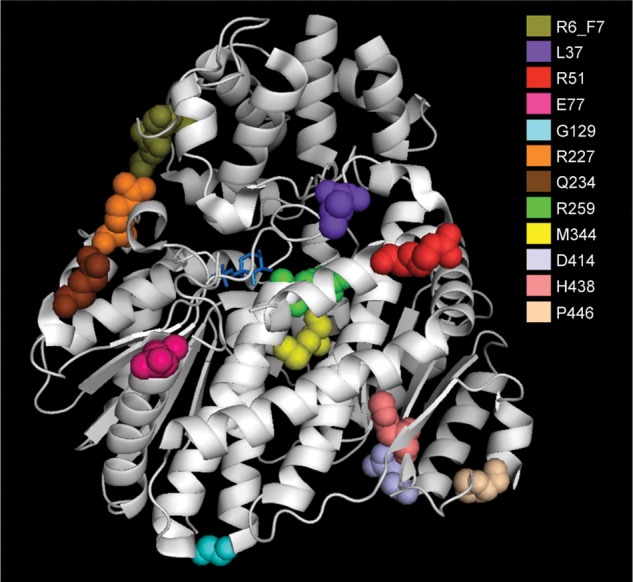
Ribbon model of the F1P-bound form of human GKRP. The structural model (Protein DataBank Entry 4BB9) indicates the location of each of the 10 missense variants, the insertion variant p.R6_F7dup and the common variant p.P446. F1P is indicated in stick form in blue.
Significant defects were observed for most variants (10 of 12) for GCK interaction, F1P interaction and/or F6P interaction. Defective variants were further categorized as ‘Mild’ or ‘Severe’ based on the cumulative extent of dysfunction observed for each variant protein (Supplementary Material, Tables S1 and S2). These results were validated using an extensive repertoire of published kinetic and cell-based methodologies (Fig. 2D; Supplementary Material, Table S3 and Fig. S3) (3,9,10). For example, p.Q234P, p.M344I and p.H438Y all demonstrated a significant reduction in nuclear localization compared with WT-GKRP in both HeLa cells and primary mouse hepatocytes (Fig. 2D; Supplementary Material, Fig. S3). However, the degree of this cellular defect was most pronounced for p.Q234P, the only variant which demonstrated global defects in protein expression, GCK interaction, F1P affinity and F6P affinity (Figs 1A and 2A–C). Consistent with previous observations (3), the presence of the p.P446L variant in cis with rare variants augmented functional defects, most notably by decreasing nuclear localization and protein levels (Fig. 1B; Supplementary Material, Fig. S3).
To gauge the performance of mutation prediction algorithms, we compared our empirical findings with results from commonly used algorithms. SIFT human single-nucleotide polymorphisms (SNPs) (12) (6 of 11 correct predictions), PolyPhen-2 (13) (7 of 11) and Condel (14) (3 of 11) all performed relatively poorly on this data set (Table 1). The consequence of poor in silico prediction on gene-based association tests was apparent when we investigated the clinical phenotypes of GCKR variant carriers classified according to in vitro or in silico dysfunction (Tables 1 and 2). Individuals with in vitro deleterious GCKR variants were observed at higher frequency in hypertriglyceridemia cases compared with controls (4.1 versus 1.2%, P = 0.03, two-tailed Fisher's exact test; Table 2). When this analysis was repeated using in silico prediction as a variant classifier, only PolyPhen-2 predicted that deleterious GCKR variants were associated with hypertriglyceridemia. However, PolyPhen-2 results led to underestimation in the frequency of deleterious GCKR variants in cases (2.3%). Additionally, when considering only GCKR missense variants—those for which accurate in silico predictions are most necessary—the association between PolyPhen-2 predictions and hypertriglyceridemia was weakened (P = 0.14).
Table 1.
Comparison of functional defects with bioinformatic predictions of human missense variant severity
| Amino acid substitution | SIFT Human SNPs | PolyPhen-2 | Condel | Functional defect(s) (Prot, GCK, F1P, F6P) | Overall functional assessment | Agreement |
|---|---|---|---|---|---|---|
| p.L37Q | Damaging | Probably damaging | Deleterious | XX-X | Damaging | All |
| p.R51G | Tolerated | Possibly damaging | Neutral | -XXX | Damaging | P |
| p.R51Q | Tolerated | Benign | Neutral | ---- | Benign | All |
| p.E77G | Damaging | Benign | Neutral | -X-X | Damaging | S |
| p.G129R | Damaging | Probably damaging | Neutral | XXXX | Damaging | S, P |
| p.R227Q | Tolerated | Probably damaging | Neutral | ---- | Benign | S, C |
| p.Q234P | Tolerated | Benign | Neutral | XXXX | Damaging | None |
| p.R259W | Damaging | Probably damaging | Neutral | --XX | Damaging | S, P |
| p.M344I | Tolerated | Benign | Neutral | --X- | Damaging | None |
| p.D414E | Tolerated | Possibly damaging | Neutral | -X-- | Damaging | P |
| p.H438Y | Tolerated | Probably damaging | Neutral | XXX- | Damaging | P |
| p.A519T | Damaging | Probably damaging | Deleterious | N/A | N/A | N/A |
GCKR (RefSeq NM_001486.3) variants were assessed using the SIFT Human SNPs, PolyPhen-2 version 2.2.2 and Condel webserver algorithms. Functional defect(s) indicate similarity to (−) or significant differences from (X) WT-GKRP in Figure 1A and Figure 2A–C. Functional assessment was assigned as ‘Benign’ for variants showing WT-like cellular and kinetic properties and ‘Damaging’ for variants with cellular and/or kinetic defects. Prot, protein expression assay; GCK, HTRF GKRP–GCK interaction assay; F1P, F1P thermophoresis assay; F6P, F6P thermophoresis assay; S, SIFT Human SNPs; P, PolyPhen-2; C, Condel. N/A, variant not assessed for functional properties because it travelled in cis with the upstream frameshift variant p.S183CfsX34.
Table 2.
Phenotypic and functional classification of GCKR rare variant carriers
| HTG cases |
Controls |
|||
|---|---|---|---|---|
| GCKR WT | 419 | 327 | ||
| GCKR rare variant carriers | 19 | 5 | ||
| Functional classes | Deleterious | WT-like | Deleterious | WT-like |
| In vitro, observed | 18 | 1 | 4 | 1 |
| SIFT, predicteda | 8 | 10 | 1 | 4 |
| PolyPhen-2, predicteda | 10 | 8 | 1 | 4 |
| Condel, predicteda | 7 | 11 | 1 | 4 |
Clinical analysis was restricted to individuals of self-described European ancestry from the hypertriglyceridemia (HTG) sequencing cohort described previously (8). Individuals were first classified according to GCKR variant status (GCKR WT, individuals with no rare GCKR variants; GCKR rare variant carriers, individuals carrying one or more GCKR rare variant). GCKR rare variant carriers in cases and controls were further subdivided according to either observed in vitro dysfunction or predicted in silico dysfunction.
aExcludes variant R6_F7dup.
As our functional results supported the collective phenotypic relevance of rare GCKR variants that influence protein function, we aimed to address on an individual basis whether functional rare variants segregated with a hypertriglyceridemic phenotype by investigating their inheritance within families. Analysis of co-segregation of some rare variants with triglycerides in pedigrees could not be performed for various reasons, including the decision to decline participation and loss of individuals to follow-up. Ultimately, 16 of 24 original probands were available for follow-up, and an additional 25 family members were recruited across 12 of these probands. Rare variant and p.P446L status were determined by sequencing. In line with sample ascertainment, GCKR rare variant carriers had higher triglyceride and total cholesterol levels than non-carriers. However, newly ascertained variant carriers did not have significantly different triglyceride levels to newly ascertained non-carriers (1.8 ± 0.9 and 2.0 ± 1.4 mmol/l, respectively; mean ± SD; Fig. 4; Supplementary Material, Table S4). Although sufficient information was not available to draw decisive conclusions for every pedigree (e.g. p.M344I), GCKR variants generally did not co-segregate with raised triglyceride levels (Supplementary Material, Fig. S4). Individuals were also genotyped for the 10 common variants most strongly associated with plasma triglyceride levels from the Global Lipids Genetics Consortium to create both weighted and non-weighted genotype risk scores (15). Individuals with hypertriglyceridemia have been shown to have a significantly increased score (16). However, common variant burden scores performed no better than GCKR variant status in predicting triglyceride levels in this family-based data set (Supplementary Material, Fig. S4 and Table S4).
Figure 4.

Phenotypic characteristics of GCKR rare variant carriers and non-carriers. Black circles, previously acquired carriers; white circles, newly acquired carriers; solid line, mean of previously acquired carriers; dotted line, mean of newly acquired carriers; black triangles, previously acquired non-carriers; white triangles, newly acquired non-carriers; dashed line, mean of non-carriers. P-values were calculated using unpaired t-tests assuming unequal variances between groups.
DISCUSSION
Two major related challenges in the characterization of rare variants in complex disease are defining their functional effects and establishing their phenotypic consequences. GCKR serves as a useful model for the investigation of both of these issues. We utilized several reproducible and sensitive assays, both biochemical and cell biological, to investigate the effects of non-synonymous GCKR variants first identified in individuals with hypertriglyceridemia, including novel assays to measure variants simultaneously in a high-throughput manner (Fig. 2; Supplementary Material, Fig. S1), which provided a highly sensitive platform to compare the effects of different variants. Notably, functional results often did not agree with computational prediction algorithms; the use of in silico predictions alone would have resulted in a dramatically different interpretation of the role of GCKR variants in hypertriglyceridemia (Tables 1 and 2). Our results demonstrated a modest association between GCKR variants with in vitro dysfunction and hypertriglyceridemia (Table 2). However, currently, most large-scale sequencing or genotyping studies rely upon mutation prediction algorithms to assign functionality to non-synonymous variants. Consistent with emerging results from other comprehensive functional studies (2,3), three of the most commonly used prediction algorithms performed relatively poorly on this subset of GCKR variants (Table 1). Interestingly, the program with lowest accuracy, Condel, combines predictions across multiple algorithms, which some observers have suggested will increase accuracy (14). No algorithm performed appreciably better for the most deleterious variants, as some of the most functionally impaired variants across individual (e.g. p.M344I in phosphate ester assays) or all (e.g. p.Q234P) assays were not reliably predicted.
The comprehensive functional data available for GCKR, in combination with robust genetic data, also facilitated detailed phenotypic investigation. Associations with plasma triglyceride levels have been observed for the common p.P446L non-synonymous variant (7,17), and through collective analysis of functionally characterized rare variants in sample sets with both largely random (3) and highly selected ascertainment (Fig. 4 and Supplementary Material, Table S4). However, despite evidence that the variants tested are functionally and phenotypically relevant, rare variants showed little evidence of co-segregation with triglyceride levels within families (Supplementary Material, Fig. S4). Moreover, genotype risk scores for common variants influencing triglyceride levels did not clarify these discrepancies (Supplementary Material, Fig. S4 and Table S4). Therefore, in contrast to classical family-based studies in monogenic diseases, we found no evidence that functional GCKR rare variants have deterministic effects on plasma triglycerides in individuals and families, and their value as predictors of triglyceride levels in individuals in this data set is minimal.
The modest effect of GCKR variants on triglyceride levels in family members may also be relevant to the current controversy surrounding the potential effects of pharmacological GCK activation. GCK activators (GKAs) are currently in clinical trials as a potential treatment for Type 2 diabetes; however, these molecules may reduce plasma glucose concentrations at the expense of increased hepatic triglyceride biosynthesis (18–20). Although recent findings in rodent models and clinical trials suggest that GKA treatment may increase triglyceride levels, unfavorable lipid profiles have not been observed in individuals with activating GCK mutations (21–24). Our results suggest that indirect activation of hepatic GCK via loss-of-function GCKR mutations does not consistently lead to a hyperlipidemic phenotype, and are particularly relevant to the recent report of a selective small-molecule inhibitor of GKRP, which was shown to disrupt the GCK–GKRP interaction in vivo and reduced blood glucose levels in mouse models of obesity without apparent adverse effects on triglyceride levels (25). Continued exploration of the combination of genetic and clinical data with highly sensitive biochemical, cell-biological and animal model systems may provide further insight into the effects of pharmacological and genetic modulation of GKRP (25–27).
Collectively, our observations emphasize a complex inheritance pattern for plasma triglycerides, suggesting that other rare genetic and/or environmental factors may mitigate genetic load in particular individuals. Accordingly, while GCKR variation is associated with alterations in triglyceride levels, such variants are neither necessary nor sufficient to cause hypertriglyceridemia. Therefore, analysis of large numbers of carriers of individual rare variants may be required to ascertain the phenotypic effects of such variants, either through collection of extended pedigrees for private variants or through a combination of large-scale sequencing and/or segregation analyses for rare but non-unique variants. These results highlight the difficulty in translating findings arising from sequencing studies to phenotypic information on an individual level, even when molecular function can be determined for individual variants and additional variant carriers identified through family-based studies. As many rare variants discovered in future studies are likely to be novel, such challenges will only become more pronounced, particularly in light of the current reliance on in silico prediction algorithms and questions about their reliability. Studies of rare variants in other genes and complex traits should reveal the generalizability of this phenomenon.
MATERIALS AND METHODS
Ethical statement
Study subjects were unrelated hypertriglyceridemic probands determined to be heterozygous carriers of GCKR (RefSeq NM_001486.3) mutations by sequencing (8). Families were then extended for further assessments, including co-segregation of GCKR mutations with plasma triglyceride phenotype. The protocol was approved by the University of Western Ontario Health Sciences Research Ethics Board (protocol 07920E).
Clinical and laboratory analyses
All study subjects had a complete medical history and physical examination was performed by the same clinician. Fasting plasma was drawn for the determination of concentrations of plasma lipids, lipoproteins and apolipoproteins, and for secondary causes of dyslipidemia. DNA was isolated from peripheral blood leucocytes, and the GCKR gene was sequenced using reagents and conditions as previously reported (8). For comparisons of clinical phenotypes, P-values were calculated using unpaired t-tests assuming unequal variances between groups. Unweighted polygenic risk score for hypertriglyceridemia was determined by tallying the number of triglyceride-raising alleles (0, 1 or 2) from genotypes of the top 10 triglyceride-associated SNPs from the Global Lipids Genetics Consortium (GLGC) (15), namely: APOA5 rs964184, GCKR rs1260326, LPL rs12678919, MLXIPL rs7811265, TRIB1 rs2954029, APOB rs1042034, ANGPTL3 rs2131925, APOE rs439401, CILP2 rs10401969 and FADS1-2-3 rs174546. The weighted polygenic risk score was determined by multiplying the allele score (0, 1 or 2) at each of the top 10 loci by the respective beta-coefficient for triglyceride—raising from GLGC (15) at the associated locus, and then summing these. SAS version 9.3 (SAS Institute, Cary, NC, USA) was used for all statistical analyses.
Cloning of GCKR and GCK fusion plasmids
Fluorescent fusion plasmids
Generation of human enhanced cyan fluorescent protein (ECFP)-tagged GCK and enhanced yellow fluorescent protein (EYFP)-tagged GCKR has been described previously (10,28).
Affinity tag fusion plasmids
Generation of GST-tagged GCK and FLAG-tagged GCKR bacterial expression vectors has been described previously (9,29). Myc-DDK-tagged GCKR in the pCMV6 mammalian expression vector was obtained from Origene (Cedarlane Laboratories).
Mutagenesis
GCKR mutations were introduced via site-directed mutagenesis using the Stratagene QuikChange II, QuikChange II XL or QuikChange Lightning kit (Agilent Biotechnologies) according to the manufacturer's instructions. All plasmid sequences were verified by sequencing. All primers were obtained from Integrated DNA Technologies or Eurofins Genetic Services Ltd. Primer sequences are available upon request.
Cell culture and transfection
For analysis of protein expression levels via western blotting, COS-7 cells were cultured in Dulbecco's Modified Eagle's Medium containing 50 units/ml penicillin and 50 µg/ml streptomycin, supplemented with 10% fetal bovine serum and maintained at 37°C/5% CO2. Cells were seeded at a density of 6 × 10⁵ per 60 mm dish the day before transfection. One microgram WT or variant GCKR plasmid DNA was transfected using Effectene Transfection Reagent and Enhancer (Qiagen) as per the manufacturer's instructions.
Mouse hepatocytes and HeLa cells were isolated, cultured and transfected with ECFP-GCK and EYFP-GKRP expression plasmids as described previously (28).
Western blot analysis
Forty-eight hours post-transfection, cells were washed twice with PBS and lysed in sodium dodecyl sulfate (SDS) buffer (50 mm Tris–Cl pH 6.8, 2% SDS, 10% glycerol) that had been preheated at 95°C for 5 min. Samples were then incubated at 95°C for 5 min. Protein concentrations of whole cell lysates were determined using the DC Protein Assay kit (Bio-Rad). Lysates were supplemented with 50 mm Tris–Cl pH 6.8, 100 mm DTT, 2% SDS, 0.1% Bromophenol blue and 10% glycerol and heated to 95°C for 5 min before separation on a 4–12% gradient SDS–PAGE gel (Invitrogen). Samples were then transferred onto PVDF (Invitrogen) in a Bio-Rad transfer module. Blocking and hybridization were performed with anti-Myc monoclonal antibody (1:1000 dilution) or anti-DDK monoclonal antibody (1 : 2000 dilution, both from Origene Technologies) overnight. Signals were visualized using the SuperSignal West Pico Chemiluminescent Substrate kit (Pierce Biotechnology). Membranes were washed with Tris-buffered saline containing 0.1% Tween-20, stripped with stripping buffer (25 mm glycine, 1% SDS, pH 2.0) and hybridized to anti-tubulin antibody (1:25 000 dilution, Sigma-Aldrich), which was used as a loading control. For each variant and WT GCKR clone, the amount of Myc-DDK-tagged protein was measured and normalized to alpha-tubulin via densitometry. All normalized variant expression values were compared with WT GKRP as the reference standard using an unpaired (two-tailed) t-test.
Fluorescence microscopy and image analysis
FRET experiments and calculation of GCK and GKRP nuclear: cytoplasmic ratios in primary mouse hepatocytes and HeLa cells were performed as described previously (28). Statistical analyses were performed by analysis of variance (ANOVA) followed by Bonferroni's test for multiple comparison.
Functional characterization
Protein production and purification
Recombinant GST-tagged GCK and WT and variant FLAG-tagged GKRP proteins were prepared as described previously (9,29).
HTRF assays
HTRF technology was utilized for antibody-based FRET measurements of cell-free protein–protein interactions between GCK and WT or variant GKRP. Recombinant human GST-tagged GCK and WT or variant FLAG-tagged GKRP were mixed in an assay buffer (2 mm MgCl2, 25 mm KCl, 25 mm HEPES pH 7.1, 1 mm DTT, 0.025% BSA) identical to that used for kinetic assays (see below), with the exclusion of GCK substrates and coupling components and addition of 0.1% Tween-20. F1P or F6P was tested in an 11-point titration (half-log serial dilutions) with a maximum concentration of 3.16 mm or 1.39 mm, respectively. The reaction mixture was dispensed (3.5 µl/well) using an Aurora Discovery BioRAPTR Flying Reagent Dispenser (BioRAPTR; Beckman Coulter, Inc.) (30) into white 1536-well solid-bottom medium binding plates (Greiner Bio-One). Anti-FLAG XL 665 FRET acceptor- and anti-GST K FRET donor-conjugated antibodies (Cisbio Bioassays) were diluted to 4.8 ng/µl and 0.648 ng/µl, respectively, in a reconstitution buffer (1.6 m KF and 100 mm sodium phosphate, pH 7.0; both Sigma-Aldrich), and added to the plate using a BioRAPTR (0.5 µl/well). Negative control wells included all assay components except GKRP. Plates were lidded and incubated for 60 min at room temperature before being read on an Envision 2104 Multilabel Plate Reader (PerkinElmer) with an excitation at 320 nm and dual-wavelength detection at the FRET donor wavelength (615 nm) and FRET acceptor wavelength (665 nm). Statistical analyses were performed by ANOVA followed by Bonferroni's test for multiple comparison.
MST measurements
Binding kinetics of F1P and F6P to WT and variant FLAG-tagged GKRP were measured by MST in a NanoTemperMonolith NT.115 LabelFree instrument (NanoTemper Technologies). MST detects changes in size, charge and/or solvation induced by binding by measurement of intrinsic protein fluorescence (31). MST experiments were carried out in an HTRF assay buffer excluding BSA, with a final concentration of 250 nm WT or variant GKRP and F1P or F6P in 16-point two-fold serial dilution with maximum concentrations of 1 mm or 0.2 mm, respectively. Proteins were loaded into Standard Treated NT.LabelFree Capillaries (NanoTemper Technologies) and MST was measured using 15% LED power and 40% MST laser power.
Kinetic characterization
GKRP inhibition of GCK activity was determined spectrophotometrically using glucose-6-phosphate dehydrogenase-linked assays as described previously (9). F1P and F6P assays (0–500 µm) were also performed as described previously (9). F1P was purchased from Santa Cruz Biotechnology and F6P from Sigma-Aldrich. Statistical analyses were performed using Student's t-test.
Variant classification
Variants were classified as ‘WT-like’, ‘Mild’ or ‘Severe’ based on their relative interaction strength with GCK via HTRF, and F1P and F6P via MST. The cut-offs for classification in each category are given in Supplementary Material, Table S2. A variant's overall classification took into account its cumulative performance in all three categories according to the following: ‘WT-like’, WT-like in all three categories; ‘Mild’, mild in at least one category and either WT-like or Mild in the other two; ‘Severe’, severe in at least one category.
Graphical analyses and nonlinear regression
Nonlinear regression was utilized to generate dose–response curves for F1P and F6P using GraphPad Prism (GraphPad Software, San Diego, CA, USA). Thermophoresis was measured after the temperature jump using the ‘Thermophoresis, no jump’ option in the MST software (31). Modulator concentrations were converted to logarithmic values and the log(agonist) versus response (three parameters) or log(inhibitor) versus response (three parameters) options utilized to fit curves and determine the half-maximal effective concentration (EC50) or half-maximal inhibitory concentration (IC50).
Structural modeling
Variants were mapped onto the crystal structure of human GKRP bound to F1P (Protein DataBank entry 4BB9) using PyMOL v.0.99.
SUPPLEMENTARY MATERIAL
FUNDING
This work was supported in Oxford by the Wellcome Trust (grant number 095101/Z/10/Z); in Canada by operating grants to RAH from the Heart and Stroke Foundation of Canada (grant number T6606) and the Canadian Institutes for Health Research (grant numbers MOP13430, MOP79533); in Rostock by the German Diabetes Association (DDG); and at NIH by the Molecular Libraries Common Fund Program of the National Institutes of Health and grant number Z01 HG000024/HG/NHGRI NIH HHS/United States to FSC. Funding to pay the Open Access publication charges for this article was provided by the Wellcome Trust.
Supplementary Material
ACKNOWLEDGEMENTS
The authors thank all of the families who participated in this study and Dr. Juris Galvanovskis for microscopy assistance. A.L.G. is a Wellcome Trust Senior Fellow in Basic Biomedical Science.
Conflict of Interest statement. None declared.
REFERENCES
- 1.Palotie A., Widen E., Ripatti S. From genetic discovery to future personalized health research. Nat. Biotechnol. 2013;30:291–295. doi: 10.1016/j.nbt.2012.11.013. [DOI] [PMC free article] [PubMed] [Google Scholar]
- 2.Bonnefond A., Clement N., Fawcett K., Yengo L., Vaillant E., Guillaume J.L., Dechaume A., Payne F., Roussel R., Czernichow S., et al. Rare MTNR1B variants impairing melatonin receptor 1B function contribute to type 2 diabetes. Nat. Genet. 2012;44:297–301. doi: 10.1038/ng.1053. [DOI] [PMC free article] [PubMed] [Google Scholar]
- 3.Rees M.G., Ng D., Ruppert S., Turner C., Beer N.L., Swift A.J., Morken M.A., Below J.E., Blech I., Mullikin J.C., et al. Correlation of rare coding variants in the gene encoding human glucokinase regulatory protein with phenotypic, cellular, and kinetic outcomes. J. Clin. Invest. 2012;122:205–217. doi: 10.1172/JCI46425. [DOI] [PMC free article] [PubMed] [Google Scholar]
- 4.Kiezun A., Garimella K., Do R., Stitziel N.O., Neale B.M., McLaren P.J., Gupta N., Sklar P., Sullivan P.F., Moran J.L., et al. Exome sequencing and the genetic basis of complex traits. Nat. Genet. 2012;44:623–630. doi: 10.1038/ng.2303. [DOI] [PMC free article] [PubMed] [Google Scholar]
- 5.Flanagan S.E., Patch A.M., Ellard S. Using SIFT and PolyPhen to predict loss-of-function and gain-of-function mutations. Genet. Test. Mol. Biomarkers. 2010;14:533–537. doi: 10.1089/gtmb.2010.0036. [DOI] [PubMed] [Google Scholar]
- 6.Hunt S.C., Hasstedt S.J., Kuida H., Stults B.M., Hopkins P.N., Williams R.R. Genetic heritability and common environmental components of resting and stressed blood pressures, lipids, and body mass index in Utah pedigrees and twins. Am. J. Epidemiol. 1989;129:625–638. doi: 10.1093/oxfordjournals.aje.a115175. [DOI] [PubMed] [Google Scholar]
- 7.Saxena R., Voight B.F., Lyssenko V., Burtt N.P., de Bakker P.I., Chen H., Roix J.J., Kathiresan S., Hirschhorn J.N., Daly M.J., et al. Genome-wide association analysis identifies loci for type 2 diabetes and triglyceride levels. Science. 2007;316:1331–1336. doi: 10.1126/science.1142358. [DOI] [PubMed] [Google Scholar]
- 8.Johansen C.T., Wang J., Lanktree M.B., Cao H., McIntyre A.D., Ban M.R., Martins R.A., Kennedy B.A., Hassell R.G., Visser M.E., et al. Excess of rare variants in genes identified by genome-wide association study of hypertriglyceridemia. Nat. Genet. 2010;42:684–687. doi: 10.1038/ng.628. [DOI] [PMC free article] [PubMed] [Google Scholar]
- 9.Beer N.L., Tribble N.D., McCulloch L.J., Roos C., Johnson P.R., Orho-Melander M., Gloyn A.L. The P446L variant in GCKR associated with fasting plasma glucose and triglyceride levels exerts its effect through increased glucokinase activity in liver. Hum. Mol. Genet. 2009;18:4081–4088. doi: 10.1093/hmg/ddp357. [DOI] [PMC free article] [PubMed] [Google Scholar]
- 10.Rees M.G., Wincovitch S., Schultz J., Waterstradt R., Beer N.L., Baltrusch S., Collins F.S., Gloyn A.L. Cellular characterisation of the GCKR P446L variant associated with type 2 diabetes risk. Diabetologia. 2012;55:114–122. doi: 10.1007/s00125-011-2348-5. [DOI] [PMC free article] [PubMed] [Google Scholar]
- 11.Pautsch A., Stadler N., Lohle A., Rist W., Berg A., Glocker L., Nar H., Reinert D., Lenter M., Heckel A., et al. Crystal structure of glucokinase regulatory protein. Biochemistry. 2013;52:3523–3531. doi: 10.1021/bi4000782. [DOI] [PubMed] [Google Scholar]
- 12.Ng P.C., Henikoff S. Predicting deleterious amino acid substitutions. Genome Res. 2001;11:863–874. doi: 10.1101/gr.176601. [DOI] [PMC free article] [PubMed] [Google Scholar]
- 13.Adzhubei I.A., Schmidt S., Peshkin L., Ramensky V.E., Gerasimova A., Bork P., Kondrashov A.S., Sunyaev S.R. A method and server for predicting damaging missense mutations. Nat. Methods. 2010;7:248–249. doi: 10.1038/nmeth0410-248. [DOI] [PMC free article] [PubMed] [Google Scholar]
- 14.Gonzalez-Perez A., Lopez-Bigas N. Improving the assessment of the outcome of nonsynonymous SNVs with a consensus deleteriousness score, Condel. Am. J. Hum. Genet. 2011;88:440–449. doi: 10.1016/j.ajhg.2011.03.004. [DOI] [PMC free article] [PubMed] [Google Scholar]
- 15.Teslovich T.M., Musunuru K., Smith A.V., Edmondson A.C., Stylianou I.M., Koseki M., Pirruccello J.P., Ripatti S., Chasman D.I., Willer C.J., et al. Biological, clinical and population relevance of 95 loci for blood lipids. Nature. 2010;466:707–713. doi: 10.1038/nature09270. [DOI] [PMC free article] [PubMed] [Google Scholar]
- 16.Johansen C.T., Wang J., Lanktree M.B., McIntyre A.D., Ban M.R., Martins R.A., Kennedy B.A., Hassell R.G., Visser M.E., Schwartz S.M., et al. An increased burden of common and rare lipid-associated risk alleles contributes to the phenotypic spectrum of hypertriglyceridemia. Arterioscler. Thromb. Vasc. Biol. 2011;31:1916–1926. doi: 10.1161/ATVBAHA.111.226365. [DOI] [PMC free article] [PubMed] [Google Scholar]
- 17.Orho-Melander M., Melander O., Guiducci C., Perez-Martinez P., Corella D., Roos C., Tewhey R., Rieder M.J., Hall J., Abecasis G., et al. Common missense variant in the glucokinase regulatory protein gene is associated with increased plasma triglyceride and C-reactive protein but lower fasting glucose concentrations. Diabetes. 2008;57:3112–3121. doi: 10.2337/db08-0516. [DOI] [PMC free article] [PubMed] [Google Scholar]
- 18.Matschinsky F.M. Assessing the potential of glucokinase activators in diabetes therapy. Nat. Rev. Drug Discov. 2009;8:399–416. doi: 10.1038/nrd2850. [DOI] [PubMed] [Google Scholar]
- 19.Nissim I., Horyn O., Daikhin Y., Wehrli S.L., Yudkoff M., Matschinsky F.M. Effects of a glucokinase activator on hepatic intermediary metabolism: study with (13)C-isotopomer-based metabolomics. Biochem. J. 2012;444:537–551. doi: 10.1042/BJ20120163. [DOI] [PMC free article] [PubMed] [Google Scholar]
- 20.Rees M.G., Gloyn A.L. Small molecular glucokinase activators: has another new anti-diabetic therapeutic lost favour? Br. J. Pharmacol. 2013;168:335–338. doi: 10.1111/j.1476-5381.2012.02201.x. [DOI] [PMC free article] [PubMed] [Google Scholar]
- 21.De Ceuninck F., Kargar C., Ilic C., Caliez A., Rolin J.O., Umbdenstock T., Vinson C., Combettes M., de Fanti B., Harley E., et al. Small molecule glucokinase activators disturb lipid homeostasis and induce fatty liver in rodents: a warning for therapeutic applications in humans. Br. J. Pharmacol. 2013;168:339–353. doi: 10.1111/j.1476-5381.2012.02184.x. [DOI] [PMC free article] [PubMed] [Google Scholar]
- 22.Meininger G.E., Scott R., Alba M., Shentu Y., Luo E., Amin H., Davies M.J., Kaufman K.D., Goldstein B.J. Effects of MK-0941, a novel glucokinase activator, on glycemic control in insulin-treated patients with type 2 diabetes. Diabetes Care. 2011;34:2560–2566. doi: 10.2337/dc11-1200. [DOI] [PMC free article] [PubMed] [Google Scholar]
- 23.Christesen H.B., Jacobsen B.B., Odili S., Buettger C., Cuesta-Munoz A., Hansen T., Brusgaard K., Massa O., Magnuson M.A., Shiota C., et al. The second activating glucokinase mutation (A456 V): implications for glucose homeostasis and diabetes therapy. Diabetes. 2002;51:1240–1246. doi: 10.2337/diabetes.51.4.1240. [DOI] [PubMed] [Google Scholar]
- 24.Gloyn A.L., Noordam K., Willemsen M.A., Ellard S., Lam W.W., Campbell I.W., Midgley P., Shiota C., Buettger C., Magnuson M.A., et al. Insights into the biochemical and genetic basis of glucokinase activation from naturally occurring hypoglycemia mutations. Diabetes. 2003;52:2433–2440. doi: 10.2337/diabetes.52.9.2433. [DOI] [PubMed] [Google Scholar]
- 25.Lloyd D.J., St Jean D.J., Jr., Kurzeja R.J., Wahl R.C., Michelsen K., Cupples R., Chen M., Wu J., Sivits G., Helmering J., et al. Antidiabetic effects of glucokinase regulatory protein small-molecule disruptors. Nature. 2013;504:437–440. doi: 10.1038/nature12724. [DOI] [PubMed] [Google Scholar]
- 26.Kaminski M.T., Schultz J., Waterstradt R., Tiedge M., Lenzen S., Baltrusch S. Glucose-induced dissociation of glucokinase from its regulatory protein in the nucleus of hepatocytes prior to nuclear export. Biochim. Biophys. Acta. 2013;1843:554–564. doi: 10.1016/j.bbamcr.2013.12.002. [DOI] [PubMed] [Google Scholar]
- 27.Rees M.G., Davis M.I., Shen M., Titus S., Raimondo A., Barrett A., Gloyn A.L., Collins F.S., Simeonov A. A Panel of Diverse Assays to Interrogate the Interaction between Glucokinase and Glucokinase Regulatory Protein, Two Vital Proteins in Human Disease. PLoS One. 2014;9:e89335. doi: 10.1371/journal.pone.0089335. [DOI] [PMC free article] [PubMed] [Google Scholar]
- 28.Baltrusch S., Francini F., Lenzen S., Tiedge M. Interaction of glucokinase with the liver regulatory protein is conferred by leucine–asparagine motifs of the enzyme. Diabetes. 2005;54:2829–2837. doi: 10.2337/diabetes.54.10.2829. [DOI] [PubMed] [Google Scholar]
- 29.Liang Y., Kesavan P., Wang L.Q., Niswender K., Tanizawa Y., Permutt M.A., Magnuson M.A., Matschinsky F.M. Variable effects of maturity-onset-diabetes-of-youth (MODY)-associated glucokinase mutations on substrate interactions and stability of the enzyme. Biochem. J. 1995;309(Pt 1):167–173. doi: 10.1042/bj3090167. [DOI] [PMC free article] [PubMed] [Google Scholar]
- 30.Niles W.D., Coassin P.J. Piezo- and solenoid valve-based liquid dispensing for miniaturized assays. Assay Drug Dev. Technol. 2005;3:189–202. doi: 10.1089/adt.2005.3.189. [DOI] [PubMed] [Google Scholar]
- 31.Seidel S.A., Wienken C.J., Geissler S., Jerabek-Willemsen M., Duhr S., Reiter A., Trauner D., Braun D., Baaske P. Label-free microscale thermophoresis discriminates sites and affinity of protein-ligand binding. Angew. Chem. Int. Ed. Engl. 2012;51:10656–10659. doi: 10.1002/anie.201204268. [DOI] [PMC free article] [PubMed] [Google Scholar]
Associated Data
This section collects any data citations, data availability statements, or supplementary materials included in this article.