Abstract
Purpose
The purpose of this study is to evaluate the functional and morphological changes in subretinal xenografts of human retinal progenitor cells (hRPCs) in B6 mice treated with Cyclosporin A (CsA; 210 mg/l in drinking water).
Methods
The hRPCs from human fetal eyes were isolated and expanded for transplantation. These cells, with green fluorescent protein (GFP) at 11 passages, were transplanted into the subretinal space in B6 mice. A combination of invasive and noninvasive approaches was used to analyze the structural and functional consequences of the subretinal injection of the hRPCs. The process of change was monitored using spectral domain optical coherence tomography (SDOCT), histology, and electroretinography (ERG) at 3 days, 1 week, and 3 weeks after transplantation. Cell counts were used to evaluate the survival rate with a confocal microscope. ERGs were performed to evaluate the physiologic changes, and the structural changes were evaluated using SDOCT and histological examination.
Results
The results of the histological examination showed that the hRPCs gained a better survival rate in the mice treated with CsA. The SDOCT showed that the bleb size of the retinal detachment was significantly decreased, and the retinal reattachment was nearly complete by 3 weeks. The ERG response amplitudes in the CsA group were less decreased after the injection, when compared with the control group, in the dark-adapted and light-adapted conditions. However, the cone-mediated function in both groups was less affected by the transplantation after 3 weeks than the rod-mediated function.
Conclusions
Although significant functional and structural recovery was observed after the subretinal injection of the hRPCs, the effectiveness of CsA in xenotransplantation may be a novel and potential approach for increasing retinal progenitor cell survival.
Introduction
Retinal degeneration, such as retinitis pigmentosa (RP) and age-related macular degeneration (AMD), either inherited or age related, is the most common and irreversible end point for the degeneration of photoreceptors [1]. Stem cell (SC)-based therapy is now widely considered to be a potential therapeutic approach, providing the opportunity to repair and replace non-functioning neuroretinal cells [2-4]. Several types of SCs are currently being used within this field of study, including retinal progenitor cells (RPCs) [5], embryonic stem cells (ESCs) [6], induced pluripotent stem cells (iPSCs) [7], mesenchymal stem cells (MSCs) [8], and very small embryonic-like (VSEL) stem cells [9].
The donor SCs modulate cell survival by producing various neurotropic factors that contribute to implementing the cell replacement strategy. However, the environment surrounding the recipient adult retina plays an important role in inhibiting retinal progenitor cell integration and differentiation. Immunorejection is still a major problem in transplantation. Although the eye is frequently regarded as an immunoprivileged site, containing the anterior chamber, vitreous cavity, and subretinal space, the eye should actually be viewed as a partially immunoprivileged site, since it appears to show the rejection of cells delivered by transplantation in the subretinal space over the long term [10]. Therefore, classic immunosuppressive drug therapies, or alternatives, could be used to enhance and prolong transplanted cell survival [11].
Cyclosporin A (CsA) has recently assumed the position as one of the most frequently used immunosuppressive drugs to prevent rejection in transplant surgery, dramatically improving patients’ prognosis. CsA has been widely used by ophthalmologists, systematically and locally, for various indications in ocular disease [12]. These uses include corneal graft rejection, autoimmune eye conditions, and dry eye syndrome. Although this technique is widely used, it is poorly understood [13,14].
The primary purpose of our study was to investigate the effectiveness of CsA in modulating functional and structural responses to hRPCs in B6 mice, which will lay the groundwork for the further study of different genotypes of rhodopsin mice. Additionally, we will explore the survival rate of hRPCs after 3 weeks in these mice.
Methods
Recipient animals
C57BL/6J mice (Jackson Laboratory, Bar Harbor, ME) at 4–5 weeks of age were prepared in a 12 h:12 h light-dark cycle room, and provided with standard water and food. The mice were divided into two groups: mice treated with CsA (210 mg/l; n = 45) and mice without CsA (n = 55). The animals in each group were euthanized by CO2 inhalation, and their eyes were surgically enucleated at different time points after the subretinal injection of hRPCs: day 0 (n = 10), day 3 (n = 15), week 1 (n = 15), and week 3 (n = 15). Histological evaluations (histology, optical coherence tomography [OCT]) and functional changes (electroretinography [ERG]) at each time point were recorded to monitor the changes after the transplantation of the hRPCs. All experimental procedures were in accordance with the guidelines defined by the ARVO Statement for the Use of Animals in Ophthalmic and Vision Research, and all experimental protocols were approved by the Animal Care and Use Committee of the Schepens Eye Research Institute.
Drug preparation
A stock solution of CsA (21 g/l) was diluted in drinking water to make a 210 mg/l solution [15-17]. This medication was administered at the beginning of day 1, before the injections, and was maintained throughout the duration of the study (water bottles were replaced every 3 days to maintain the drug concentration). To ensure the appropriate and healthy state of the mice, the animals were visually inspected (behavior and skin) and weighed at the beginning and every day during the entire process of the study.
Cell isolation and culture
The hRPCs were harvested from the neuroretinas of human fetal eyes (14–18 weeks gestational age; GA) as previously described [18,19]: the neuro-retinas were dissected from each eye and minced into small pieces; then the tissue was dissociated enzymatically using collagenase (0.1%; Sigma-Aldrich, St. Louis, MO) by gently stirring at 300 ×g for 20 min using magnetic stirring bar. The supernatant containing the dissociated cells was transferred, and the same isolation for the remaining undissociated tissue was repeated for a total of four cycles. Finally, the released cells were collected, centrifuged at 300 ×g, and resuspended in Ultraculture medium (Lonza, Basel, Switzerland), supplemented with 20 ng/ml epidermal growth factor (EGF; Sigma-Aldrich), 20 ng/ml basic fibroblastic growth factor (bFGF; Invitrogen, Carlsbad, CA), 2 mM L-glutamine (Invitrogen), 50 g/ml gentamicin (Invitrogen). The cells were fed by replacing half the volume with fresh media every other day, and were passaged when they achieved 70–85% confluence. Then, the cells went through the following process: They were washed with Hanks-Balanced Salt Solution (HBSS; Invitrogen), dissociated with 0.25% trypsin (Sigma-Aldrich), inhibited by defined trypsin inhibitor (Invitrogen), centrifuged at 300 ×g for 5 min, and plated in new fibronectin-coated flasks. At 11 passages, the cells were used for transplantation.
Retroviral vector transduction
At passage 6 hRPC were transfected with GFP, under the control of EF1a promoter to achieve stable expression (Gentarget Inc., San Diego, CA). For transfection 1,5 million cells were plated in a T75 flask, and 24 h later medium was replaced with 5 ml of warm medium containing lentiviral particles (2x10⁶ IFU total, MOI ≈ 1.2) and 2.5 μg/ml polybrene. 24 h later cells were washed, re-plated and GFP-expressing cells were selected by Puromycin (3 μg/ml, Sigma-Aldrich) to establish a stable expressing cell line. Cells were expanded to passage 11 for transplantation.
Subretinal transplantation
The recipient B6 mice were anesthetized with an intraperitoneal injection of ketamine (120 mg/kg) and xylazine (20 mg/kg), followed by local anesthetization with 0.5% proparacaine (Accutome, Malvern, PA), and pupillary dilation with 1% tropicamide (Akorn, Lake Forest, IL). A conjunctival incision was made using microscissors to expose the sclera of the eye. Then a small self-sealing sclerotomy was performed with the tip of a 30-gauge needle (BD) cutting tangentially into the subretinal space and then was withdrawn. For this study, fresh hRPCs were prepared as a suspension of retinal cells in a non-toxic excipient, N-acetyl-cysteine (Sigma-Aldrich; HBSS-NAC), at a concentration of 50 million cells per mL (50 k/μl, 97% viability). These cells were GFP (+) cells, suspended in cell injection buffer, consisting of HBSS-NAC with a pH of 7.4. One μl of the HBSS suspension containing the hRPCs (approximately 50,000 cells) was inserted through the sclerotomy in a tangential direction into the subretinal space. This was achieved by using a glass microneedle connected to a 50-μl microsyringe (Hamilton, Reno, NV) via polyethylene tubing. During the entire procedure, a heating pad was used to maintain the temperature of the mice until they recovered. Then they were returned to their normal housing after transplantation.
Tissue preparation and histology
The recipient B6 mice in both groups were euthanized at 0, 3, 7, and 21 days after transplantation. The eyes were enucleated and immersion fixed in 4% paraformaldehyde for 24 h at 4 °C, followed by cryoprotection in 10% and 30% sucrose in a 0.1% phosphate buffer. The eyes were sectioned at 12 μm on a cryostat. Some sections were stained with 4',6-diamidino-2-phenylindole dihydrochloride (DAPI), viewed under fluorescent illumination, and examined with confocal microscopy (Leica SP2, Leica Microsystems GmbH, Wetzlar, Germany).
Optical coherence tomography recordings
The mice were anesthetized with an intraperitoneal injection of a mixture of ketamine (100 mg/kg) and xylazine (20 mg/kg), and were kept warm on a heating pad. The pupils were dilated with topical tropicamide. A rectangular volume scan, focusing on the injection site and the bleb formed by retinal detachment, was applied using a spectral domain optical coherence tomography (SDOCT) system (Bioptigen Spectral Domain Ophthalmic Imaging System; Bioptigen, Durham, NC). A rectangular, or raster volume scan composed of a series of parallel B-scans, served as an annular cross-sectional view around the point of interest in the tissue. Finally, the imaging and data were exported and analyzed.
Electroretinographic recordings
Both groups (CsA and non-CsA) of B6 mice were dark-adapted overnight and anesthetized with a mixture of ketamine and xylazine (100 mg/kg and 20 mg/kg, respectively). After the pupils were dilated with 1% tropicamide, electroretinographic (ERG) recordings of the B6 mice were obtained (Espion Electroretinography System; Diagnosys LLC, Lowell, MA). One active electrode (a gold wire loop) was placed on the cornea, and then an electrode was placed on the head, to serve as a reference. Another electrode was placed on the back, serving as the ground. The ERG responded to a series of increasing-intensity light flashes presented in a Ganzfeld bowl (UTAS3000; LKC Technologies): 0.1, 1.0, 3.0, and 10.0 dB, which were averaged over ten separate flashes per light intensity. The amplitude of the a-wave was defined as the absolute value from the baseline to the trough of the first negative wave. The amplitude of the b-wave was defined as the absolute value from the trough of the a-wave to the peak of the first positive wave. If the a-wave was absent, the baseline to the peak of the first positive wave was measured. During the entire procedure, the body temperature of the mice was maintained by using a water heating pad.
Cell counting and survival evaluation
Cell counting was performed by counting the total number of cells that remained in the subretinal space of each field in every one in four serial sections through the site of injection in each eye. This was multiplied by the total number of sections that encompassed the injection site to give an estimate of the mean number of integrated cells per eye.
Statistical analysis
The data were expressed as the mean ± standard deviation (SD; n = 15). The Mann–Whitney U test was used to compare the data between the two groups. Statistical significance was defined at p<0.05.
Results
Spectral domain optical coherence tomography
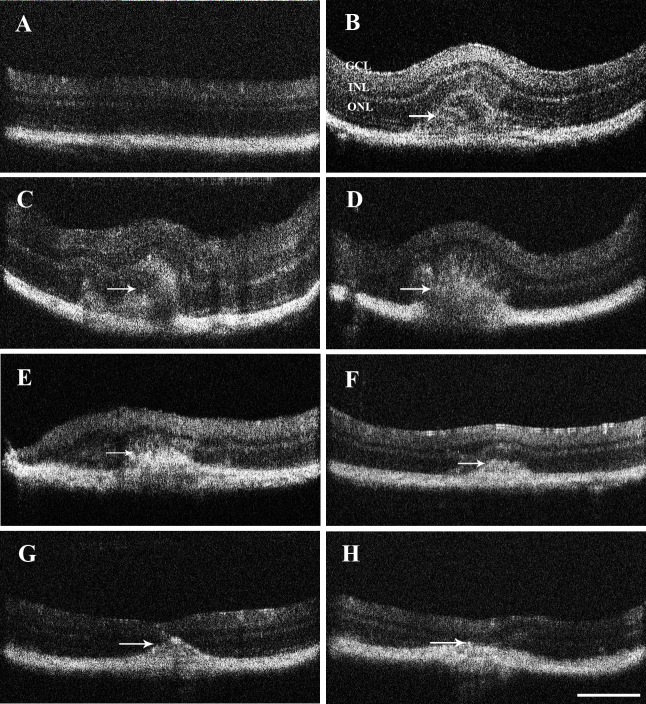
SDOCT serves as noninvasive monitoring of the initial detachment in our study. The subretinal injection of the hRPCs resulted in a local retinal detachment, which could be detected with SDOCT. Figure 1 shows a series of SDOCT images at different points in time before the eyes were sectioned, illustrating the injection site and the retinal bleb of the two groups. Immediately after the cells were injected, a significant bleb was evident in the injected cells visible in the subretinal space (Figure 1B). Three days later, the original bleb decreased for both groups, with no obvious difference (Figure 1C,D). However, 1 week later, the size of the bleb was significantly reduced, although the medium size of the retinal detachment remained (Figure 1E,F). At the 3-week point, most mice showed no obvious evidence of retinal detachment in either group (Figure 1G,H). Among different individuals, the size of the initial bleb and the range of the detachment varied, even with the same surgery process and the same injection parameters (total volume, number of cells, flow rate of injection).
Figure 1.
Cross-sectional spectral domain optical coherence tomography images for two groups of eyes over a time period of 3 weeks. The images before the injection (A; n=10) and immediately after the injection (B; n=10) were followed up by scans at 3 days (C, D; n=30), 1 week (E, F; n=30), and 3 weeks (G, H; n=30). The Cyclosporin A (CsA) group (C, E, G; n=45) and the control group (D, F, H; n=45) showed the same trend in changes in the bleb: A distinct bleb with retinal detachment appeared immediately after cell injection and after 3 days. One week after injection, the initial bleb settled down, but the retinal detachment space was still evident (arrows in E, F). Three weeks after injection, the retina appeared normal without evident retinal detachment (arrows in G, H). The scale bar is 50 μm.
To make comparisons of the SDOCT images before and after injection, retinal thicknesses were measured from the peak of the retinal detachment bleb at the interface with the vitreous body to the basal RPE, including all retinal layers. Measurements at each injection location were made at the same site before and at different time points after injection. The results showed that the total retinal thickness was reduced by an average of 3% by 3 days, 10% by 1 week, and 5% by 3 weeks after injection. Figure 1 shows evidence of the thinning of the nerve fiber layer and the inner plexiform layer in the retinal cross-sectional image of the SDOCT taken at different time points before and after injection.
Histology
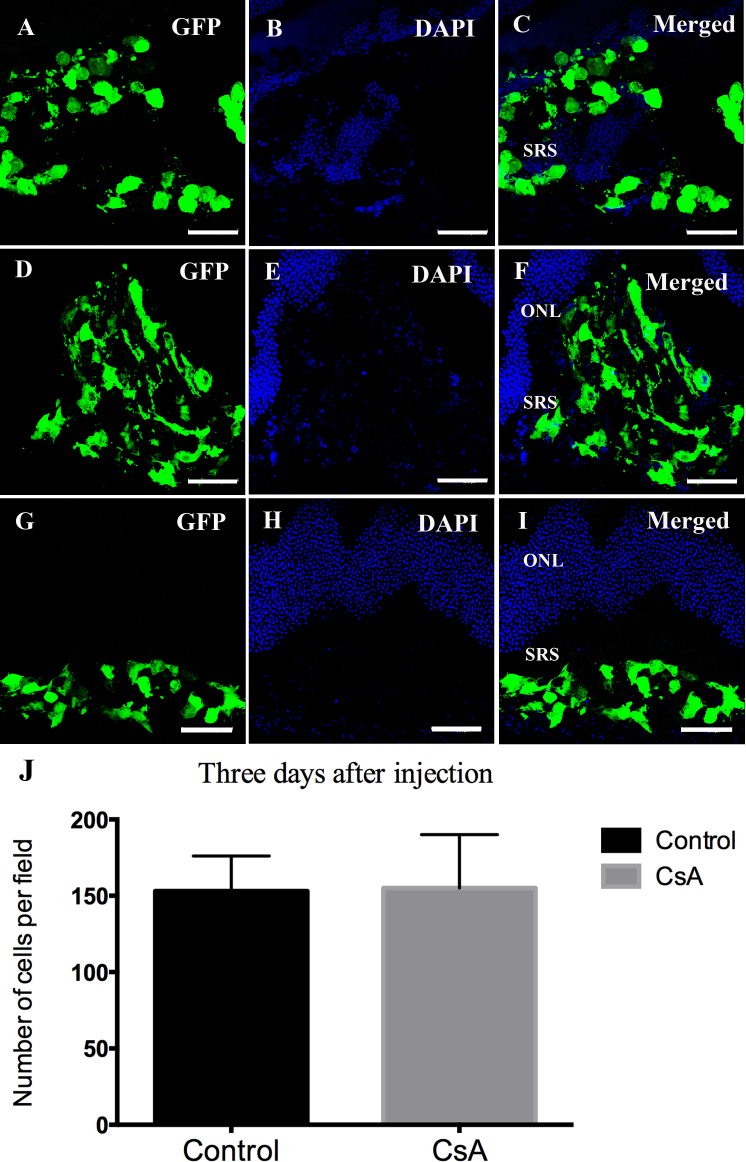
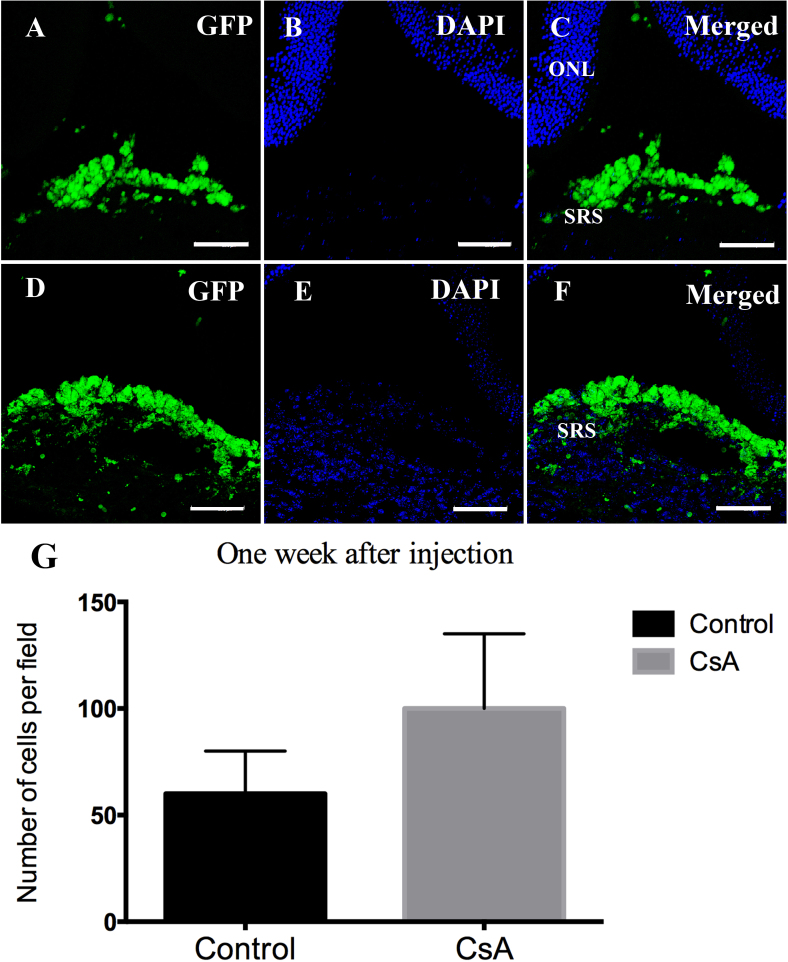
To evaluate the histological changes in the hRPCs under the systemic administration of CsA, GFP-positive hRPCs were injected into the B6 mice as a cell suspension in the subretinal space. The grafted GFP-positive hRPCs were observed suspended in the subretinal space as soon as they were injected into the recipient eyes, through both in vivo fundoscopy (not shown) and histological analyses (Figure 2, Figure 3, Figure 4). In addition, the hRPCs maintained a high level of expression of GFP, allowing easy identification of not only the cell bodies but also the processes. Compared with the cells that congregated together immediately after the injection, one could determine that the GFP-positive cells began to distribute evenly in the subretinal space around the injection site after 3 days (Figure 2F,I,J). There was no obvious difference between the control group and the CsA group (p>0.05); moreover, none were present within the host retina in either group. The picture shows the area of bleb formation and retinal detachment due to the delivery of the transplanted cells into the subretinal space. Similarly, 1 week after transplantation, a cluster of hRPCs remained in the subretinal space, and the survival rate decreased for both groups (Figure 3C,F,G; p<0.05).
Figure 2.
Three days after human retinal progenitor cells were injected into the subretinal space in B6 mice. The first row (A, B, C) represents the moment immediately after injection (n=10). The second row (D, E, F) shows the Cyclosporin A (CsA)-treated group (n=15). The third row (G, H, I) is the human retinal progenitor cell (hRPC) groups as the control (n=15). J: The average number of cells in the subretinal space was counted per microscopic field. The columns are the mean values, and the error bars are standard deviation (SD). * There was no obvious difference between the control group and the CsA group (p>0.05; n = 15). Scale bar = 50 μm. Abbreviations: outer nuclear layer (ONL); subretinal space (SRS).
Figure 3.
Seven days after human retinal progenitor cells were injected into the subretinal space in B6 mice. The first row (A, B, C) shows the Cyclosporin A (CsA)-treated group after injection (n=15). The second row (D, E, F) are the human retinal progenitor cell (hRPC) groups as the control (n=15). G: The average number of cells in the subretinal space was counted per microscopic field. The columns are the mean values, and the error bars are standard deviation (SD). A cluster of hRPCs remained in the subretinal space, and the survival rate decreased for both groups, but still showed a difference (p<0.05; n = 15). Scale bar = 50 μm. Abbreviations: outer nuclear layer (ONL); subretinal space (SRS).
Figure 4.
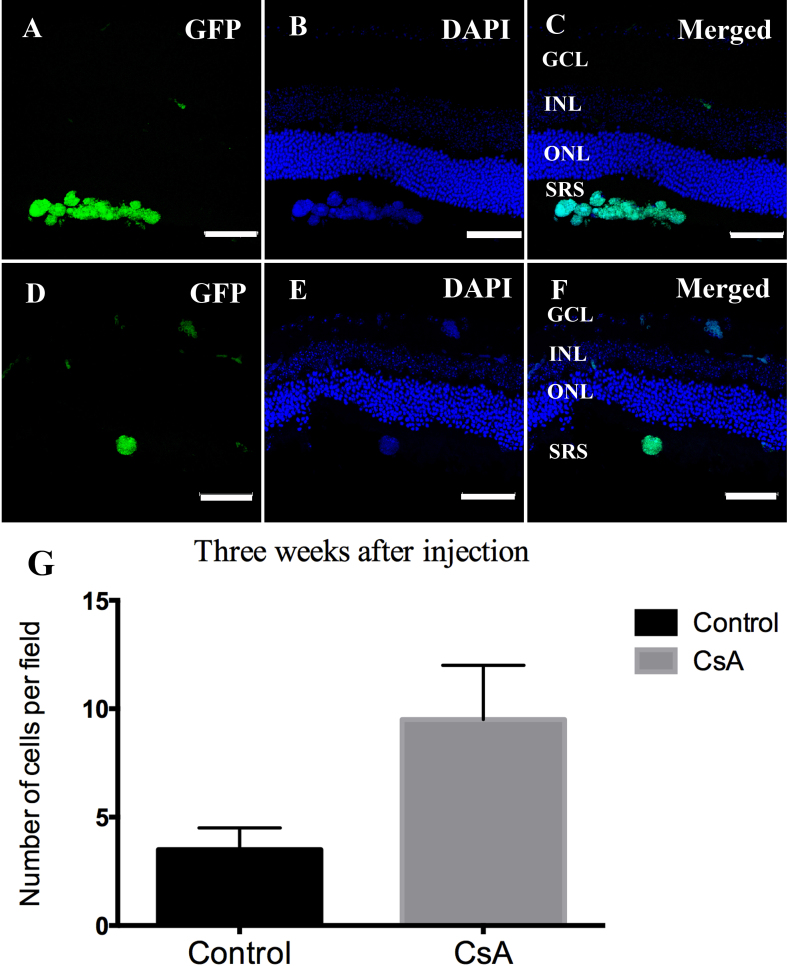
Three weeks after human retinal progenitor cells were injected into the subretinal space in B6 mice. The first row (A, B, C) represents the Cyclosporin A (CsA)-treated group after injection (n=15). The second row (D, E, F) is human retinal progenitor cells (hRPCs) groups as the control (n=15). G: The average number of cells in the subretinal space was counted per microscopic field. The columns are the mean values, and the error bars are standard deviation (SD). Compared with the control group, the cells in the CsA group survived better, with most remaining cells in the subretinal space (p<0.05; n = 15). Scale bar = 50 μm. Abbreviations: ganglion cell layer (GCL); inner nuclear layer (INL); outer nuclear layer (ONL); subretinal space (SRS).
The GFP expression decreased over time following the in vitro transplantation (possibly due to an immune reaction). The gap in the survival rate between the two groups increased, with the cells surviving in the CsA group, as opposed to the control group. Three weeks after transplantation, the grafted GFP positive hRPCs were still evident, and resided in the subretinal space (Figure 4C,F,G) with faint expression. Compared with the control group, the cells in the CsA group survived better, with most remaining cells in the subretinal space (p<0.05). However, a few cells migrated into the host retinal layers.
ERG analysis
The retinal function in this study was measured using ERG and analyzed (Figure 5 and Figure 6). The data from the ERG response stimulated with different flash intensities were collected under dark-adapted and light-adapted conditions, respectively. Therefore, the figure shows the data at the baseline (before injection) and at 1 and 3 weeks after injection. In the dark-adapted condition, no obvious difference between the CsA group and the control group was observed at 1 week (p = 0.40). However, the CsA group was much less influenced by the injection (p=0.114), which showed a statistically non-significant decrease from 1 week to 3 weeks (t = 0.531, p = 0.614), while the control group showed a larger decrease in the mean amplitude from 1 week to 3 weeks (p = 0.040).
Figure 5.
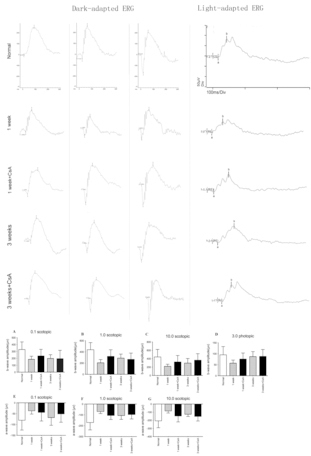
Electroretinography recordings from B6 mice in dark-adapted and light-adapted conditions at baseline, 1 week, and 3 weeks. The b-wave and a-wave response amplitudes in the Cyclosporin A (CsA) group (n=30) were less decreased than the control group (n=30) after injection in the dark-adapted and light-adapted conditions.
Figure 6.
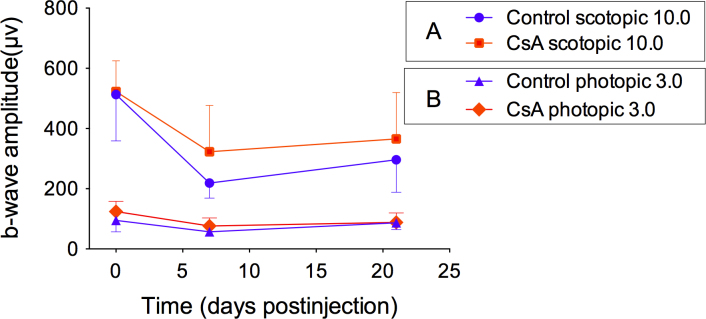
Comparison of electroretinography recordings in the dark-adapted and light-adapted conditions. A: Dark-adapted (rod-mediated) electroretinography (ERG) responses. B: Light-adapted (cone-mediated) ERG responses. Electroretinography was performed on mice before the injections, 1 week, and 3 weeks after injections. The dark- and light-adapted ERG recordings were performed on the same mice. The ERG response amplitudes in the Cyclosporin A (CsA) group were less reduced after the injection (p=0.114; p=0.01; in the dark-and-light-adapted conditions respectively), when compared with the control group (p=0.040; p=0.04; in the dark-and-light-adapted conditions, respectively), in both the dark-adapted and light-adapted conditions. However, the cone-mediated function in both groups was less affected by the transplantation after 3 weeks than the rod-mediated function p = 0.008; p = 0.044, for the non-CsA and CsA, respectively).
In the light-adapted condition, the ERG amplitude showed a significant decrease after the injection at 1 week in both groups (p =0.04, p = 0.001, for the non-CsA and CsA, respectively). However, the cone ERG function was almost recovered in the CsA group (p = 0.534). Compared to the light-adapted condition, the response amplitudes in the dark-adapted condition, mediated by the rods, decreased significantly from the baseline 1 week after injection, while the light-adapted ERG, mediated by the cones, was less affected. The dark-adapted ERG and the light-adapted ERG improved over time, but 3 weeks after transplantation, the ERG amplitudes were hard to recover to the baseline measurements (p = 0.008, p = 0.044, for the non-CsA and CsA, respectively).
Discussion
With the combination of noninvasive and invasive methods applied in our study, we monitored the retinal structural and functional changes when the hRPCs were injected into the subretinal space in the wild-type mice, after 3 weeks of treatment with CsA. Recovery from the initial blebs was observed in the live animals with the implementation of SDOCT, while the resulting histological and functional changes in transplantation were analyzed using confocal microscopy and ERG.
Recently, retinal progenitor cells have received considerable attention as novel and feasible tools in the quest to restore sight in cases of retinal degeneration, and certainly hold great potential as a promising cell-based approach for photoreceptor degeneration [20-22]. Since mice and humans share a significant number of conservative properties for retinal stem cells, there is no distinct species difference between stem cells, which demonstrates the possibility for the therapeutic potential of human RSCs [20,21,23]. The systemic administration of CsA is now widely used in the clinical treatment of ophthalmic diseases, suppressing the immune response by blocking the signal transduction pathway responsible for activating B-lymphocytes and T-lymphocytes [12-14].
The results of our study prompted us to discuss some possible mechanisms taking place. First, disrupted by subretinal injection, the balance of the subretinal microenvironment previously regarded as an immunoprivileged site was broken [24]. Second, CsAs may induce the overexpression of cell factors, such as transforming growth factor-β (TGF-β; a fibrogenic cytokine), which eventually act as immunosuppressants against rejection after transplantation [25]. Third, retinal progenitor cells, in general, have been shown to possess low immunogenicity, which may protect them from T-cell recognition, allowing them to survive in hosts for extended periods of time [26]. In the ocular microenvironment, immunosuppressive factors, including TGF-β, FasL, and IDO, produced by the RPCs, contribute in part to the immunoprivileged (IP) properties [24,27]. Finally, the synergistic effects of retinal progenitor cells and the implementation of CsA induce suppression in the recipient’s immune response, making it possible to increase the survival rate after 3 weeks. The fact that the hRPCs survived better under the treatment of CsA for 3 weeks in our study, postinjection, supports hRPC transplantation and shows promising potential as a feasible cell source for transplantation. RPCs can be delivered to the retina in different ways (intravenous, intravitreal, and subretinal) and in different forms (suspension versus sheets of cells) [28,29]. In our study, we chose the injection of hRPCs as a single cell suspension, which imposes certain stresses on the graft, which may result in cell death and a poor survival rate.
Although we have shown a statistical difference between the CsA and non-CsA groups, the substantial number of hRPCs left in the subretinal space in both groups still manifested a huge decrease after 3 weeks. There are some possible reasons for this. First, the B6 mice did not have an incentive environment for cell survival. Instead, it may have released immunoreactive factors to resist the donor cells living in the subretinal space. It may be helpful to perform transplantation with the CsA either directly injected into the subretinal space or via a controlled release system in the future. Second, because of the regression of the cells at the injection site, the donor cells left in the spot would be greatly decreased. Therefore, improvement in the delivery methods, such as seeding hRPCs on scaffolds, may cushion the stress placed on the grafted cells and increase the survival rate.
SDOCT was selected as a noninvasive approach for detecting the bleb of retinal detachment with mouse eyes, allowing us to monitor the advancement of the reattachment postinjection. Compared to the approach adapted in several studies [30,31], it has been shown that good reproducibility for SDOCT of retinal measurements in mice could be used as a promising technology following retinal detachment, and outer retinal abnormalities in a murine model. The flattening of the blebs after 3 weeks, observed in most of the mice, showed that the time taken for reattachment could be an important parameter in evaluating the recovery of retinal structure and function [32-35].
The change in the retinal function postinjection was evaluated using ERG in our study. There was no obvious difference between the two groups in the light-adapted conditions after 3 weeks, indicating that the cone function was less affected by the injection. Although the visual cycle was disrupted by transplantation, the cone function showed less dependence on the relationship with the RPE, since it initiates an alternate visual pathway responsible for sustained daylight vision, and thus, it may be less influenced [36]. The decrease in the ERG amplitude shortly after injection is likely due to the separation of the sensory retina from the retinal pigment epithelium. However, it has been shown that the CsA group recovered better after 3 weeks, demonstrating that the rod-mediated function under dark-adapted conditions was affected more by the surgery, and that the CsA could alleviate the trauma of the sham surgery to some extent. Neither the scotopic nor photopic functions recovered to their original conditions by 3 weeks after injection, probably due to the photoreceptor cell loss, especially near the injection site.
In conclusion, our study shows that the combination of hRPCs and CsA treatment made it possible for the xenograft cells to survive better. The differentiation and migration in retinal degenerative mice, under the treatment of CsA, require further investigation.
Acknowledgments
The authors would like to thank Jian Ma (Schepens Eye Research Institute, Boston) for expert technical advice. Dr. Michael J. Young (michael_young@meei.harvard.edu) and Dr. Jian Ge (gejian@mail.sysu.edu.cn) are co-corresponding authors for this paper.
References
- 1.Bi YY, Feng DF, Pan DC. Stem/progenitor cells: a potential source of retina-specific cells for retinal repair. Neurosci Res. 2009;65:215–21. doi: 10.1016/j.neures.2009.07.008. [DOI] [PubMed] [Google Scholar]
- 2.Huang Y, Enzmann V, Ildstad ST. Stem cell-based therapeutic applications in retinal degenerative diseases. Stem Cell Rev. 2011;7:434–45. doi: 10.1007/s12015-010-9192-8. [DOI] [PMC free article] [PubMed] [Google Scholar]
- 3.Ong JM, da Cruz L. A review and update on the current status of stem cell therapy and the retina. Br Med Bull. 2012;102:133–46. doi: 10.1093/bmb/lds013. [DOI] [PubMed] [Google Scholar]
- 4.MacLaren RE, Pearson RA. Stem cell therapy and the retina. Eye (Lond) 2007;21:1352–9. doi: 10.1038/sj.eye.6702842. [DOI] [PubMed] [Google Scholar]
- 5.Léveillard T, Mohand-Said S, Sahel JA. Med Sci (Paris) 2007;23:240–2. doi: 10.1051/medsci/2007233240. Retinal repair by transplantation of photoreceptor precursors. [DOI] [PubMed] [Google Scholar]
- 6.Lamba DA, Gust J, Reh TA. Transplantation of human embryonic stem cell-derived photoreceptors restores some visual function in Crx-deficient mice. Cell Stem Cell. 2009;4:73–9. doi: 10.1016/j.stem.2008.10.015. [DOI] [PMC free article] [PubMed] [Google Scholar]
- 7.Yu J, Vodyanik MA, Smuga-Otto K, Antosiewicz-Bourget J, Frane JL, Tian S, Nie J, Jonsdottir GA, Ruotti V, Stewart R, Slukvin II, Thomson JA. Induced pluripotent stem cell lines derived from human somatic cells. Science. 2007;318:1917–20. doi: 10.1126/science.1151526. [DOI] [PubMed] [Google Scholar]
- 8.Kicic A, Shen WY, Wilson AS, Constable IJ, Robertson T, Rakoczy PE. Differentiation of marrow stromal cells into photoreceptors in the rat eye. J Neurosci. 2003;23:7742–9. doi: 10.1523/JNEUROSCI.23-21-07742.2003. [DOI] [PMC free article] [PubMed] [Google Scholar]
- 9.Rodgerson DO, Harris AG. A comparison of stem cells for therapeutic use. Stem Cell Rev. 2011;7:782–96. doi: 10.1007/s12015-011-9241-y. [DOI] [PubMed] [Google Scholar]
- 10.West EL, Pearson RA, MacLaren RE, Sowden JC, Ali RR. Cell transplantation strategies for retinal repair. Prog Brain Res. 2009;175:3–21. doi: 10.1016/S0079-6123(09)17501-5. [DOI] [PMC free article] [PubMed] [Google Scholar]
- 11.Taylor CJ, Bolton EM, Pocock S, Sharples LD, Pedersen RA, Bradley JA. Banking on human embryonic stem cells: estimating the number of donor cell lines needed for HLA matching. Lancet. 2005;366:2019–25. doi: 10.1016/S0140-6736(05)67813-0. [DOI] [PubMed] [Google Scholar]
- 12.Lallemand F, Felt-Baeyens O, Besseghir K, Behar-Cohen F, Gurny R. Cyclosporine A delivery to the eye: a pharmaceutical challenge. Eur J Pharm Biopharm. 2003;56:307–18. doi: 10.1016/s0939-6411(03)00138-3. [DOI] [PubMed] [Google Scholar]
- 13.Utine CA, Stern M, Akpek EK. Clinical review: topical ophthalmic use of cyclosporin A. Ocul Immunol Inflamm. 2010;18:352–61. doi: 10.3109/09273948.2010.498657. [DOI] [PubMed] [Google Scholar]
- 14.Belin MW, Bouchard CS, Phillips TM. Update on topical cyclosporin A. Background, immunology, and pharmacology. Cornea. 1990;9:184–95. [PubMed] [Google Scholar]
- 15.Francis PJ, Wang S, Zhang Y, Brown A, Hwang T, McFarland TJ, Jeffrey BG, Lu B, Wright L, Appukuttan B, Wilson DJ, Stout JT, Neuringer M, Gamm DM, Lund RD. Subretinal transplantation of forebrain progenitor cells in non-human primates: Survival and intact retinal function. Invest Ophthalmol Vis Sci. 2009;50:3425–31. doi: 10.1167/iovs.08-2908. [DOI] [PMC free article] [PubMed] [Google Scholar]
- 16.McGill TJ, Lund RD, Douglas RM, Wang S, Lu B, Prusky GT. Preservation of vision following cell-based therapies in a model of retinal degenerative disease. Vision Res. 2004;44:2559–66. doi: 10.1016/j.visres.2004.05.025. [DOI] [PubMed] [Google Scholar]
- 17.Lu B, Malcuit C, Wang S, Girman S, Francis P, Lemieux L, Lanza R, Lund R. Long-term safety and function of RPE from human embryonic stem cells in preclinical models of macular degeneration. Stem Cells. 2009;27:2126–35. doi: 10.1002/stem.149. [DOI] [PubMed] [Google Scholar]
- 18.Aftab U, Jiang C, Tucker B, Kim JY, Klassen H, Miljan E, Sinden J, Young M. Growth kinetics and transplantation of human retinal progenitor cells. Exp Eye Res. 2009;89:301–10. doi: 10.1016/j.exer.2009.03.025. [DOI] [PubMed] [Google Scholar]
- 19.Baranov PY, Tucker BA, Young MJ. Low-Oxygen Culture Conditions Extend the Multipotent Properties of Human Retinal Progenitor Cells. Tissue Eng Part A. 2014 doi: 10.1089/ten.tea.2013.0361. [DOI] [PMC free article] [PubMed] [Google Scholar]
- 20.Klassen HJ, Ng TF, Kurimoto Y, Kirov I, Shatos M, Coffey P, Young MJ. Multipotent retinal progenitors express developmental markers, differentiate into retinal neurons, and preserve light-mediated behavior. Invest Ophthalmol Vis Sci. 2004;45:4167–73. doi: 10.1167/iovs.04-0511. [DOI] [PubMed] [Google Scholar]
- 21.Mayer EJ, Carter DA, Ren Y, Hughes EH, Rice CM, Halfpenny CA, Scolding NJ, Dick AD. Neural progenitor cells from postmortem adult human retina. Br J Ophthalmol. 2005;89:102–6. doi: 10.1136/bjo.2004.057687. [DOI] [PMC free article] [PubMed] [Google Scholar]
- 22.Coles BL, Angénieux B, Inoue T, Del Rio-Tsonis K, Spence JR, McInnes RR, Arsenijevic Y, van der Kooy D. Facile isolation and the characterization of human retinal stem cells. Proc Natl Acad Sci USA. 2004;101:15772–7. doi: 10.1073/pnas.0401596101. [DOI] [PMC free article] [PubMed] [Google Scholar]
- 23.Djojosubroto MW, Arsenijevic Y. Retinal stem cells: promising candidates for retina transplantation. Cell Tissue Res. 2008;331:347–57. doi: 10.1007/s00441-007-0501-8. [DOI] [PubMed] [Google Scholar]
- 24.Ng TF, Lavik E, Keino H, Taylor AW, Langer RS, Young MJ. Creating an immune-privileged site using retinal progenitor cells and biodegradable polymers. Stem Cells. 2007;25:1552–9. doi: 10.1634/stemcells.2006-0780. [DOI] [PubMed] [Google Scholar]
- 25.Moien-Afshari F, McManus BM, Laher I. Immunosuppression and transplant vascular disease: benefits and adverse effects. Pharmacol Ther. 2003;100:141–56. doi: 10.1016/j.pharmthera.2003.08.002. [DOI] [PubMed] [Google Scholar]
- 26.Klassen H, Ziaeian B, Kirov II, Young MJ, Schwartz PH. Isolation of retinal progenitor cells from post-mortem human tissue and comparison with autologous brain progenitors. J Neurosci Res. 2004;77:334–43. doi: 10.1002/jnr.20183. [DOI] [PubMed] [Google Scholar]
- 27.Klassen HJ, Imfeld KL, Kirov II, Tai L, Gage FH, Young MJ, Berman MA. Expression of cytokines by multipotent neural progenitor cells. Cytokine. 2003;22:101–6. doi: 10.1016/s1043-4666(03)00120-0. [DOI] [PubMed] [Google Scholar]
- 28.Ma J, Kabiel M, Tucker BA, Ge J, Young MJ. Combining chondroitinase ABC and growth factors promotes the integration of murine retinal progenitor cells transplanted into Rho(−/−) mice. Mol Vis. 2011;17:1759–70. [PMC free article] [PubMed] [Google Scholar]
- 29.Tomita M, Lavik E, Klassen H, Zahir T, Langer R, Young MJ. Biodegradable polymer composite grafts promote the survival and differentiation of retinal progenitor cells. Stem Cells. 2005;23:1579–88. doi: 10.1634/stemcells.2005-0111. [DOI] [PubMed] [Google Scholar]
- 30.Cebulla CM, Ruggeri M, Murray TG, Feuer WJ, Hernandez E. Spectral domain optical coherence tomography in a murine retinal detachment model. Exp Eye Res. 2010;90:521–7. doi: 10.1016/j.exer.2010.01.008. [DOI] [PMC free article] [PubMed] [Google Scholar]
- 31.Gabriele ML, Ishikawa H, Schuman JS, Bilonick RA, Kim J, Kagemann L, Wollstein G. Reproducibility of spectral-domain optical coherence tomography total retinal thickness measurements in mice. Invest Ophthalmol Vis Sci. 2010;51:6519–23. doi: 10.1167/iovs.10-5662. [DOI] [PMC free article] [PubMed] [Google Scholar]
- 32.Ruggeri M, Wehbe H, Jiao S, Gregori G, Jockovich ME, Hackam A, Duan Y, Puliafito CA. In vivo three dimensional high-resolution imaging of rodent retina with spectral domain optical coherence tomography. Invest Ophthalmol Vis Sci. 2007;48:1808–14. doi: 10.1167/iovs.06-0815. [DOI] [PubMed] [Google Scholar]
- 33.Fischer MD, Huber G, Beck SC, Tanimoto N, Muehlfriedel R, Fahl E, Grimm C, Wenzel A, Reme CE, van de Pavert SA, Wijnholds J, Pacal M, Bremner R, Seeliger MW. Noninvasive, in vivo assessment of mouse retinal structure using optical coherence tomography. PLoS ONE. 2009;4:e7507. doi: 10.1371/journal.pone.0007507. [DOI] [PMC free article] [PubMed] [Google Scholar]
- 34.Huber G, Beck SC, Grimm C, Sahaboglu-Tekgoz A, Paquet-Durand F, Wenzel A, Humphries P, Redmond TM. Spectral domain optical coherence tomography in mouse models of retinal degeneration. Invest Ophthalmol Vis Sci. 2009;50:5888–95. doi: 10.1167/iovs.09-3724. [DOI] [PMC free article] [PubMed] [Google Scholar]
- 35.Pinilla I, Lund RD, Lu B, Sauve Y. Measuring the cone contribution to the ERG b-wave to assess function and predict anatomical rescue in RCS rats. Vision Res. 2005;45:635–41. doi: 10.1016/j.visres.2004.09.014. [DOI] [PubMed] [Google Scholar]
- 36.Mata NL, Radu RA, Clemmons RC, Travis GH. Isomerization and oxidation of vitamin a in cone-dominant retinas: a novel pathway for visual-pigment regeneration in daylight. Neuron. 2002;36:69–80. doi: 10.1016/s0896-6273(02)00912-1. [DOI] [PMC free article] [PubMed] [Google Scholar]


