Abstract
This paper addresses the issue of initial verification of hearing aid gain and output for nonlinear hearing aids. Specifically, “urban legend” has it that nonlinear hearing aids with digital noise reduction circuitry may not be accurately measured using functional gain and/or probe microphone measures. Discussed are the advantages and disadvantages of both measurement strategies, and how they may be used to “acoustically match” hearing aids to individual patients. An evaluation protocol that employs both optimal aided thresholds and probe microphone measurements to assess gain, output, and audibility in hearing-impaired patients.
Kuk and Ludvigsen (2003) present the argument that functional gain and, specifically, the behavioral measurement of “optimal” aided threshold, serves as an appropriate verification tool for fitting nonlinear hearing aids. This issue has been discussed for some time; Killion (1996) maintained that, “A good argument can be made for providing no gain for intense sounds but as much gain as needed to make low-level sounds (say 20 dB HL) audible. Wide dynamic range (WDR) compression is perfectly suited to this task.” Even earlier, Pascoe (1975) had shown that the use of a “uniform hearing level” (aided audibility curve that is parallel to 0 dB HL) fitting approach in hearing-impaired listeners provided higher word recognition scores than for four other gain-by-frequency strategies. A more fundamental issue, however, relates to the most appropriate method for the verification of hearing aid fitting goals when nonlinear hearing aids are used; this topic has been debated since the widespread introduction some 20 years ago of probe microphone measurements for “real ear” hearing aid measurements.
First, I must reveal my bias. I was an “early adopter” of probe microphone measurement techniques, as I was a graduate student at the University of Minnesota in 1981 when Dr. Earl Harford demonstrated his technique that used miniature microphones for the objective evaluation of in situ hearing aid performance. Later that year, I heard a presentation by Mead Killion, a young engineer from Industrial Research Products. He was visiting numerous faculty at the University of Minnesota, including Dr. Harford and Dr. Dianne Van Tasell (my mentor), to discuss his ideas for the development of a high-fidelity hearing aid. My early coursework and clinical experiences were grounded in two facts: (1) the acoustical coupling of hearing aid performance to the individual patient was critical to a successful result and (2) real-ear measurements promised improved reliability and validity compared to functional gain measures.
That said, my clinical supervisors were quick to remind me that probe microphone measurements assessed gain, not hearing. This point remains just as valid today, and it is central to the argument that both objective and behavioral verification measures of hearing aid function are valuable tools for the audiologist.
Kuk and Ludvigsen conclude by acknowledging that, “Despite its usefulness, information provided by sound-field measures is not the same as that provided by probe microphone measures, especially in nonlinear hearing aids. Thus, these two indices must be determined separately for a complete verification of the wearer's performance with the hearing aids.” However, the reality is that, for a variety of reasons, many clinicians will not use both measures; faced with the prospect of purchasing additional equipment for use with probe microphone measurements, many clinicians may decide to use optimal aided threshold, which requires little or no additional hardware.
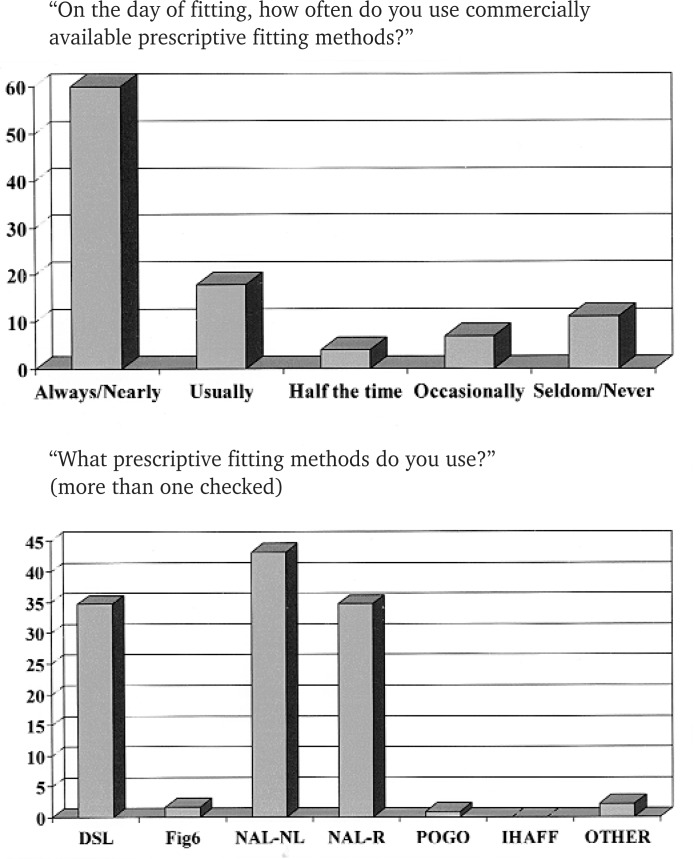
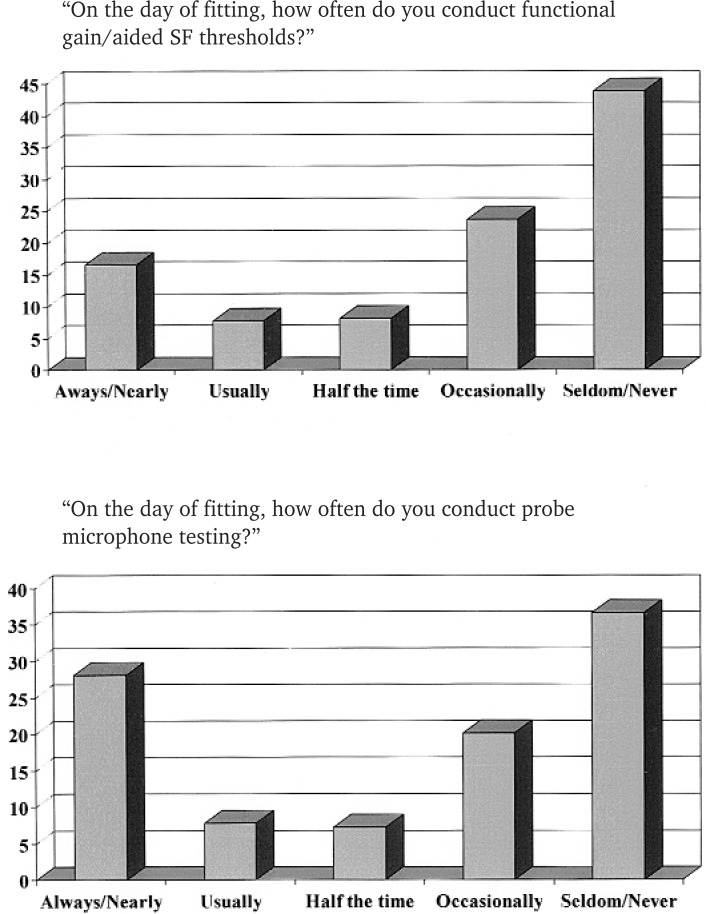
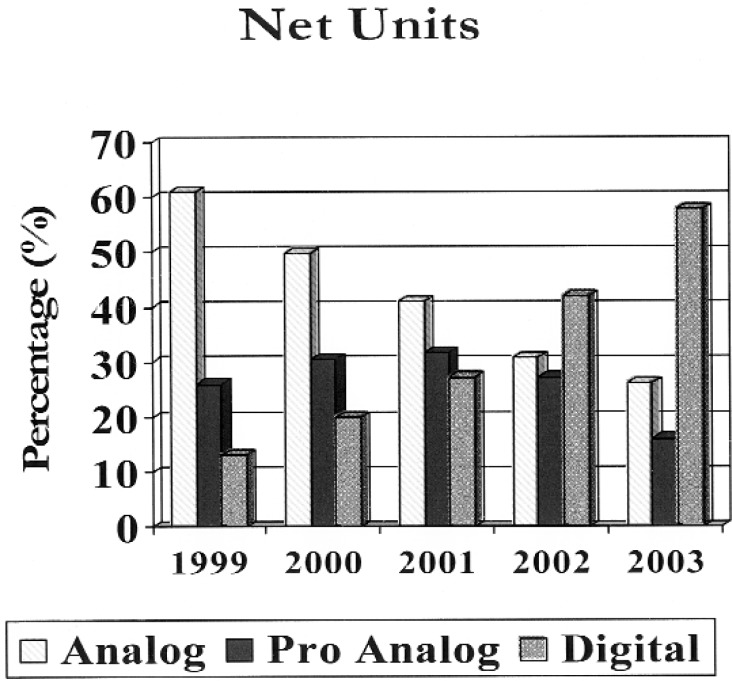
In fact, recent data suggest that many clinicians are not using either measure of verification. A recent survey of over 500 audiologists indicated that although nearly 80% of the respondents routinely use commercially available prescriptive fitting formulae (Kirkwood, 2003), few are using either real-ear measurement or functional gain measurements to assess performance at the initial fitting (Figures 1 and 2) even though nearly 75% of all hearing aids (Hearing Industries Association, 2003) dispensed in the United States were digital or digitally programmable (Figure 3).
Figure 1.
Results from annual survey of audiology practitioners from Kirkwood (2003). Abbreviations: DSL, desired sensation level; FIG, flat insertion gain; IHAFF, independent hearing aid fitting formula; NAL-R, National Acoustic Laboratories-Revised Formula; NAL-NL, National Acoustic Laboratories-Nonlinear; POGO, prescription for gain and output.
Figure 2.
Results from annual survey of audiology practitioners from Kirkwood (2003).
Figure 3.
Results from Hearing Industry Association (2003), showing proportion of analog, digitally programmable, and digital hearing aids from 1999 to 2003.
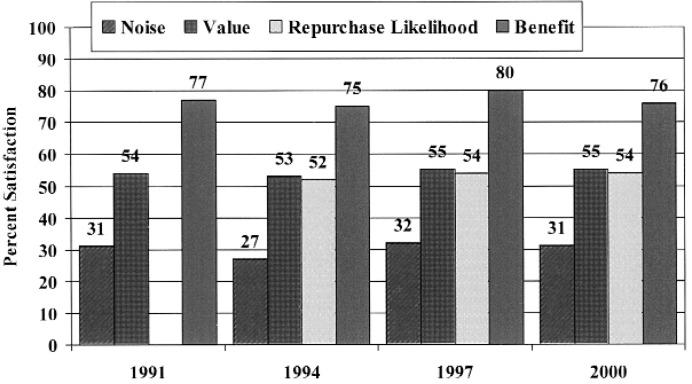
A primary advantage of digital hearing aids is often cited to be the increased precision provided by digital signal processing to optimize hearing aid fitting, but this flexibility appears to be routinely overlooked, at least at the initial hearing aid fitting session. In essence, the advent of digital hearing aids appears to have been accompanied by an increasing reliance on the manufacturer's precalculations, rather than empirical verification of fitting targets. This trend, combined with the lack of improvement in hearing aid satisfaction during the past decade (Figure 4), suggests a surprising disconnect exists between perception and reality for acoustically matching digital hearing aids to individual patient's ears.
Figure 4.
Customer satisfaction with value, benefit-in-noise, overall benefit, and likelihood of repurchasing the current brand of hearing instrument (hearing instruments less than years of age. Source: MarkeTrak III (1991)—MarkeTrak VI (2000).
The primary purpose of this paper is to dispel some myths regarding the verification of nonlinear hearing aid performance, as well as to suggest some clinically efficacious methods for improving sound quality, speech intelligibility, and ultimately, user satisfaction with hearing aids. Kuk and Ludvigsen have provided an excellent overview on the merits of optimal aided threshold; the focus here is to identify a few reasons why clinicians should think twice before relying exclusively on behaviorally aided measurements for hearing aid verification with pediatric and adult populations.
Issue 1: Real-Ear Measurements Can be Made on Nonlinear Hearing Aids
Although real-ear measurements for hearing aid fitting became increasingly popular in the 1980s and 1990s, they appeared to peak in the United States in recent years. I believe the recent decline in use of real-ear measurements is influenced strongly by the widespread use of digital hearing aids, which often employ nonlinear signal-processing strategies. In fact, it has become a popular misconception that nonlinear hearing aids may not be measured accurately with real-ear equipment; this is rather paradoxical, given that the inherent flexibility that accompanies most digital platforms should prove advantageous for verification of fitting goals.
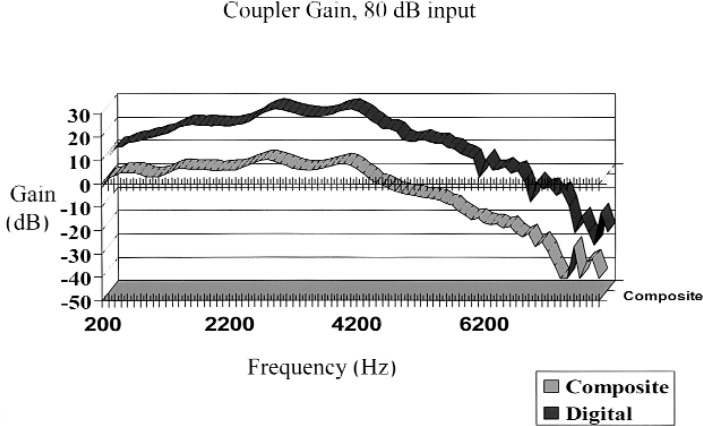
The basis for this myth is grounded in reality: although some digital hearing aids are intelligent enough to determine whether they are at home or at a party, they are not smart enough to figure out when they are in a test box. That is, many hearing aids use digital noise reduction (DNR) that interferes with the pure tone or composite noise test signals used by many real-ear test systems. In most cases, measured insertion gain underestimates actual use gain, because the DNR reduces gain in an attempt to “eliminate” the noise (Figure 5). Ideally, DNR should be turned off when the hearing aid is evaluated, but then the question is how well those measures represent actual performance in “real world” settings, when both speech and noise are present. A test mode that removes the noise canceller from the circuit for evaluation is one solution some hearing aid manufacturers have used, but this prevents the circuit from operating as it would under actual use conditions.
Figure 5.
2-cc coupler measurements for a digital hearing aid with noise cancellation activated. Standard composite and “digital” noise signals were used.
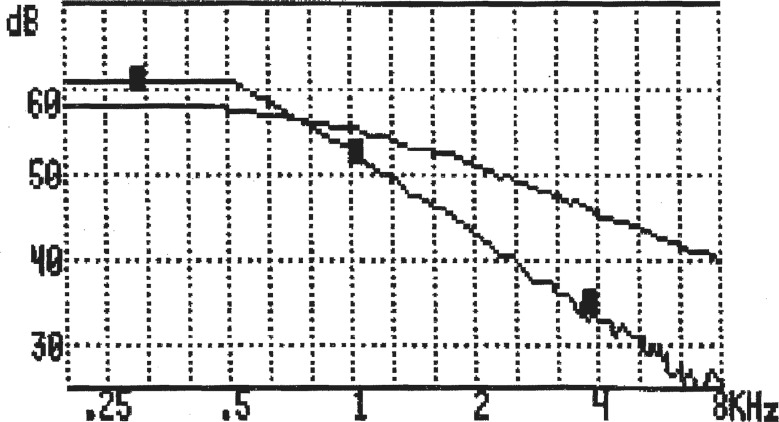
The developers of real-ear measurement systems have provided a better answer to the problem. By adapting the spectral and/or temporal properties of the test signal, DNR identifies it as speech, rather than noise (use ICRA noise, Figure 6). In addition, several real-ear manufacturers have developed test systems that use actual speech as the test signal, which provides additional test validity. Consequently, insertion gain measured in this fashion provides a precise and repeatable indication of real-world performance with nonlinear hearing aids. The remaining challenges, however, include the development of phonetically and phonemically balanced speech materials that are valid and clinically efficient.
Figure 6.
Spectral measurements for ANSI speech-weighted noise (solid line) and for International Collegium of Rehabilitative Audiology (ICRA) noise, based on temporal and spectral characteristics of multiple talkers (square symbols).
Clinicians who attempt to verify insertion gain targets with nonlinear hearing aids face another obstacle: Many manufacturers use proprietary target formulae to set precalculation gain values. Although this is understandable, given the complex signal processing used in modern hearing aids, it also makes the verification of targets impossible. Most real-ear test equipment includes National Acoustics Laboratory-Nonlinear (NAL-NL1) (Byrne et al., 2001) or desired sensation level (DSL) 4.1a (Seewald et al., 1997) formulae, but unless a manufacturer's proprietary target values are provided with the hearing aid fitting software, clinicians have no means to calculate them for individual patients from manufacturer-specific formulae.
Clinicians who are working with the latest technology should upgrade their real-ear test equipment to include “digital” test signals or “real” speech. By doing so, they will be able to accurately assess use gain in nonlinear hearing aids under realistic conditions for individual patients. Until that happens, I'd recommend that they disable the DNR feature in software (if possible) prior to testing nonlinear hearing aids. If this is not possible, another “trick” is to turn the test signal on and off again very rapidly, to capture gain and output values prior to DNR activation. Both of these techniques serve as a low-budget alternative to spending money on the upgrades.
Issue 2: Functional Gain and Insertion Gain Measures may Differ Dramatically for Nonlinear Hearing Aids
As Kuk and Ludvigsen point out, functional gain measures overestimate use gain for conversational speech levels for nonlinear (eg, wide dynamic range compression) hearing aids. They argue, however, that at low input levels, the optimal aided threshold provides an ideal measure of speech audibility and intelligibility. Indeed, even though the optimal aided threshold indicates how well a hearing aid user hears soft sounds, it provides no information for conversational level speech or hearing aid maximum power output (MPO), both of which are essential for fitting adult and pediatric patients.
Insertion gain measurements and nonlinear fitting formulae, such as NAL-NL1, DSL input/output, and the independent hearing aid fitting formula (IHAFF), provide objective evidence of speech audibility for soft, comfortable, and loud speech and other sounds. These formulae were established specifically for nonlinear hearing aids, and they may be used to set compression threshold and ratio with much greater precision than when functional gain or optimal aided thresholds are used.
Neither measurement is right or wrong; in fact, there may be advantages to using both measurements. If only one is completed, however, probe microphone measurements with nonlinear prescriptive targets provide a more accurate predictor of performance over a wide range of input stimuli. This issue becomes increasingly important with digital hearing aids, because a disproportionate number use nonlinear signal-processing strategies that allow independent control of compression threshold, compression ratio, and gain for multiple frequency regions that often exceed the frequency resolution provided with typical functional gain measures.
Issue 3: Real-Ear Measurements Are More Precise Than Assessment of Functional Gain and Optimal Aided Threshold
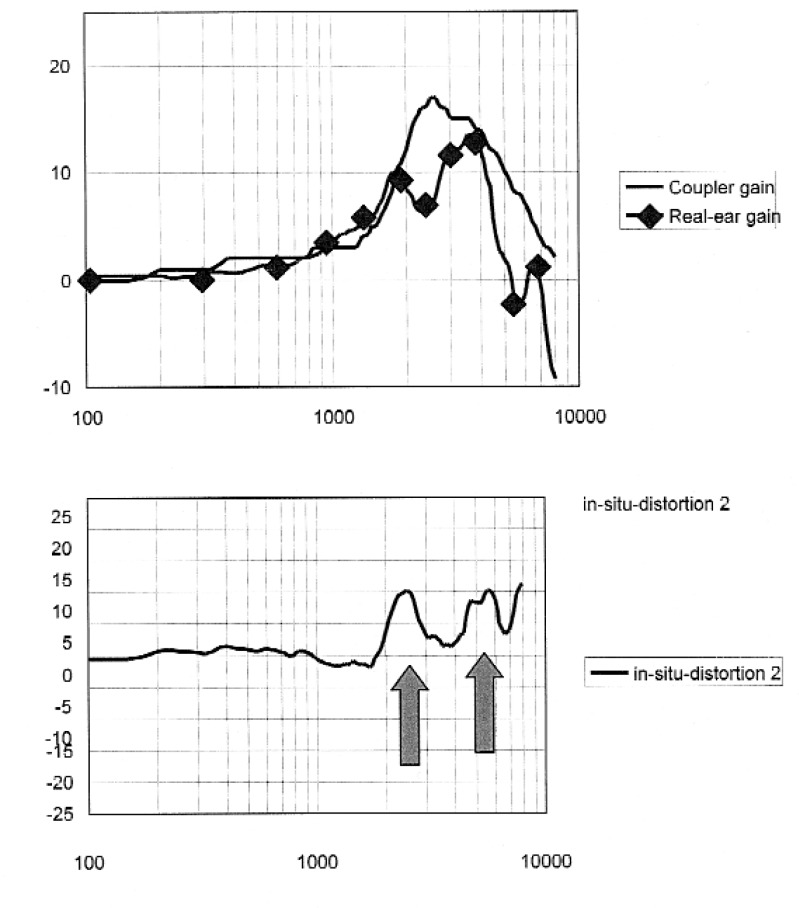
Notwithstanding the inability to assess hearing, real-ear measurements are more precise than functional gain measures for numerous reasons. First of all, functional gain measures are typically limited to audiometric frequencies, which rules out identifying acoustic interactions that may occur at octave or intraoctave frequencies (eg, 2700 Hz). By comparison, speech harmonics occur every 100 to 200 Hz, and most real-ear test systems use similar precision for their composite or warble-tone stimuli. This is particularly important for pediatric patients or surgical ears, and also for assessing hearing aid MPO, which may interact with residual ear canal volume to produce narrow resonance peaks that might not be detected at octave or intraoctave frequencies (Figure 7). Quite simply, functional gain just doesn't offer enough precision to do the job.
Figure 7.
2-cc coupler gain and real-ear gain measures (upper graph), with difference function (lower graph), indicating that large differences exist at intraoctave frequencies (arrows) with minimal difference at typical frequencies. Used for audiometric evaluation.
Another advantage of probe microphone measurements is measurement reliability. Numerous studies have demonstrated that the test-retest reliability is between 1 and 5 dB (Ringdahl and Lejon, 1984; Hawkins, 1987; Hawkins et al., 1991). For functional gain, separate measurements for aided and unaided threshold are required, and reliability may vary by 15 dB or more under ideal test conditions (Hawkins et al., 1987; Humes and Kirn, 1990; Stuart et al., 1990). That is, unless electroacoustic differences exceed 15 dB between two test conditions (unaided vs. aided, or aided vs. aided), they cannot be measured accurately and repeatedly with functional gain. Further, these measurements may be more variable or impossible for pediatric or difficult-to-test patients, for wide dynamic range compression circuits, or outside of audiometric test booths. If behavioral measures are to be used, however, optimal aided threshold has one advantage over functional gain in that it uses only one—rather than two—highly variable measurements. At best, this translates to about a 10-dB difference between two hearing aid settings to be interpreted as being significantly different from each other.
Issue 4: In Situ Measurements of Hearing Aid Function Are Not as Easy as They Seem
In situ hearing aid measurements through nonlinear hearing aids face additional challenges because ambient noise levels interfere with threshold assessment. For applications requiring a determination of hearing thresholds to 25 dB HL, as Kuk and Ludvigsen suggest, the maximum A-weighted noise levels allowable are 40 dB (Killion and Studebaker, 1978). This ambient noise level is difficult to achieve outside of audiometric test booths, although it is easy to achieve probe microphone measurements with 50 or 65 dB sound pressure level (SPL) stimuli in a typical classroom or office environment.
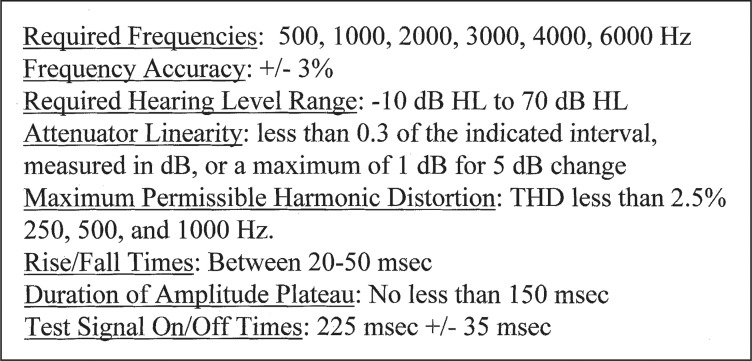
Behavioral threshold assessment with nonlinear hearing aids faces another challenge: No American National Standards Institute (ANSI) standards regulate their function. That is, although ANSI has standards for specification of hearing aid characteristics (ANSI S3.22-1996), no applications relate to the required precision for the testing of human hearing through the hearing aid, similar to those regulating audiometers and probe microphone systems. For example, there are recommended amplitudes, rise times, durations, and repetition rates for test stimuli, as well as specifications for attenuator linearity for test frequencies between 500 and 6000 Hz (Figure 8).
Figure 8.
Required specifications of a Type IV audiometer used for air-conduction testing (ANSI, S3.6-1996).
Furthermore, as Kuk and Ludvigsen have indicated, compression time constants may interfere with the measurements and an ascending presentation method may be required to minimize the impact of compression threshold as well. Simply put, hearing aids are not audiometers, and the lack of standardization impacts the accuracy of measurement and ultimately, the end-user. Thus, optimal aided-threshold measurements face the additional challenge of “portability.” That is, if a standard reference point (eg, a 2-cc coupler measure, SPL at the tympanic membrane) is used to express hearing aid gain, the data may be transferred to a replacement device more easily than if the reference is expressed in the nominal threshold level reached in situ for a particular brand of hearing aid. In essence, the exclusive use of optimal aided threshold through the hearing aid removes verification from the practitioner's hands.
Issue 5: Functional Gain and Optimal Aided Threshold Measurements Cannot Assess the Performance of Advanced Signal Processing Features
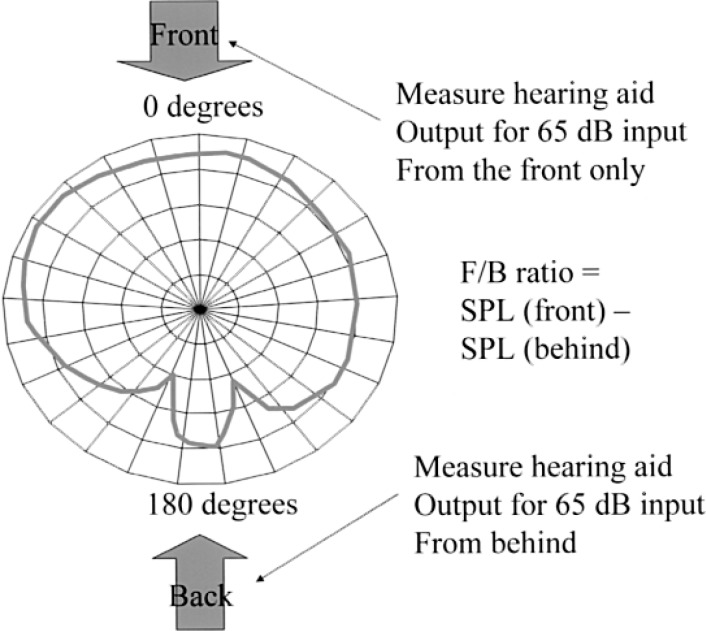
Objective hearing aid measurements, including probe microphone measurements, are superior to behavioral measurements for assessing the technical performance of directional and beamforming microphone arrays. That is, a simple front-to-back ratio (FBR) real-ear measurement (Figure 9) can help clinicians determine whether the directional microphone is performing adequately, prior to measuring speech recognition in noise on individual patients. Furthermore, now that an increasing number of hearing aids use multiple and adaptive beamforming microphone array processors, it is important to develop verification techniques to ensure that these algorithms are working properly. Without actually measuring performance, the practitioner has no means of differentiating lack of patient benefit from poor technical performance.
Figure 9.
Sample front-to-back measurement for assessing directional microphone performance. Abbreviations: SPL, sound pressure level
Although it is not feasible for most clinicians to evaluate the dynamic properties of adaptive beamforming array processors, it is important to consider whether it is feasible to assess changes in directivity patterns that occur across different listening situations. Similar to the above, although behavioral measurements are very useful for determining individual benefit from hearing aids, they provide little utility for assessing technical performance of advanced signal-processing strategies. This includes the inability to easily assess the impact of volume control adjustments on hearing aid gain and output, multiple hearing aid programs, telecoil, and FM performance, feedback reduction strategies, occlusion management, and other emerging technologies.
Issue 6: Acoustic Matching of the Hearing Aid to the Hearing Aid User is Essential
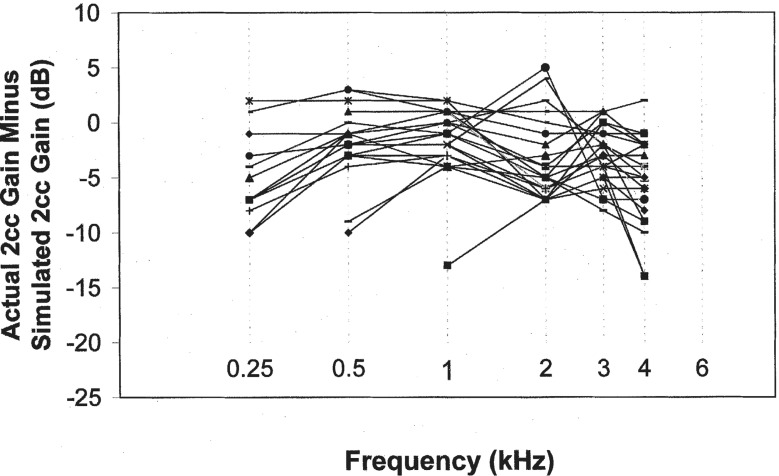
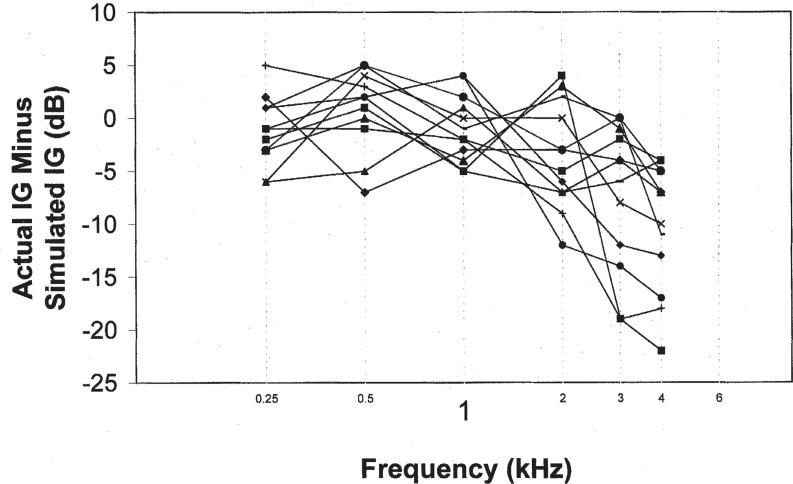
A recent paper by Hawkins and Cook (2003) evaluated the accuracy of hearing aid software predictive gain values in terms of coupler and real-ear measured gain for individual patients. They measured commercially available hearing aids from four manufacturers in a clinical test environment. Their findings suggested that software gain typically overpredicted actual 2-cc coupler gain values, in some cases exceeding 10 dB (Figure 10). Insertion gain results showed even greater differences; simulated gain always indicated more high-frequency gain than was present in situ, and for 6 of the 12 patients, simulated gain at 4000 Hz exceeded insertion gain values by more than 10 dB (Figure 11). Their conclusion was that “… if you want to know what the actual hearing aid is doing on the patient who is going to be wearing it, you need to make a validation measurement in situ …”
Figure 10.
Difference between measured 2-cc coupler gain and software-simulated 2-cc coupler gain for 28 hearing aids. Negative values indicate that software-simulated values are less than measured 2-cc coupler gain values. From Hawkins and Cook (2003), Figure 1.
Figure 11.
Difference between measured insertion gain (IG) and software-simulated insertion gain for 12 patients. Negative values indicate that software-simulated values are less than measured insertion gain values. From Hawkins and Cook (2003), Figure 2.
Although the magnitude of the difference reported by Hawkins and Cook (2003) was rather large, it is not surprising that measured insertion gain varied from prescribed gain values. Manufacturer precalculations of prescribed gain require correction factors for earmold/shell type, microphone location effects (MLE), venting, receiver tubing dimensions, and residual ear canal volume. Cumulatively, these factors comprise the appropriate coupler response for flat insertion gain (CORFIG) when added to 2-cc coupler gain (Killion and Monser, 1980).
Unlike 2-cc coupler measurements, CORFIG computations are not regulated by ANSI standards; therefore, they may differ substantially across manufacturers. In fact, the match between predicted and measured insertion gain for an individual patient is directly related to a manufacturer's ability to provide accurate CORFIG data. In reality, simulated values based on corrections cannot replace empirical measurements on individual patients. Although optimal aided thresholds may be used to assess individual CORFIGs, they do not provide comparable precision, repeatability, and portability to real-ear measurements, for the previous reasons. Regardless, however, either method is preferable to the exclusive use of precalculated target gain values from simulated data.
Conceding that clinical efficacy is an oft-cited reason for not acoustically matching hearing aid characteristics to individual ears, researchers continue to develop other methods for empirically verifying the difference between coupler and real-ear measurements. One approach, called the real-ear-to-coupler difference (RECD), solves some of the problems with simulated insertion responses by serving as one component of a “personalized” CORFIG. Using this method, which is particularly useful for infants and young children, clinicians can make one real-ear measurement and then apply subsequent hearing aid adjustments in the 2-cc coupler with confidence that they will correlate strongly with hearing aid output in the ear.
At issue is whether an individualized RECD is a necessary and sufficient measurement for comparing coupler response to real-ear response. Technically speaking, CORFIG includes measurement of real-ear unaided gain (REUG), MLE, and RECD. Although REUG has historically been used to measure insertion gain (real-ear insertion gain = real-ear aided gain - real-ear unaided gain), whether average REUG values are more appropriate for measuring real-ear insertion gain (REIG) in individual patients has been debated (Revit, 1991). The rationale for this argument is that most prescriptive fitting methods are referenced to sound-field thresholds, while earphone thresholds are typically used for prescriptive target calculations. If the argument may be made that it is appropriate to use average REUG, then personalized CORFIG comprises assessment of MLE and RECD for individual patients. Fortunately, RECD can be measured in several ways, including methods that incorporate MLE with RECD, called the transform for estimating real-ear output (TEREO) (Seewald et al., 1997; Mueller and Hall, 1998). Essentially, it boils down to whether the patient's own hearing aid or a sound source that is coupled to a foam plug or the patient's earmold is used to measure the RECD
The “old fashioned” RECD measurement (TEREO), which incorporates RECD and MLE, is described as follows. First, the 2-cc coupler should be used to measure the hearing aid coupler response at a defined volume control setting (if appropriate) for a 50-dB SPL input stimulus (tone or narrowband noise). The hearing aid should then be removed from the coupler and placed on the patient's ear without changing the volume control wheel. The same stimulus level and type is used to measure the real-ear aided response (REAR); RECD is REAR minus the coupler response for each frequency region evaluated. This technique to make RECD measurements provides an improved prediction of real-ear gain from coupler gain when averaged correction values are used (Fikret-Pasa and Revit, 1992).
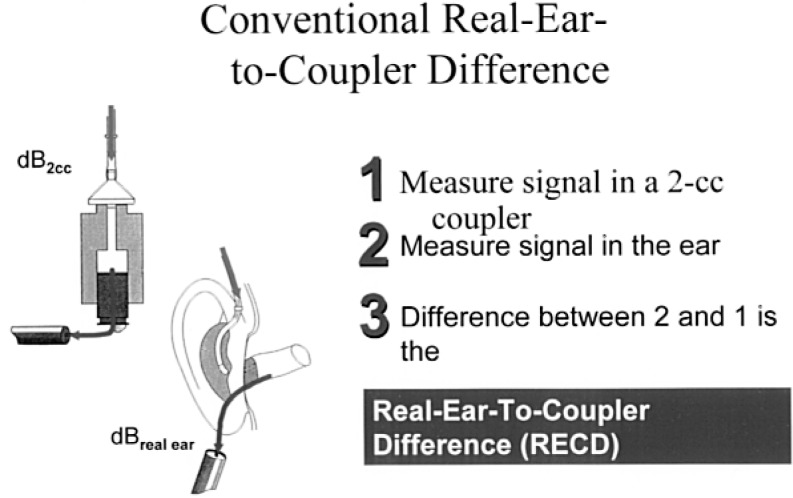
The risk of this TEREO method is that some fitting formulae already add the MLE prior to deriving target gain; hence, MLE would be added twice and target gain values would likely underfit the patient. A simple way to verify whether or not a given prescriptive fitting formula (eg, DSL 4.1a, NAL-NL1) uses RECD values that incorporate MLE is to see if the numbers change when different hearing aid styles and therefore, MLE, are selected in the software. If the numbers don't change, MLEs are incorporated separately from RECD, and RECD should be measured independent of hearing aid style. To that end, Moodie et al. (1994) have described a method for RECD that uses an insert earphone for the sound source to deliver stimuli to the patient's earmold (Figure 12). First, a signal is measured in the 2-cc coupler by the use of a signal from the insert earphones and measured with a probe microphone. The same signal is then presented to the ear (using foam inserts or preferably with the patient's custom earmold). The signal is again measured using the probe microphone. The difference between the output measured in the coupler and in the ear is the RECD.
Figure 12.
An insert earphone and the patient's earmold are used to obtain the conventional real-ear-to-coupler difference (RECD) measurement.
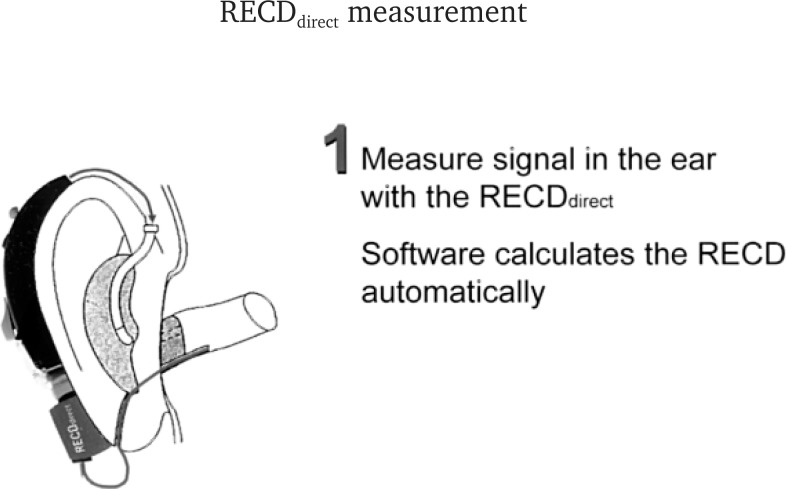
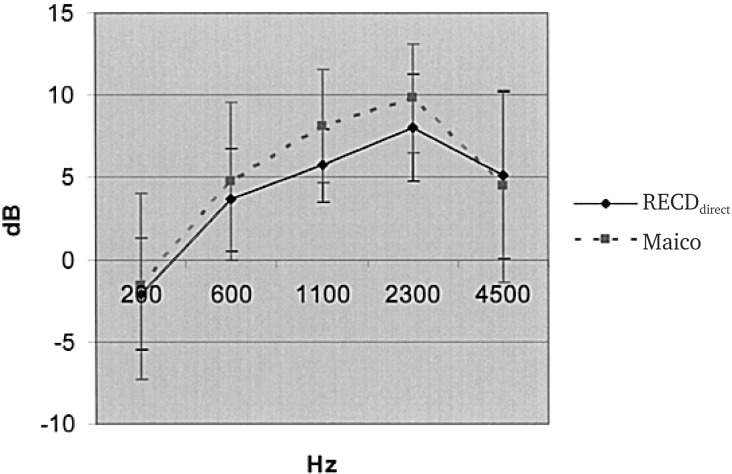
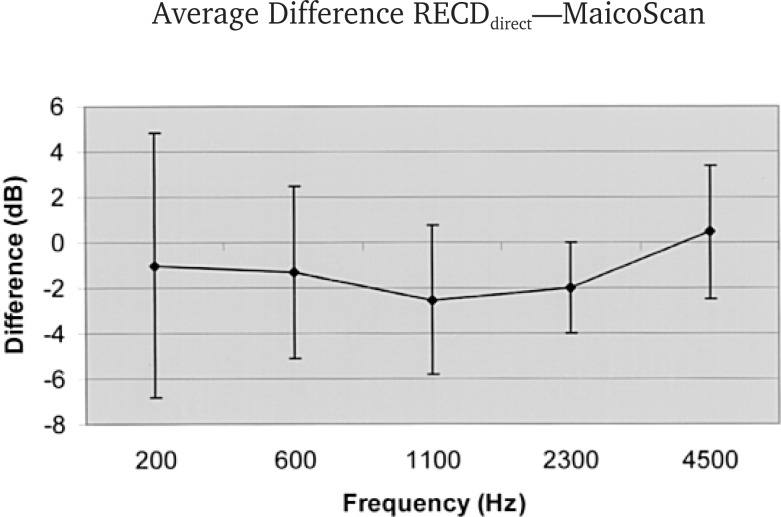
More recently, a third method involves using direct assessment of RECD (RECDdirect) while programming the hearing aid (Figure 13). This approach automatically compares the REAR to coupler response values to derive individual RECDdirect corrections. The results of a recent study that compared RECDdirect measures to conventional RECD measurements (Bohnert, 2003) revealed an average difference of less than 2 dB across five test frequencies (Figures 14 and 15). This approach is less time consuming than traditional RECD measurements or real-ear measurements and more precise than optimal aided-threshold measures or average CORFIG values (Fikret-Pasa and Revit, 1992). Additionally, because the hearing aid is generating the stimulus (rather than picking up sounds through the hearing aid microphone), the RECDdirect procedure is also MLE-independent.
Figure 13.
Real-ear-to-coupler difference (RECD) measurement is calculated directly by the use of an integrated SPL measurement and coupler comparison.
Figure 14.
Real-ear-to-coupler difference (RECD) measurement, computed via conventional approach (Figure 12) and by RECDdirect procedure (Figure 13) for a group of 30 subjects, aged 6 months to 12 years. Bohnert (2003).
Figure 15.
Average difference, in dB, between the real-ear-to-coupler difference (RECD) measurement computed via the two methods used in Figure 14. From Bohnert (2003).
In summary, acoustically matching hearing aid characteristics to residual ear canal volume may be one of the most overlooked attributes of hearing aid function, particularly as it relates to localization and overall sound quality. Although the in situ measurement of hearing aids via the optimal aided threshold indirectly matches the acoustic performance by achieving the target of uniform aided threshold, these data are not quantifiable, portable, or accurate enough to provide a binaural acoustic “match” with the same precision that is afforded by real-ear measurements.
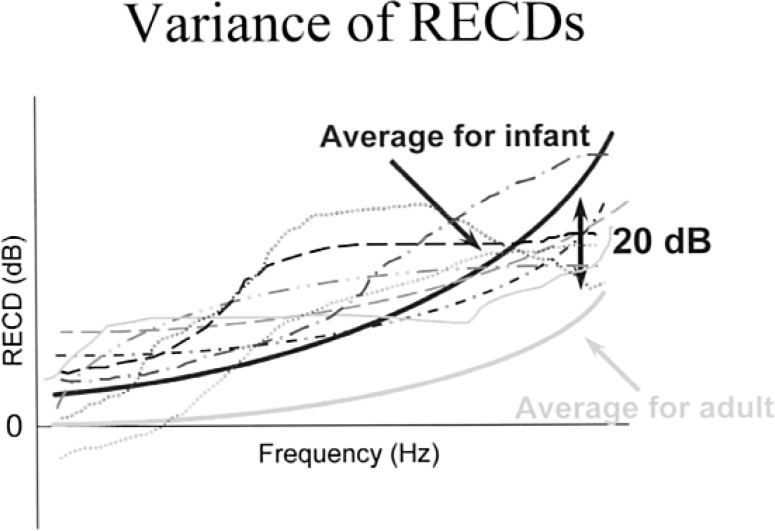
Perhaps the most compelling argument for use of real-ear measurements may be for pediatric applications, because their RECDs have been shown to differ dramatically from adult values (Figure 16). Furthermore, many young children are not able to complete functional gain or optimal aided-threshold measurements, or they may have poorer test-retest variability than for adult patients. Although probe microphone measurements or custom CORFIGs will provide the greatest precision for assessing insertion gain, simplified RECD measurements (eg, RECDdirect) provides clinicians with a way of efficiently changing hearing aid characteristics with minimal patient involvement.
Figure 16.
The importance of measuring individual real-ear-to-coupler difference (RECD), as evidenced by individual RECDs assessed across different ages, along with average measurements for infants and adults.
Digital flexibility is useless without audibility; at issue is whether average REUG and MLE corrections, plus measured RECD, will improve acoustic matching between the hearing aid and hearing aid user. Additional research is required to support the hypothesis that these customized predictions (using RECD and DSL 4.1a, NAL-NL1) provide superior benefit to measurements of optimal aided thresholds in adults. The results for pediatric and difficult-to-test populations are unequivocal, because many are unable to complete the necessary behavioral evaluation with sufficient reliability.
Issue 7: Important Considerations Related to the Development of an Effective Clinical Test Protocol for Initial Hearing Aid Verification
As stated previously, hearing aid gain is useless if the patient cannot hear it. Therefore, some assessment of aided auditory function should be completed to verify audibility for speech and other sounds. At issue is how to make a test protocol practical without compromising accuracy. To that end, factors should be considered include:
Clinicians are encouraged to use clinical verification of prescriptive target gain values at the time of the initial fitting, rather than rely on the manufacturer's display of “simulated” hearing aid gain and output. This “acoustic matching” of hearing aids to individual ears should be completed via in situ measurements (CORFIG or RECD) prior to the application of target gain values as an essential first step towards a successful outcome.
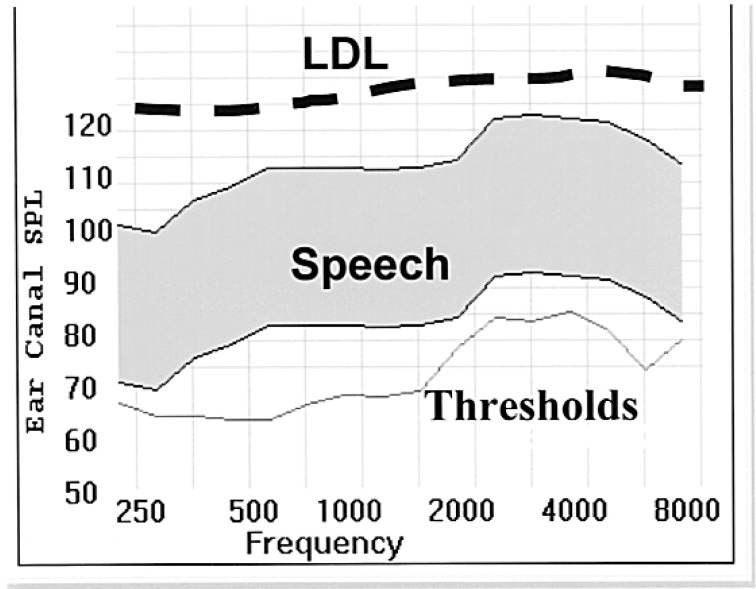
All measurements should be referenced to a consistent and definable reference measurement standard. Pascoe (1978), Seewald and Ross (1988), and Skinner (1988) all used approaches that referenced threshold, speech, and loudness levels relative to dB SPL measured in the ear canal, and plotted values using the “SPLogram” representation (Figure 17).
Real-ear measurements provide greater accuracy and precision than functional gain or optimal aided threshold, particularly for determining gain levels for “typical” listening environments (eg, conversational speech levels in quiet). In addition, real-ear measurements should be used to assess hearing aid MPO; however, clinicians are advised that when they are using pure tone or composite noise stimuli to evaluate modern hearing aids, the DNR circuitry should be disabled, or actual use gain will be underestimated. Real-ear measurement systems should be updated with “digital” noise (eg, ICRA) or “real” speech when they are used with nonlinear signal-processing hearing aids.
Nonlinear fitting formulae, such as NAL-NL1 (Byrne et al., 2001) or DSL 4.1a (Seewald et al., 1997), are designed specifically for use with compression hearing aids and provide different prescriptive targets for soft, average, and loud sounds. For average speech levels, however, NAL-NL1 prescriptive targets are very similar to the original NAL-R formula (Byrne and Dillon, 1986) developed for use with linear hearing aids, and those targets still serve as a reasonable basis for conversational speech. When used with compression hearing aids, however, single-target prescriptive formulae tend to underestimate desired gain for soft sounds. Therefore, clinicians are advised to either use a prescriptive formula designed for use with nonlinear hearing aids (eg, NAL-NL1, DSL 4.1a) or supplement traditional formulae (NAL-R) with behavioral measures, such as optimal aided thresholds to achieve target gain for soft sounds.
Clinicians should empirically evaluate advanced signal-processing features, when possible. This includes assessment of directional microphones, multichannel compression, DNR circuitry, telecoil function, occlusion/feedback managers, and FM. This verification may be accomplished through a combination of objective and behavioral measurements.
Figure 17.
SPLogram shows auditory thresholds, long-term speech spectrum (shaded region) and loudness discomfort levels (dashed line) for an individual patient. Abbreviation: LDL, loudness discomfort level; SPL, sound pressure level.
A Verification Protocol for Use with Nonlinear Hearing Aids
Using the criteria above as a guideline, a clinically relevant protocol for initial verification of nonlinear hearing aids is governed by the maxim that (unlike children), hearing aid gain should be seen and heard. That is, seen as REIG on the computer monitor, and heard by the patient. The case of “auditory dead regions” (Moore et al., 2000) provides an excellent example for this. Although this term is relatively new, the literature has described the phenomenon for decades (Skinner, 1980; Rankovic, 1989). Basically, auditory dead regions refer to regions on the cochlea where providing audible information is not useful or even deleterious. Several researchers have developed recommendations (Ching et al., 1998; Hogan and Turner, 1998) or diagnostic tests (Moore et al., 2000) for auditory dead regions, but fundamentally, the clinician must determine whether the patient will benefit from the use of audible information in a specific frequency region prior to applying massive amounts of gain.
Treatment options are a topic for another day, but the fundamental issues related to auditory dead regions point to the need for verification measures that evaluate gain and hearing. For purposes of the present discussion, auditory dead regions will be defined as 1) thresholds in excess of 90 dB HL, or 2) dynamic range (threshold to uncomfortable loudness) of less than 10 dB, or 3) patient reports hearing a noise or air, rather than a tone, when the stimulus is presented.
Conversion of Audiometric Information to SPL
All unaided and aided measures should be expressed by the use of a consistent reference point (dB SPL in the ear canal) and plotted on the same SPLogram (Figure 17). Therefore, audiometric thresholds must be converted from dB HL to dB SPL in the ear canal, and most real-ear measurement equipment uses average conversion values for real-ear dial difference (REDD), which is the combination of the averaged or customized RECD and the difference between the HL dial setting and the 2-cc coupler for the audiometer (RET-SPL) to automatically transform thresholds from HL to ear canal SPL. Individual REDD values may also be measured, but it requires that the audiometer and real-ear test equipment be in close proximity. To measure REDD for individual patients (eg, Munro and Lazenby, 2001), clinicians need to
Place the probe microphone in the patient's ear to the desired depth. For adults, 30 mm marked from the tragal notch will provide test-retest measures of ±2 dB for frequencies below 5000 Hz, according to Gilman and Dirks (1986).
For each audiometric frequency, deliver the pure-tone stimulus through insert or supra-aural earphones (whichever was used for audiometric evaluation) at 70 dB HL.
Use the real-ear analyzer in the “signal analysis” mode (no test signal generated through the real-ear equipment) to measure dB SPL in the patient's external auditory canal.
The REDD for that frequency is determined by subtracting the HL dial setting from the ear canal SPL reading (eg, 79-dB SPL - 70-dB HL - 9-dB REDD at 1000 Hz).
Add the correction factor to the dB HL threshold (eg, 49-dB HL + 9 dB = 49-dB SPL threshold at 1000 Hz) and pure-tone loudness discomfort levels (if applicable) and plot on the SPLogram.
Map Residual Auditory Area on the SPLogram
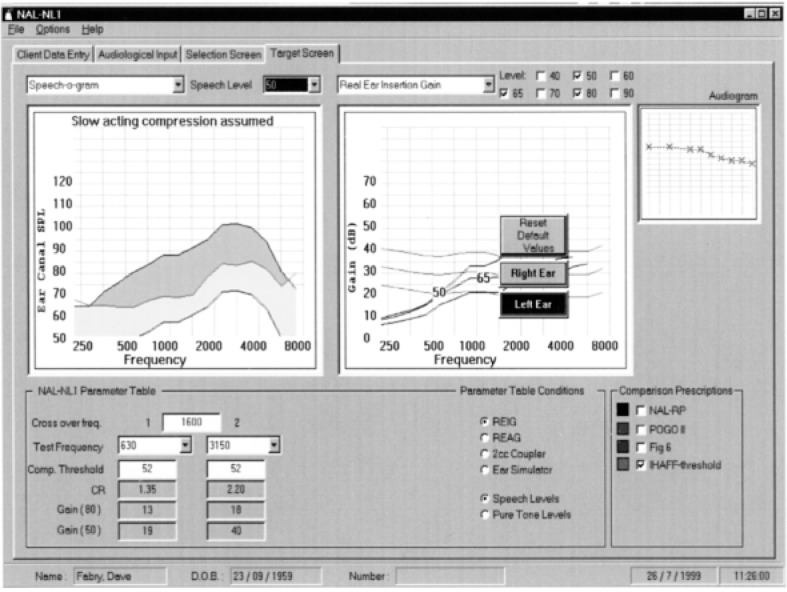
After thresholds and discomfort thresholds (calculated or measured) have been plotted on the SPLogram, the patient's residual auditory area is mapped, and appropriate prescriptive targets may be applied for soft, moderate, and loud sounds (Figure 18). This enables the clinician to visualize gain and output targets and associated speech audibility for different input levels.
Figure 18.
SPLogram data, from National Acoustic Laboratory-Nonlinear (NAL-NL) software program, illustrates patient's residual auditory area (shaded region, left panel). The right panel shows insertion gain targets for soft, moderate, and loud input stimuli. Abbreviation: FIG, flat insertion gain; IHAFF, independent hearing aid fitting formula; POGO, prescription for gain and output; REAG, real-ear aided gain; REIG, real-ear insertion gain; SPL, sound pressure level.
Acoustically Match Hearing Aid to Patient's Ear
“Simulated” real-ear gain and output will vary across manufacturers, based on use of different CORFIG values (CORFIG = REUG - RECD + MLE). Ideally, clinicians should customize CORFIG for individual patients by measuring REUG and RECD (with or without MLE incorporated) to optimize acoustic matching between the hearing aid and individual ear, prior to the application of target gain and output. A simpler alternative is to use average REUG and measured RECD (with RECD, TEREO, or RECDdirect). Keep in mind that MLE is incorporated into the RECD when TEREO is used. Clinicians should be aware of whether their selected prescriptive fitting approach (eg, DSL 4.1a or NAL-NL1) already includes average MLEs, so that they are not included twice.
A combination of the two methods is to measure REUG and RECDdirect, and use the average MLE provided by the fitting software to acoustically match the hearing aid to individual ears. It stands to reason that use of measured RECD or REUG will optimize CORFIG measurements, versus the average CORFIGs used by most fitting software programs. This “acoustic matching” is critical to speech quality and intelligibility; therefore, the use of average data should be avoided when possible. Of course, RECD and real-ear measurement may be difficult for pediatric and difficult-to-test patients; in those circumstances, age-appropriate RECD corrections may be used (Bagatto et al., 2002).
Application of Target Gain Settings
Subsequent to acoustical matching, the hearing aid is programmed with precalculated target gain values, based on the degree and type of hearing loss, dynamic range tests, loudness growth measures (if applicable), and other diagnostic tests (eg, auditory dead regions). Optimization of these settings is achieved through verification measurements, including behavioral (in situ, functional gain, optimal aided threshold) and objective real-ear measurements.
Assess Maximum Gain for Soft Sounds
A number of techniques may be used, including optimal aided threshold (in situ or sound field) or with real-ear measurements, by presenting a 50-dB SPL stimulus at 0° azimuth. For each method, adjust gain values, as a function of frequency, to: 1) optimize audibility for soft sounds by achieving a uniform hearing level (optimal aided threshold), or 2) ensuring that a 50-dB SPL test stimulus is supra-threshold for as broad a frequency range as possible (real-ear).
Verification of Prescriptive Gain Targets for Conversational Speech Levels
Subsequent to setting maximum gain, real-ear measurements should be used to ensure that conversational-level speech (65-dB SPL) meets target criteria for linear (eg, NAL-R) or midlevel nonlinear (NAL-NL1, DSL 4.1a) formulae. Typically, this will involve setting frequency-specific compression parameters (compression ratio and possibly compression threshold) to optimize comfort and audibility for speech. Without changing the hearing aid volume control (if applicable) from the previous step, use a 65-dB SPL “digital” stimulus (eg, ICRA noise) or “real” speech stimulus (if the real-ear system in use has this feature) to verify the match-to-target gain on the SPLogram by adjusting the compression ratio. Ideally, the compression threshold and compression ratio should be as low as possible to achieve this match.
Use Real-Ear Measurements to Verify Hearing Aid Maximum Power Output
This verification step is extremely important, particularly for pediatric patients and patients with sever-to-profound hearing loss. Essentially, these measurements are conducted to make sure that the hearing aid MPO does not exceed the “comfort” levels of patient or the clinician. Unfortunately, this step is often omitted (or minimized) from clinical verification procedures for fear of producing loudness discomfort in the patient. The reality is that when hearing aid MPO is set accurately, neither too high nor low relative to the patient's loudness discomfort level (LDL), input dynamic range is optimized, particularly for patients with greater degrees of hearing loss.
Fortunately, many of the latest hearing aids permit frequency-specific MPO adjustments to be made, and this flexibility should be used. Ideally, a number of pure-tone or narrowband stimuli (equivalent to the number of independently adjustable compression bands) should be presented at a 85-dB SPL at 0° azimuth. RESR measurements should approach, but not exceed, the measured or predicted LDL for that frequency range (recall that REDD has been already used to convert the patient's LDL in HL to ear canal SPL so direct comparison to target values can be made). After setting MPO independently for all compression bands, a broadband noise or speech input should be presented at 85-dB SPL, to verify that loudness summation across bands does not produce discomfort. Keep in mind that hearing aid MPO is considerably (15 to 20 dB) higher for pure tones than for broadband noise or speech.
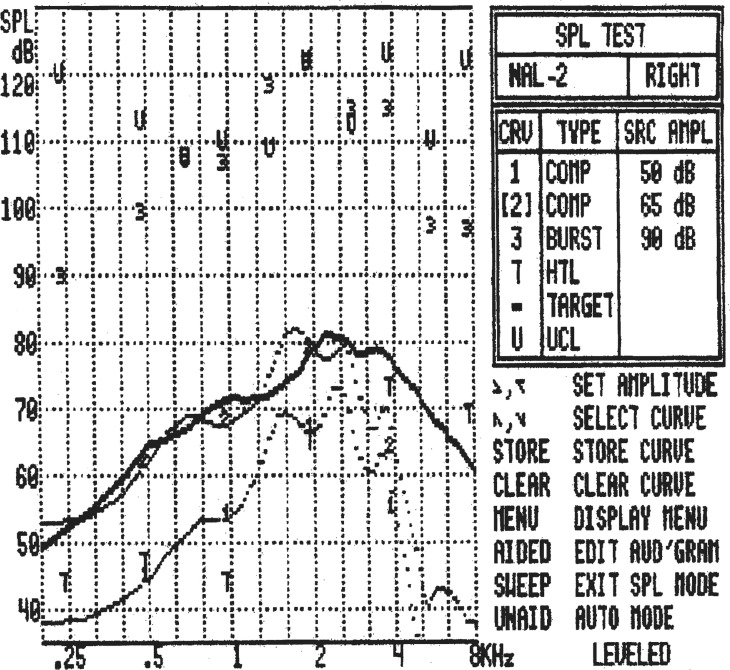
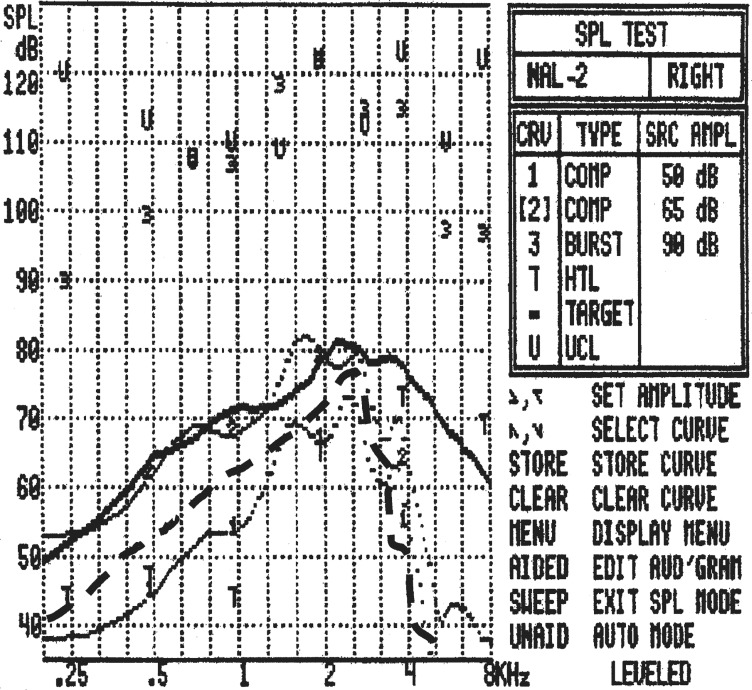
Although clinicians need to exercise caution when they evaluate RESR, it is perhaps the most important stage of clinical verification. If MPO is set properly, the hearing aids will optimize residual dynamic range, while protecting the user from loudness discomfort in the “real world.” Figure 19 shows a completed SPLogram with a good match to low, moderate, and high prescriptive target gain.
Figure 19.
Real-ear measurements, using SPLogram format, that indicate: the 50-dB SPL composite signal is suprathreshold (above “T” values), the 65-dB SPL stimulus matches NAL-R target, and the 90-dB brief tone burst stimuli do not exceed patients LDL (UCL on chart, indicated as “U”). Abbreviation: NAL-R, National Acoustic Laboratories-Revised.
Assessment of Advanced Signal-Processing Features
The final step in the initial verification protocol involves the evaluation of whether advanced signal-processing features are functioning properly. According to recent surveys, directional microphones now comprise nearly 30% of new hearing aids sold, but very few clinicians use any form of empirical evaluation of their performance. This is not to suggest that practitioners need to purchase an anechoic chamber to make their own polar plot measurements, but rather to suggest a couple of additional measurements that will indicate how the microphones are working.
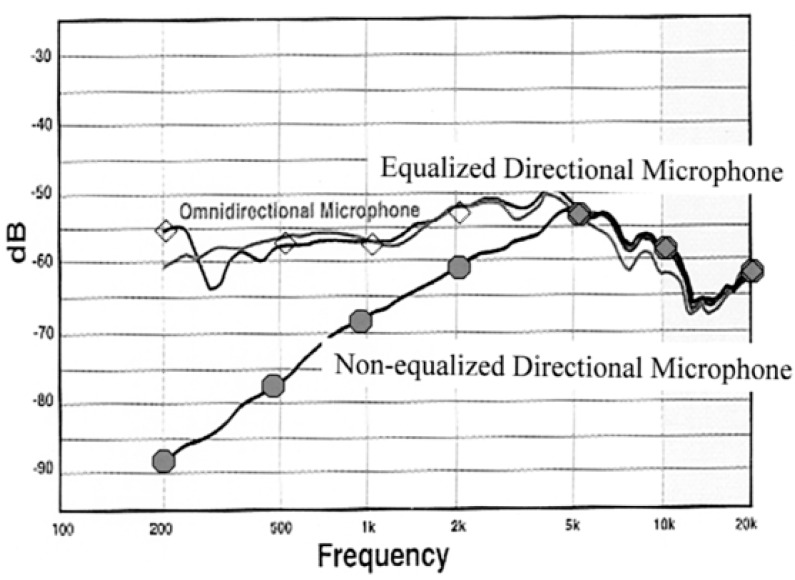
First, it is useful and easy to determine whether an equalized or nonequalized directional microphone is in use. With the speaker located at 0° azimuth, measure and store REAR in an omnidirectional mode for an input of 65-dB SPL. Without changing the volume control, engage the directional microphone and repeat the measurement. If the REARs of the two measurements overlap, an equalized directional microphone is in use (Figure 20). More commonly, if the directional microphone response indicates a low-frequency rolloff below 1 to 2 kHz, a nonequalized directional microphone is in use.
Figure 20.
Real-ear measurements for equalized and nonequalized directional microphones compared to omnidirectional microphone, for composite noise measurements at 0° azimuth.
One of the reasons for the “wow” effects often reported with directional microphones is this low-frequency rolloff, which is independent from the directivity benefits afforded when speech and noise are spatially separate. This low-frequency attenuation is not a problem for most hearing aid users with mild-to-moderate hearing losses, but it may affect audibility for patients with severe-to-profound hearing loss. As a result, clinicians may want to be sure that speech audibility is not affected if a nonequalized directional microphone is used; if so, they may wish to reprogram the hearing aid to compensate for this attenuation. Without verification, however, clinicians will be leaving this issue to chance.
Second, another measurement that clinicians may wish to make is a real-ear FBR. Use the same 0° for loudspeaker placement to present a digital noise signal or real speech at 65-dB SPL to measure REAR. Store this measurement, then turn the patient around (a swivel chair works well for this) until the loudspeaker is now located at 180° and repeat the measurement. The difference between these two REARs is the real-ear FBR (Figure 21). This works well for visualization of the real-ear FBR effect, but if the actual FBR values are desired, the real-ear system can be used to calculate and plot them with a simple variation on this measure (see Mueller, 2001). First, do the 180° REAR measurement and store it as an REUG. Then, swivel the patient back to 0° azimuth and measure REAR. For most systems, the 180° response will be automatically subtracted from the 0° measurement, leaving the real-ear FBR measurement expressed as the REIG.
Figure 21.
Real-ear measurements for real-ear front-to-back ratio (FBR) procedure, measured at 65-dB SPL for 0° (solid) and 180° azimuth.
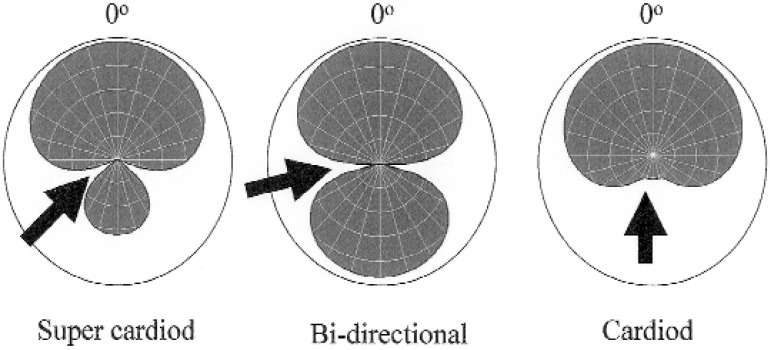
A final measurement may be used to verify the performance of hearing aids that allow different directional microphone polar patterns to be used in different hearing aid memories. Use the 0° azimuth measurement from the real-ear FBR and seat the patient in the swivel chair. Have the patient rotate until the test signal is perceived to be the softest, which should occur at one of the “nulls” in the polar plot (Figure 22). This simple procedure may be used to demonstrate the function and also to counsel the patient regarding use of the hearing aid memories in different listening situations.
Figure 22.
Sample polar plots, indicating null regions for supercardiod (left), bidirectional (center) and cardiod (right) response. Behavioral verification may be assessed by rotating the patient in a swivel chair until the signal is maximally attenuated.
These measurements will add only a few minutes to the test protocol but may save counseling time, as well as embarrassment, if the directional microphones are not working. Speech measures, such as the Revised Speech in Noise (R-SIN) (Cox et al., 2001) or the Hearing in Noise Test (HINT) (Nilsson et al., 1984) may also be used for verification, but they are more time consuming. Verification of other attributes, including occlusion and feedback, is possible, but these are often incorporated into the manufacturer's fitting software. Often, these methods employ behavioral responses from the patient, but several attempts have been made to provide an effective technique to measure the occlusion effect with probe microphone measurements (eg, Killion et al., 1988).
In summary, real-ear and behaviorally aided measurements both provide information related to verification of hearing aid fitting goals. That said, relying exclusively on functional gain or optimal aided threshold as a method of fitting verification does not meet the two main criteria of a good assessment: validity (does it test what it is supposed to test?) and reliability (do repeated measures yield the same results?). If the goal is to provide pediatric and adult hearing aid users with audible yet comfortable speech for a range of inputs, then optimal aided threshold is not a valid indicator of hearing aid performance. Measuring the softest narrowband sounds that can be heard is not the same thing and is subject to even more interactions with such things as feedback cancellers, DNR systems, and multiple channels, than measuring with the speech-weighted inputs that most test systems use for real-ear measurements. Furthermore, it doesn't provide any information regarding comfort and safety that relates to hearing aid MPO. As for reliability, the data stand for themselves: Real-ear measurements are much more reliable than either functional gain or optimal aided threshold. Behavioral measures should be used to verify hearing, but real-ear measurements should serve as the primary means of setting hearing aid parameters.
References
- American National Standards Institute (1996). Specification for Audiometers. ANSI S3.6–1996 Acoustical Society of America. New York, New York.
- American National Standards Institute (1996). Specification of Hearing Aid Characteristics, S3.22–1996. Acoustical Society of America, New York, New York. [Google Scholar]
- Bagatto M, Scollie S, Seewald R, Moodie K, Hoover B. Real-ear-to-coupler difference predictions as a function of age for two coupling procedures. J Am Acad Audiol 12: 407–415, 2002 [PubMed] [Google Scholar]
- Bohnert A. Personal communication regarding ongoing study at Clinica for Communication Disorders, Mainz, Germany, 2003
- Byrne D, Dillon H. The National Acoustic Laboratories' (NAL) new procedure for selecting the gain and frequency response of a hearing aid. Ear Hear 7: 257–265, 1986 [DOI] [PubMed] [Google Scholar]
- Byrne D, Dillon H, Ching T, Katsch R, Keidser G. NAL-NL1 procedure for fitting nonlinear hearing aids: Characteristics and comparisons with other procedures. J Am Acad Audiol 11: 37–51, 2001 [PubMed] [Google Scholar]
- Ching T, Dillon H, Byrne D. Speech recognition of hearing-impaired listeners: Predictions from audibility and the limited role of high-frequency amplification. J Acoust Soc Am 103 (2): 1128–1140, 1998 [DOI] [PubMed] [Google Scholar]
- Cox RM, Gray G, Alexander G. Evaluation of a Revised Speech in Noise (RSIN) test. J Am Acad Audiol, 11: 423–432, 2001 [PubMed] [Google Scholar]
- Fikret-Pasa S, Revit L. Individualized correction factors in the preselection of hearing aids. J Speech Hear Res 35: 384–400, 1992 [DOI] [PubMed] [Google Scholar]
- Gilman S, Dirks D. Acoustics of ear canal measurement of eardrum SPL in simulators. J Acoust Soc Am 80 (3): 783–93, 1986 [DOI] [PubMed] [Google Scholar]
- Hawkins DB. Clinical ear canal probe tube measurements. Ear Hear 8 (Supp 5): 74S–81S, 1987 [DOI] [PubMed]
- Hawkins DB, Montgomery A, Prosek R, Walden B. Examination of two issues concerning functional gain measurements. J Speech Hear Disord 52: 56–63, 1987 [DOI] [PubMed] [Google Scholar]
- Hawkins DB, Alvarez E, Houlihan J. Reliability of three types of probe tube microphone measurements. Hear Instru 42: 14–16, 1991 [Google Scholar]
- Hawkins DB, Cook J. Hearing aid software predictive gain values: How accurate are they? Hear J 56 (7): 26–34, 2003 [Google Scholar]
- Hearing Industries Association (2003), Hearing Aid Statistics, available online at www.hearing.org Last accessed 9–10-2003
- Hogan C, Turner C. High-frequency audibility: Benefits for hearing-impaired listeners. J Acoust Soc Am 104 (1): 432–441, 1998 [DOI] [PubMed] [Google Scholar]
- Humes L, Kirn E. The reliability of functional gain. J Speech Hear Disord 55: 193–197, 1990 [DOI] [PubMed] [Google Scholar]
- Killion M. Page Ten: http//www.compression.edu Hear J 10: 44–46, 1996 [Google Scholar]
- Killion M, Monser EL. CORFIG: Coupler Response for Flat Insertion Gain. In: Studebaker GA, Hochberg I. (eds): Acoustical Factors Affecting Hearing Aid Performance, Baltimore:University Park Press, 1980, pp 147–168 [Google Scholar]
- Killion M, Studebaker GA. A-weighted equivalence of permissible ambient noise during audiometric testing. J Acoust Soc Am 63: 1633–1635, 1978 [Google Scholar]
- Killion MC, Wilber LA, Gudmundsen GI. Zwislocki was right. … Hear Instru 39 (1): 14–18, 1988 [Google Scholar]
- Kirkwood DH. Survey of dispensers finds little consensue on what is ethical practice. Hearing Journal 56 (3): 19–26, 2003 [Google Scholar]
- Kuk F, Ludvigsen C. Reconsidering the concept of the aided threshold for nonlinear hearing aids. Trends Ampli 2003. (in press). [DOI] [PMC free article] [PubMed]
- Moodie KS, Seewald RC, Sinclair ST. Procedure for predicting real-ear hearing aid performance in young children. J Am Acad Audiol 3: 23–31, 1994 [Google Scholar]
- Moore BCJ, Huss M, Vickers D, Glasberg B, Alacantrara J. A test for the diagnosis of dead regions in the cochlea. Br J Audiol 34: 205–224, 2000 [DOI] [PubMed] [Google Scholar]
- Mueller HG. Probe microphone measurements: 20 years of progress. Trends Ampli 5: 35–68, 2001 [DOI] [PMC free article] [PubMed] [Google Scholar]
- Mueller HG, Hall JW. Audiologists' Desk Reference. San Diego: Singular Publishing Group, 1998 [Google Scholar]
- Munro K, Lazenby A. Use of the ‘real-ear to dial difference’ to derive real-ear SPL from hearing level obtained with insert earphones. Br J Audiol 35 (5): 297–306, 2001 [DOI] [PubMed] [Google Scholar]
- Nilsson M, Soli S, Sullivan J. Development of the Hearing in Noise Test for the measurement of speech reception thresholds in quiet and in noise. J Acoust Soc Am, 95 (2): 1085–1099, 1994 [DOI] [PubMed] [Google Scholar]
- Pascoe D. Frequency responses of hearing aids and their effects on the speech perception of hearing-impaired subjects. Ann Otol Rhinol Laryngol 84 (5 pt 2 Suppl 23): 1–40, 1975 [PubMed] [Google Scholar]
- Pascoe D. An approach to hearing aid selection. Hear Instru 34: 12– 16,, 36, 1978 [Google Scholar]
- Rankovic CM. “An application of the articulation index to hearing aid fitting.” Unpublished dissertation, University of Minnesota, 1989 [DOI] [PubMed]
- Revit LJ. An open letter: New thinking on the proper application of real-ear measurements to prescriptions and fittings. N Z J Audiol 1: 1–17, 1991 [Google Scholar]
- Ringdahl A, Lejon A. The reliability of insertion gain measurements using probe microphones in the ear canal. Scand Audiol 13: 173–178, 1984 [DOI] [PubMed] [Google Scholar]
- Seewald R, Ross M. Amplification for young hearing-impaired children. In: Pollack M. (ed): Amplification for the Hearing-Impaired, Orlando, FL: Grune and Stratton, 1988, pp. 213–271 [Google Scholar]
- Seewald RC, Cornelisse LE, Ramji KV, Sinclair ST, Moodie KS, Jamieson DG. A software implementation of the Desired Sensation Level (DSL[i/o]) method for fitting linear gain and wide dynamic range compression hearing instruments: Version 4.1a. User's Manual. London: The University of Western Ontario, 1997
- Seewald RC, Cornelisse LE, Richert FM, Block MG. Acoustic transforms for fitting CIC instruments. In: Chasin M. (ed): CIC Handbook. San Diego: Singular Publishing Group, 1997, pp 83–100 [Google Scholar]
- Skinner M. (1980). Speech intelligibility in noise-induced hearing loss: Effects of high-frequency compensation J Acoust Soc Am. 67 (1): 306–317 [DOI] [PubMed] [Google Scholar]
- Skinner M. Hearing Aid Evaluation. Englewood Cliffs, NJ: Prentice Hall, 1988 [Google Scholar]
- Stuart A, Dureieux-Smith A, Stenstrom R. Critical differences in aided sound field thresholds in children. J Speech Hear Res 33: 612–615, 1990 [DOI] [PubMed] [Google Scholar]


