

Abstract
Epigenetic changes including DNA methylation caused by environmental exposures may contribute to the heterogeneous inflammatory response in asthma. Here we investigate alterations in DNA methylation of purified blood monocytes that are associated with inflammatory phenotypes of asthma. Peripheral blood was collected from adults with eosinophilic asthma (EA; n = 21), paucigranulocytic asthma (PGA; n = 22), neutrophilic asthma (NA; n = 9), and healthy controls (n = 10). Blood monocytes were isolated using ficoll density gradient and immuno-magnetic cell separation. Bisulfite converted genomic DNA was hybridized to Illumina Infinium Methylation27 arrays and analyzed for differential methylation using R/Bioconductor packages; networks of gene interactions were identified using the STRING database. Compared with healthy controls, differentially methylated CpG loci were identified in EA (n = 413), PGA (n = 495), and NA (n = 89). We found that 223, 237, and 72 loci were significantly hypermethylated in EA, PGA, and NA, respectively. Nine genes were common to all three phenotypes and showed increased methylation in asthma. Three pathway networks were identified in EA, involved in purine metabolism, calcium signaling, and ECM-receptor interaction. In PGA, two networks were identified, involved in neuroactive ligand-receptor interaction and ubiquitin mediated proteolysis. In NA, one network was identified involving sFRP1 as a key node, over representing the Wnt signaling pathway. We have identified characteristic alterations in DNA methylation that are associated with inflammatory phenotypes of asthma and may contribute to the disease mechanisms. This network-based characterization may help in the development of epigenetic biomarkers and therapeutic targets for asthma.
Keywords: DNA methylation, Illumina infinium, inflammatory phenotypes, asthma, sputum, monocytes
Introduction
Asthma is a chronic inflammatory airway disease with heterogeneous patterns of airway inflammation. Infiltration of eosinophils into the airways is a feature of eosinophilic asthma (EA), while an abundance of neutrophils defines neutrophilic asthma (NA).1 Subjects with paucigranulocytic asthma (PGA) have normal levels of airway eosinophils and neutrophils1 but alveolar macrophages may be elevated.2 The recruitment of inflammatory cells into the airways is associated with characteristic pathological manifestations as well as different treatment responses. Factors underlying the development of this heterogeneity are poorly understood but both genetic predisposition and environmental exposures play critical roles.
A key mechanism that underpins how environmental exposures modulate gene expression is via DNA methylation of the cytosine of CpG dinucleotides in the gene-promoter regions, a well characterized and long-lasting epigenetic phenomenon.3 Aberrant DNA methylation events, resulting in altered gene expression, especially during development, may underlie many diseases, including asthma. For instance, as an inflammatory disease, Th1 and Th2 cytokines are associated with the development as well as the phenotypic diversification of asthma. A recent study suggests DNA methylation plays a role in skewing the immune system toward a Th2 or Th1 phenotype, thereby influencing the risk of asthma.4 In particular, the IFNγ loci in CD4+ T cells are known to undergo hypermethylation due to allergen sensitization and silencing the Th1 cytokine IFNγ, thereby favoring Th2 responses in mice.5
Other than T cells, monocytes are also implicated in asthma pathogenesis.6 Studies have found functional differences in peripheral blood monocytes from patients with asthma compared with those from healthy subjects.7,8 Certain features of cell activation, including increased expression of cell surface markers such as CD14+ CD16+ are seen in monocytes from adults with asthma.7 The potential effects of monocyte activation include systemic inflammation with elevated monocyte derived cytokines in the peripheral blood and oxidative stress, which has previously been associated with asthma and, especially, neutrophilic asthma.9 Differences in the phenotype and function of monocytes may be associated with environmental factors.10 Therefore, an alteration in the epigenome is a likely underlying mechanism.
This study aimed to identify differences in the monocyte DNA methylation profile of inflammatory phenotypes of asthma compared with healthy controls and key nodal pathway interactions that underlie disease pathogenesis.
Results
Clinical features and airway inflammation
Sixty-one eligible participants including 52 patients with asthma and 10 healthy controls participated in this study. The characteristics of the subjects are detailed in Table 1. Subjects with asthma were further classified into inflammatory phenotypes using induced sputum cell counts (Table 1). We achieved a good gender balance between the groups; however, participants with NA were significantly older compared with PGA and healthy controls (P = 0.006). Additionally, more than half (67%) of NA patients were ex-smokers. There was no significant difference in atopic status, BMI or FENO within the subgroups. Patients with NA had the lowest FEV1% predicted, significantly different (P = 0.0003) from all the other groups. FVC% predicted and FEV1/FVC followed a similar trend with the largest decline of lung function in NA (P < 0.02). There were also significant differences in ACQ scores (P = 0.017), which were highest in NA.
Table 1. Demographic and clinical characteristics of subjects with asthma and healthy controls.
| Asthma | Healthy | P value | |||
|---|---|---|---|---|---|
| Neutrophilic | Eosinophilic | Paucigranulocytic | |||
| N | 9 | 21 | 22 | 10 | |
| Age (y), median (Q1, Q3) | 69 (55, 73) | 48 (39, 59) | £46 (27, 63) | £33 (29, 50) | 0.006 |
| Gender (M | F) | 5 | 4 | 9 | 12 | 7 | 15 | 5 | 5 | 0.460 |
| Ex-smoker, n (%) | 6 (66.7) | 5 (23.8) | 4 (18.2) | 0 | 0.008 |
| Pack years, median (Q1, Q3) | 5.7 (3.0, 19.0) | 0.45 (0, 10.4) | 0.2 (0, 1.0) | N/A | 0.080 |
| Atopy, n/N (%) | 5/8 (62.5) | 15/21 (71.4) | 17/20 (85.5) | 4/10 | 0.091 |
| BMI, mean (SD) | 29.2 (7.9) | 28.6 (5.4) | 29.6 (7.1) | 25.77 (4.6) | 0.455 |
| FENO ppb, median (Q1, Q3) | 11.9 (3.4, 18.1) | 19.1 (10.9, 42.2) | 13.9 (6.3, 25.5) | 10.3 (5.8, 13.6) | 0.079 |
| Post β2 FEV1% predicted, mean (SD) | 62.2 (14.9) | £85.9 (19.8) | £87.9 (14.5) | £96.0 (12.5) | < 0.001 |
| Post β2 FVC% predicted, mean (SD) | 76.6 (9.4) | 92.5 (19.1) | £95.8 (14.3) | 95.87 (13.3) | 0.02 |
| Post β2 FEV1/FVC, mean (SD) | 61.0 (13.0) | £73.9 (10.9) | £73.7 (7.6) | £82.6 (4.6) | < 0.001 |
| ACQ7 score, median (Q1, Q3) | 1.67 (1.28, 2.0) | 0.89 (0.78, 1.36) | £0.69 (0.3, 1.7) | N/A | 0.017 |
| ICS, n (%) | 9 (100.0) | 20 (95.2) | 16 (72.7) | N/A | 0.065 |
| ICS dose (BDP equivalent µg/day), median (Q1, Q3) | 1000 (500, 2000) | 650 (500, 1300) | 500 (400, 1300) | N/A | 0.456 |
| Total cell countx106/ml, median (Q1, Q3) | 7.2 (5.18, 11.89) | 3.51 (2.7, 4.59) | 3.87 (2.88, 5.76) | £1.64 (1.44, 3.78) | 0.009 |
| Viability%, mean (SD) | 89.16 (8.82) | 62.78 (22.35) | 66.20 (17.27) | £50.78 (22.33) | 0.010 |
| Neutrophils%, median (Q1, Q3) | 83.25 (66.0, 90.75) | £25.75 (13.5, 35.25) | £25.88 (14.25, 43.0) | £14.5 (12.0, 29.0) | < 0.001 |
| Neutrophils x104/ml, median (Q1, Q3) | 572.4 (390.80, 964.29) | £93.56 (43.88, 146.88) | £103.28 (954.34, 158.62) | £23.86 (5.4, 53.91) | < 0.001 |
| Eosinophils%, median (Q1, Q3) | 1.25 (0.75, 2.25) | £¥≠6 (3.75, 11.25) | 0.88 (0.25, 1.0) | 0.75 (1.63, 1.75) | < 0.001 |
| Eosinophils x104/ml, median (Q1, Q3) | 9.19 (2.88, 12.41) | ¥≠27.13 (15.84, 42.3) | 2.97 (1.06, 4.05) | 1.87 (0.68, 5.06) | < 0.001 |
| Macrophages%, median (Q1, Q3) | 12.0 (6.75, 31.75) | £58.5 (50.5, 67.75) | £66.63 (55.5, 81.0) | £65.75 (60.5, 79.0) | < 0.001 |
| Macrophages x104/ml, median (Q1, Q3) | 91.27 (66.67, 165.24) | 208.98 (166.16, 265.07) | £261.22 (164.83, 296.66) | 110.92 (75.78, 257.130 | 0.013 |
| Lymphocytes%, median (Q1, Q3) | 0.25 (0.25, 0.9) | 0.75 (0.25, 1.25) | £1.25 (0.5, 2.0) | £1.75 (1.25, 4.0) | 0.021 |
| Lymphocytes x104/ml, median (Q1, Q3) | 3.33 (0.19, 12.70) | 2.84 (0.94, 6.84) | 7.2 (1.67, 10.58) | 3.17 (1.18, 7.82) | 0.456 |
| Columnar epithelial cells %, median (Q1, Q3) | 0.7 (0, 0.75) | 2.0 (0.5, 3.75) | 1.38 (0.25, 6.0) | 1.75 (1.3, 5.25) | 0.108 |
| Squamous %, median (Q1, Q3) | 5.2 (1.72, 7.19) | 8.68 (4.53, 13.61) | 4.99 (2.68, 11.15) | 10.5 (7.0, 16.14) | 0.056 |
Data are presented as mean ± SD or median (interquartile range), unless otherwise specified. BMI: Body Mass Index; FENO: Fractional Exhaled Nitric Oxide; ppb: parts per billion; FEV1: Forced Expiratory Volume in 1s; % pred: %predicted; FVC: Forced Vital Capacity; ICS: inhaled corticosteroids; †ICS dose is calculated as beclomethasone dipropionate (BDP) equivalents, where 1μg of beclomethasone = 1μg budesonide = 0.5μg fluticasone; ACQ: Asthma Control Questionnaire. CEP: Columnar epithelial cells. £Kwalis2 post hoc significant vs neutrophilic asthma, ¥ Kwalis2post hoc significant vs paucigranulocytic asthma, ≠ Kwalis2 post hoc significant vs healthy controls.
Differential DNA methylation in asthma inflammatory phenotypes
In EA, 413 CpG loci were differentially methylated compared with healthy controls, which corresponded to 404 genes, and resulted in 2 distinct patient clusters when compared with healthy controls (Fig. 1A). Of these loci, 223 were hypermethylated while 190 loci were hypomethylated in EA. Similarly, there were 495 loci differentially methylated (492 genes) in PGA compared with healthy controls, which resulted in 2 distinct clusters (Fig. 1B). Of the total 495 loci, 237 were hypermethylated and 258 were hypomethylated in PGA. NA was associated with the differential methylation of 89 loci compared with healthy controls, which corresponded to 89 genes, and resulted in 2 distinct clusters (Fig. 1C). The majority of the differentially methylated CpG loci (72) were hypermethylated while 17 loci were hypomethylated in NA.

Figure 1. Clustering of subjects based on differentially methylated loci. (A) Clustering of 21 subjects with EA and the 10 healthy controls based on the differential methylation of 413 loci. (B) Clustering of 22 subjects with PGA and the 10 healthy controls based on the differential methylation of 495 loci. (C) Clustering of 9 subjects with NA and the 10 healthy controls based on the differential methylation of 89 loci.
Differential DNA methylation comparisons
To investigate potential overlapping features that could indicate underlying biology in the differentially methylated loci, we used a Venn diagram (Fig. 2). Ninety-three CpG loci were common between EA and PGA while <20 loci were common between NA and the other inflammatory phenotypes when compared with healthy controls. Importantly, there were 9 CpG loci, corresponding to 9 genes that were differentially methylated in all asthma phenotypes compared with the healthy controls (Table 2).
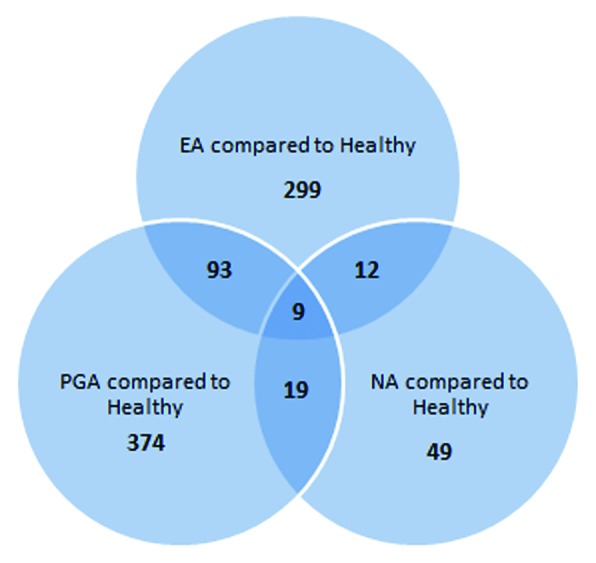
Figure 2. Venn diagram showing unique and shared gene loci among three inflammatory phenotypes of asthma
Table 2. Differentially methylated CpG loci common to all three inflammatory phenotypes.
| Illumina ID | Symbol | Hugo gene name | β median, [adj P value] | Chromosome | CpG site map info | |||
|---|---|---|---|---|---|---|---|---|
| Healthy | EA | PGA | NA | |||||
| cg10281002 | TBX5 | T-box 5 | 0.0568 | 0.0746 [0.035] | 0.0754 [0.027] | 0.0781 [0.044] | 12q24.1 | 1.15E+08 |
| cg12497564 | RBP1 | retinol binding protein 1, cellular | 0.0181 | 0.0247 [0.047] | 0.0231 [0.027] | 0.0366 [0.047] | 3q21-q23 | 1.39E+08 |
| cg17457560 | NRG1 | neuregulin 1 | 0.0532 | 0.0664 [0.038] | 0.0667 [0.027] | 0.0678 [0.046] | 8p21-p12 | 32405851 |
| cg00630164 | KCNQ4 | potassium voltage-gated channel, KQT-like subfamily, member 4 | 0.0204 | 0.0245 [0.035] | 0.0245 [0.033] | 0.0258 [0.047] | 1p34 | 41250062 |
| cg25191725 | PYY2 | peptide YY, 2 (pseudogene) | 0.8991 | 0.9173 [0.045] | 0.9201 [0.033] | 0.9204 [0.043] | 17q11 | 26554221 |
| cg13921352 | FAM19A4 | family with sequence similarity 19 member A4 | 0.0314 | 0.0371 [0.038] | 0.0363 [0.033] | 0.0465 [0.043] | 3p14.1 | 68981890 |
| cg05881135 | SYNM | synemin, intermediate filament protein | 0.0463 | 0.0626 [0.038] | 0.0583 [0.036] | 0.0660 [0.047] | 15q26.3 | 99644973 |
| cg24881834 | ME1 | malic enzyme 1, NADP(+)-dependent, cytosolic | 0.0813 | 0.0903 [0.046] | 0.0898 [0.037] | 0.1032 [0.046] | 6q12 | 84140997 |
| cg25604883 | AK5 | adenylate kinase 5 | 0.0215 | 0.0255 [0.037] | 0.0241 [0.041] | 0.0252 [0.046] | 1p31 | 77747387 |
Pathway network analysis of differentially methylated genes in asthma inflammatory phenotypes
To investigate the key pathway interactions underlying the differential DNA methylation between each asthma inflammatory phenotype and the healthy control group, the STRING database11 was used. From the input list of 404 genes differentially methylated in EA, 379 were recognized by the STRING database. The retrieval of interacting genes indicated three distinct gene networks or pathways (Fig. 3). Key nodes were identified as determined by the number of connections with other genes in the differentially methylated list and those genes with 3 or more connections are shown in Table 3. In gene Network 1, pro-opiomelanocortin (POMC) had the most connections followed by pro-platelet basic protein (PPBP), adenylate cyclase 8 (ADCY8), and nuclear receptor coactivator 3 (NCOA3). The second network had 6 genes with 4 connections to each other, including prostaglandin F receptor (PTGFR), free fatty acid receptor 1 (FFAR1or GPR40), G-protein coupled receptor 65 (GPR65), Kisspeptin receptor (KISS1R or GPR54), cholecystokinin B receptor (CCKBR), tachykinin receptor 3 (TACR3). The third network’s key nodal point was hyaluronan-mediated motility receptor (HMMR), followed by Zwilch Kinetochore Protein (ZWILCH).

Figure 3. The differentially methylated genes in EA interact in three networks. Network 1 is constituted by 35 genes and several key nodes and includes purine metabolism as the most significant pathway. Network 2 is enriched in 6 G-protein-coupled receptors mainly involved in calcium signaling while 15 genes in Network 3 bear the node HMMR, indicating ECM remodeling relation pathways. Known and predicted protein-protein interactions (identified at confidence score > 0.7) are shown. Only the networks with at least one node consisting of more than 3 neighbors are displayed.
Table 3. Genes with more than 3 interconnections within the 3 determined EA networks.
| Illumina ID | Gene Network | Gene symbol | Gene name | Gene function | Neighbors |
|---|---|---|---|---|---|
| cg08030082 | 1 | POMC | proopiomelanocortin | Hormone precursor for adrenocorticotropic hormone, melanocyte-stimulating hormone and Beta-endorphin | 8 |
| cg20357806 | PPBP | Pro-Platelet Basic Protein | Chemo-attractant and activator of neutrophils. Involved in mitosis, glycolysis, intracellular cAMP accumulation, prostaglandin E2 secretion, and synthesis of hyaluronic acid | 7 | |
| cg13912117 | ADCY8 | Adenylate Cyclase 8 | Catalyzes the formation of cyclic AMP from ATP | 7 | |
| cg12128876 | NCOA3 | Nuclear Receptor Coactivator 3 | Stimulates the transcriptional activities | 7 | |
| cg24346429 | GNAS | GNAS Complex Locus | Imprinted loci. involved in various transmembrane signaling systems including regulation of adenylate cyclase | 5 | |
| cg22820108 | NCOR2 | Nuclear Receptor Corepressor 2 | Mediates transcriptional silencing of certain genes. | 5 | |
| cg11677722 | MED29 | Mediator Complex Subunit 29 | Coactivator involved in the regulated transcription of many RNA polymerase II-dependent genes. | 5 | |
| cg08818984 | NR3C1 | Nuclear Receptor Subfamily 3, Group C, Member 1 | Binds to glucocorticoid response elements in the promoters of glucocorticoid responsive genes to activate their transcription | 4 | |
| cg26637069 | APLNR | Apelin Receptor | Inhibit adenylate cyclase activity | 4 | |
| cg24091474 | TYROBP | TYRO Protein Tyrosine Kinase Binding Protein | Involved in neutrophil activation mediated by integrin | 4 | |
| cg03782727 | 2 | FFAR1 | Free Fatty Acid Receptor 1 | Receptor for medium and long chain saturated and unsaturated fatty acids | 4 |
| cg15625636 | GPR65 | G Protein-Coupled Receptor 65 | Receptor for the glycosphingolipid psychosine (PSY) and several related glycosphingolipids. | 4 | |
| cg12998614 | KISS1R | KISS1 Receptor | Neuroendocrine control of the gonadotrophin axis. Inhibition of metastasis. | 4 | |
| cg13346411 | CCKBR | Cholecystokinin B Receptor | G-protein coupled receptor for gastrin and cholecystokinin (CCK) | 4 | |
| cg04263186 | TACR3 | Tachykinin Receptor 3 | receptor for the tachykinin neuropeptide neuromedin-K | 4 | |
| cg24022301 | PTGFR | Prostaglandin F Receptor | Receptor for prostaglandin F2-α (PGF2-α) | 4 | |
| cg19545851 | 3 | HMMR | Hyaluronan-Mediated Motility Receptor | Involved in cell motility | 8 |
| cg18864581 | ZWILCH | Zwilch Kinetochore Protein | Essential component of the mitotic checkpoint | 6 | |
| cg21360828 | CENPA | Centromere Protein A | Mitotic progression and chromosome segregation | 5 | |
| cg18652941 | CD44 | CD44 Molecule | Receptor for hyaluronic acid. Involved in cell migration, lymphocyte activation | 5 | |
| cg01651593 | CDC20 | Cell Division Cycle 20 | Regulatory protein in the cell cycle | 5 | |
| cg22668533 | SMC4 | Structural Maintenance Of Chromosomes 4 | DNA repair in mammals | 4 |
Molecular pathways enriched in these networks were analyzed by means of the GATHER annotation tool. Six Kyoto Encyclopedia of Genes and Genomes (KEGG) pathways were identified that were significantly overrepresented (Table 4). Purine metabolism, phosphatidylinositol signaling and neuroactive ligand-receptor interaction were significant for the first gene network. Neuroactive ligand-receptor interaction and calcium signaling were prominent in the second network while ECM-receptor interaction was significant for the third network.
Table 4. GATHER KEGG Pathway Analysis of the gene clusters from EA vs Healthy analysis.
| Network | KEGG Pathway | Annotation | Gene Number/ Total in the cluster2 | P- Value | Bays Factor3 | Gene names |
|---|---|---|---|---|---|---|
| 1 | hsa00230 | Purine metabolism | 4/35 | 0.004 | 1 | ADCY8, AK5, PDE10A, PDE4B |
| hsa04070 | Phosphatidylinositol signaling system | 3/35 | 0.008 | 1 | INPP5D, IRAK3, ITPKB | |
| hsa04080 | Neuroactive ligand-receptor interaction | 5/35 | 0.009 | 1 | AGTRL1, CTSG, NR3C1, POMC, PTGDR | |
| 2 | hsa04020 | Calcium signaling pathway | 3/6 | < 0.0001 | 7 | CCKBR, PTGFR, TACR3 |
| hsa04080 | Neuroactive ligand-receptor interaction | 3/6 | < 0.0001 | 6 | CCKBR, PTGFR, TACR3 | |
| 3 | hsa04512 | ECM-receptor interaction | 2/15 | 0.0003 | 4 | CD44, HMMR |
1 GATHER (Gene Annotation Tool to Help Explain Relationships, http://gather.genome.duke.edu/) was used to assist in functional annotation. Input data consisted of the unique named genes within the clusters resulted from String analysis. For the KEGG pathway analysis, the significant pathways which consisted of at least 2 genes are shown. 2Number of genes in that category also present in particular gene network.3A measure of false discovery rate; Bays factor > = 1 is significant.
For the 492 differentially methylated genes in PGA, 466 were recognized by STRING database and the retrieval of interacting genes have indicated two distinct gene networks or pathways (Fig. 4). Key nodes were identified as determined by the number of connections with other genes in the differentially methylated list and those genes with 3 or more connections in these 2 networks are detailed in Table 5. The key nodes in Network 1 are adenylate cyclase 8 (ADCY8) followed by lysophosphatidic acid receptor 1 (LPAR1) and the nuclear transcription factor JUN. Cell division cycle 20 (CDC20) is a key node within the second cluster of genes, directly linked with 7 other genes (Fig. 4; Table 5). GATHER analysis was used to identify molecular pathways underlying the networks. Among the four molecular pathways related to Network 1, neuroactive ligand-receptor interaction was the most significant (Table 6). The pathway of ubiquitin-mediated proteolysis was the most significant for the second network of genes.

Figure 4. Sixty-seven of the differentially methylated genes in PGA interact in two networks. Network 1 contains 47 neuroactive ligand interactions as the key pathway, while the cluster of 20 genes in Network 2 is mostly relevant to proteolysis-related pathways. Known and predicted protein-protein interactions were identified at a confidence score > 0.7. Only the networks with at least a node consisting of more than 3 neighbors are displayed.
Table 5. Genes with more than 3 interconnections within the 2 determined PGA networks.
| Illumina ID | Gene Network | Gene symbol | Gene name | Gene function | Neighbors |
|---|---|---|---|---|---|
| cg13912117 | 1 | ADCY8 | Adenylate Cyclase 8 | Catalyzes synthesis of cyclic AMP from ATP | 10 |
| cg15195276 | LPAR1 | Lysophosphatidic Acid Receptor 1 | Involve in many biologic functions such as cell proliferation, platelet aggregation, smooth muscle contraction and chemotaxis | 9 | |
| cg01909487 | JUN | Jun Proto-Oncogene | Transcription factor that binds to the enhancer heptamer motif 5′-TGA[CG]TCA-3′. | 8 | |
| cg00195561 | CHRM4 | Cholinergic Receptor, Muscarinic 4 | Inhibition of adenylate cyclase, breakdown of phosphoinositides and modulation of potassium channels through the action of G proteins | 7 | |
| cg21542793 cg20634573 |
ADRA2B | Adrenoceptor Alpha 2B | Mediate the catecholamine-induced inhibition of adenylate cyclase through the action of G proteins | 7 | |
| cg26796190 | PYY | Peptide YY | Inhibits exocrine pancreatic secretion | 7 | |
| cg16249454 | CXCL2 | Chemokine (C-X-C Motif) Ligand 2 | Suppresses hematopoietic progenitor cell proliferation | 7 | |
| cg03389133 | SSTR3 | Somatostatin Receptor 3 | Inhibition of adenylyl cyclase | 7 | |
| cg17586860 | SSTR4 | Somatostatin Receptor 4 | Inhibition of adenylate cyclase, activation of both arachidonate release and mitogen-activated protein (MAP) kinase cascade | 7 | |
| cg04738091 | PTEN | Phosphatase And Tensin Homolog | A protein phosphatase, dephosphorylating tyrosine-, serine-and threonine-phosphorylated proteins | 6 | |
| cg04790129 | ITGB2 | Integrin, Beta 2 | Triggers neutrophil transmigration during lung injury | 6 | |
| cg20925811 | MMP9 | Matrix Metallopeptidase 9 | Involve in proteolysis of the extracellular matrix and in leukocyte migration | 5 | |
| cg12128876 | NCOA3 | Nuclear Receptor Coactivator 3 | Stimulates the transcriptional activities. Has histone acetyltransferase activity | 5 | |
| cg16785344 | PXN | Paxillin | Involved in actin-membrane attachment at sites of cell adhesion to the extracellular matrix | 5 | |
| cg21105318 | ITGB6 | Integrin, Beta 6 | A receptor for fibronectin and cytotactin. | 4 | |
| cg01651593 | 2 | CDC20 | Cell Division Cycle 20 | Act as a regulatory protein in cell cycle | 7 |
| cg25960313 | FBXO5 | F-Box Protein 5 | Regulates early mitosis by inhibiting the anaphase promoting complex/cyclosome (APC). | 5 | |
| cg20104688 | TK1 | Thymidine Kinase 1 | Thymidine kinase activity and ATP binding | 4 |
Table 6. GATHER KEGG Pathway Analysis of the gene clusters from PGA vs Healthy analysis.
| Network | KEGG Pathway | Annotation | Gene Number/ Total in the cluster | P Value | Bays Factor | Gene names |
|---|---|---|---|---|---|---|
| 1 | hsa04080 | Neuroactive ligand-receptor interaction | 10/51 | 0.0001 | 5 | ADRA2B, CHRM4, EDG2, MC1R, NPFF, PTGER2, PTGIR, PYY, SSTR3, SSTR4 |
| hsa04810 | Regulation of actin cytoskeleton | 7/51 | 0.001 | 2 | APC2, CHRM4, ITGB2, ITGB6, PFN1, PIP5K1B, PXN | |
| hsa04510 | Focal adhesion | 7/51 | 0.002 | 2 | CCND2, COL2A1, ITGB6, JUN PTEN, PXN,TLN1 | |
| hsa04070 | Phosphatidylinositol signaling system | 4/51 | 0.008 | 1 | INPP5A, INPP5D, PIP5K1B, PTEN | |
| 2 | hsa04120 | Ubiquitin mediated proteolysis | 2/20 | 0.007 | 3 | CDC20, TCEB1 |
| hsa00240 | Pyrimidine metabolism | 2/20 | 0.002 | 2 | CDA, TK1 |
1 GATHER (Gene Annotation Tool to Help Explain Relationships, http://gather.genome.duke.edu/) was used to assist in functional annotation. Input data consisted of the unique named genes within the clusters resulted from String analysis. For the KEGG pathway analysis, the significant pathways that consisted of at least 2 genes are shown. 2Number of genes in that category also present in particular gene network.3A measure of false discovery rate; Bays factor > = 1 is significant.
Analysis of gene interactions of the 89 differentially methylated loci (88 identified by STRING) in NA at the medium confidence level formed a single distinct cluster (Fig. 5). Secreted frizzled-related protein 1 (sFRP1) is the key node of this cluster, associated with wingless-type MMTV integration site family member 2 (WNT2), low density lipoprotein receptor-related protein 5 (LRP5), receptor tyrosine kinase-like orphan receptor 2 (ROR2), fibroblast growth factor 23 (FGF23), and adenomatous polyposis coli (APC). The foremost KEGG pathway identified by the GATHER analysis (Table 7) was the Wnt signaling pathway.

Figure 5. In NA, only 8 differentially methylated genes associated with each other and formed a single network. The gene SFRP1 represents a key node and the network is enriched with Wnt signaling pathway genes. Known and predicted protein-protein interactions were identified at a confidence score > 0.4. Only the networks with at least one node consisting of more than 3 neighbors are displayed.
Table 7. GATHER KEGG Pathway Analysis of the gene clusters from NA vs Healthy analysis.
| KEGG Pathway | Annotation | Gene Number/ Total in the cluster | P- Value | Bays Factor | Gene names |
|---|---|---|---|---|---|
| hsa04310 | Wnt signaling pathway | 4/8 | < 0.0001 | 8 | APC, LRP5, SFRP1, WNT2 |
| hsa04340 | Hedgehog signaling pathway | 2/8 | 0.0004 | 4 | CSNK1D, WNT2 |
| hsa04810 | Regulation of actin cytoskeleton | 2/8 | 0.006 | 1 | APC, FGF23 |
Discussion
Epigenetic alterations, including aberrant DNA methylation upon certain environmental exposures, is believed to contribute to disease manifestations of asthma and may underpin different asthma inflammatory phenotypes. In this study, we investigated genome-wide DNA methylation profiles of isolated peripheral blood monocytes in asthma and healthy volunteers. We found that there were substantial differences in monocyte DNA methylation associated with inflammatory phenotype of asthma when compared with healthy controls. EA demonstrated 413 (404 genes) loci differentially methylated, which mapped to 3 networks. Exploration of biological pathways relevant for each of these networks suggested that the most significant pathways were homeostasis of cAMP (purine metabolism) for Network 1, calcium signaling for Network 2, and ECM-receptor interactions for the Network 3. Out of the 492 genes significantly differentially methylated in PGA, 71 genes had significant physical and/or functional association in two networks. Neuroactive ligand-receptor interaction was the most significant biological pathway conveyed in the Network 1 and ubiquitin mediated proteolysis in the Network 2. In NA, there were 89 differentially methylated loci and Wnt signaling was the single most important pathway comprising 8 out of 89 differentially methylated genes.
The different inflammatory phenotypes of asthma represent distinct patterns of airway inflammation, each with distinct patterns of gene expression2,12 for inflammatory cytokines. Therefore, abnormal expression of inflammatory cytokines, a characteristic feature of asthma, may be a consequence of these methylation events. Indeed, recent studies confirmed the role of different environmental conditions on DNA methylation13 and association of such modifications in the pathogenesis of asthma.14-17 The genome-wide DNA methylation profiling of whole blood or PBMCs facilitated the identification of many altered gene loci. However, few studies attempted to identify the contribution of particular cell types in the disease pathogenesis.18 To this end, the role of monocytes is being increasingly recognized in asthma6,8,19,20 and an altered epigenome is suspected for the abnormalities in these cells. This study shows that, indeed, there are differences in DNA methylation in circulatory monocytes in asthma. By using purified monocytes to evaluate DNA methylation changes we avoided complications associated with the mixture of cells and their quantities in peripheral blood.
The key genes within the networks and the pathways can be implicated in pathogenesis of the different inflammatory phenotypes. Purine metabolism or homeostasis of cAMP is important, as other pathways, such as calcium signaling, include many GPRs that are known to exert upstream effects on the regulation of cAMP, while intercellular cAMP may play a role in ECM-receptor interaction related pathways. We observed hypermethylation of cAMP pathway genes, resulting in downregulation of their expression. These findings are in line with the existing literature emphasizing the importance of cAMP in allergies and asthma. Reductions in intracellular cAMP in leucocytes and lymphocytes in asthma was known as early as 1970s.21 This depletion of cAMP in monocytes has been associated with asthma.22 It is now well recognized that increases in the cAMP in these cells have a potent anti-inflammatory action,23 such as inhibition of pro-inflammatory cytokine production and enhanced expression of anti-inflammatory IL-10.24 The synthesis of cAMP is regulated by the ADCY gene family and one of these genes, ADCY8, occupied a central node in our data. This is one of the nine isoforms of ADCY genes with expression in the brain, lung,25 and several other tissues including peripheral blood. A previous study had identified a significant reduction in ADCY gene activity of alveolar macrophages in asthma.26 The causes underlying our observations of ADCY8 locus methylation are unclear.
Cellular calcium (Ca2+) also has a significant impact on cAMP synthesis. ADCY8 is a calcium/calmodulin dependent isoform and can respond rapidly to changes in Ca2+, giving rise to oscillations in cAMP in response to Ca2+ transients.27 Since intracellular Ca2+ is integral for G-protein coupled receptor (GPR) signaling, including β-adrenergic and glucocorticoids, the significance of this pathway in EA may be an important finding. Existing literature suggest defects in Ca2+ homeostasis in asthma28,29 and effects of this may be particularly significant in airway smooth muscle contractility.30 The alteration of extracellular Ca2+ influx is partly attributed to the altered calcium homeostasis in asthmatic airway smooth muscle.31 In line with this, it can be assumed that similar defects may exist in inflammatory cells, such as monocytes. The increased methylation of GPRs interacting with Ca2+ signaling suggests potential relevance of DNA methylation in the altered Ca2+ homeostasis in EA. Especially, receptors of CCKBR, PTGFR, and TACR3 participate in intracellular calcium mobilization,32-34 and the increased methylation likely downregulates their expression in EA.
The degradation of cAMP is equally important in preventing direct downstream effectors of cAMP, protein kinase A (PKa), as well as exchange proteins activated by cAMP (EPAC). Phosphodiesterases (PDEs) catalyzed the hydrolysis of cAMP; increased PDE expression has been attributed to aggravated asthma and allergy symptoms.22,35 Among the 11 PDEs identified to date, PDE4, PDE7, and PDE8 are selective for cAMP. The PDE4 family consists of 4 isoforms (A, B, D, and D), of which PDE4B is predominantly expressed in monocytes and neutrophils. Apart from cAMP catabolism-related pro-inflammatory actions, PDE4 also plays a role in the differentiation of cultured blood monocytes to a macrophage-like phenotype,36 showing a significant downregulation of PDE4 activity in this process of differentiation.36,37 We found increased methylation of PDE4B locus in circulating monocytes, which may lead to downregulation of enzyme expression as part of monocyte differentiation. Hypomethylation of the PDE4D isoform was recently shown in mice and was related to house dust mite exposure.16 However, we did not identify this in EA. The potential effects due to asthma medications may also be important in this regard as prolonged β-adrenoreceptor stimulation has been associated with increased PDE4B mRNA expression in human monocytes.38 In addition to PDE4, we identified hypermethylation of the PDE10A locus in EA. PDE10A is an important asthma related locus as identified by genome-wide association studies and shown to play a role in human lung morphogenesis.39
Apart from cAMP and Ca2+ signaling, the differentially methylated genes in EA also highlight pathways related to ECM receptor interaction. Since ECM remodeling and infiltration of inflammatory cells are pathologically related with EA, these finding may have great significance. In our data, HMMR and CD44 were the most prominent. CD44 is the major cell-surface hyaluronic acid (hyaluronan) binding protein, while the HMMR gene encodes CD168, a cell surface hyaluronan receptor and intracellular protein. The interactions of these receptors with hyaluronan within ECM facilitate cell motility and adhesion. Promoter methylation is known to regulate CD44 expression, where hypermethylation results in transcriptional inactivation40; however, epigenetic regulation of HMMR is largely unknown.
The existence of symptomatic asthma in the absence of eosinophil or neutrophil infiltration is a characteristic feature of PGA. The pathogenesis of this sub-type of asthma is not yet fully understood but there is a certain degree of glucocorticoid resistance in the patients with PGA. The potential defects within neuroactive ligand-receptor interactions may be important in this regard. In particular, the action of asthma medications, such as β-adrenergic agonists and glucocorticoids, signal via GPRs. In addition, several of those key receptors were differentially methylated in PGA. For instance, ADRA2B is a known biomarker in asthma and its agonists are used as bronchoconstriction regulators. Promoter methylation of this gene was significantly related to the development of asthma in children.41,42 The hypermethylation of two loci of ADRA2B in our data suggests greater significance of this gene in PGA. In addition CHRM4, PYY, and LPAR1 were related to neuroactive ligand signaling and were differentially methylated in PGA. The increased methylation of CHRM4 may be linked to loss of gene function, as noted in human airway disease,43 and genome wide association studies (GWAS) have identified CHRM4 as a risk locus for asthma. LPAR1 participates in the regulation of peripheral blood monocyte counts44 and has been associated with asthma. Similarly, PTGIR, PTGER2, and somatostatin receptors (SSTR3, 4) are also associated with asthma and allergy. In fact, many of the above genes encode GPRs, which were previously associated with asthma. However, the exact biological consequences of their expression in monocytes in PGA and the effects of methylation need further investigation.
Ubiquitin-mediated proteolysis was also a significant pathway that was differentially methylated in PGA, with CDC20 and TCEB1 as the prominent members of this network. Both of these genes are involved in cell cycle and, therefore, any altered expression due to methylation may contribute to differentiation of monocytes. In fact, hypomethylation of these genes suggests upregulated expression and, depending on effects of other associated genes, this may explain increased abundance or phenotypic differences of monocytes in asthma.
In contrast to EA and PGA, several genes associated with Wnt signaling pathway were differentially methylation in NA. The Wnt signaling pathway constitutes a large family of highly conserved, secreted glycoproteins, which function as short or long range signaling molecules. WNT2, one of the hypermethylated loci, is known to be critical for the early development of airway smooth muscle.45 Hypermethylation of WNT2 in human placenta is associated with low birth weight of the neonate46 an important risk factor for asthma. This signaling pathway is highly regulated by Wnt inhibitors, including the sFRPs and Wnt inhibitory factor-1 (WIF). Hypermethylation of the two loci of sFRP1 in NA suggests a possible impaired regulation of Wnt signaling, providing an epigenetic basis of its observed association with lung inflammation. Also low-density lipoprotein receptor 9 (LRP9) has an essential role in the Wnt signaling pathway, since it acts as a co-receptor that binds Wnt proteins with frizzled-receptors. Likewise WNT2, LRP5 regulate early development of lung.
Through the network analyses we have identified KEGG pathways common between phenotypes. Phosphatidylinositol signaling and neuroactive ligand-receptor interaction were altered in EA as well as PGA, whereas the regulation of actin cytoskeleton was altered in both NA and PGA. The phosphatidylinositol signaling pathway is associated with immune receptor signaling and has been shown to play a role in allergic asthma and severe asthma phenotypes.47 Activation phosphoinositide 3-kinase (PI3K) leads to expression of inflammatory mediators, inflammatory cell recruitment, and airway remodeling.48 In fact, lower levels of histone deacetylase 2 in alveolar macrophages, associated with steroid unresponsiveness, is due to its phosphorylation by PI3K.49
The neuroactive ligand-receptor pathway includes many G-protein coupled receptors, including the glucocorticoid receptor NR3C1, which is differentially methylated in EA. Often located on the cell surface, these receptors are involved in transduction of an endogenous signal into an intracellular response.
Changes in the regulation of the actin cytoskeleton may represent differences in monocyte motility. However, the roles of these pathways in inflammatory phenotypes of asthma warrant further investigation.
We also identified 9 genes that were differentially methylated in asthma and common between all three phenotypes. This further emphasizes the differences in the underlying mechanisms responsible for the inflammatory phenotypes. These common loci may have a greater significance in asthma pathogenesis regardless of inflammatory phenotype. Apart from network or pathway related genes, such as PYY and AK5, T-box 5 is involved in the transcriptional regulation of genes. This is particularly important during early development of the respiratory system.50 RBP1 encodes the carrier protein involved in the transport of retinol. Although the exact role of this gene in asthma is unknown, vitamin A has been associated with aggravation of asthma in mice.51 NRG1 is another gene implicated in asthma. This protein is a direct ligand for tyrosine kinase receptors and involved in lung architecture. The FAM19A4, SYNM, KCNQ4, and ME1 were also found to be significant; however, any implication of methylation and the exact role in asthma is unclear.
Although this study has emphasized that the development of asthma and inflammatory phenotypes are likely associated with characteristic alterations in the DNA methylation, there are strengths as well as several limitations in our approach. The use of purified monocytes perhaps the most distinguished strength of our study. This allowed extensive focusing on the monocyte genome and our choice of monocytes is based on the emerging importance of this cell type in asthma. However, asthma is a complex disease and the involvement of other cells types, such as T-cells or even epithelial cells, cannot be ignored. Also, we chose CD14+ monocytes for this study even though several subtypes of monocytes in the circulation that may be involved in asthma. Investigation of other cell types and subsets of monocytes will be a task for future studies. The selection of subjects may be one of the most critical steps in this study. Extensive exclusion criteria are one of the strengths of our study, selecting of subjects without other respiratory complications, oral corticosteroid use or obese may helped minimize effect modifications. However, most subjects with asthma were taking ICS; therefore, it is possible that some effects may be attributed to this. We could not reliably assess effects of ICS on blood monocyte DNA methylation with this study design; therefore, this should be considered in future studies. Finally, the sample size in this study is relatively small; therefore, our findings should be further investigated in a larger study population. In conclusion, this study has found significant differences in DNA methylation profile of peripheral blood monocytes associated with inflammatory phenotypes of asthma. The gene network and pathway analysis indicated an involvement of distinct molecular pathways that are likely playing a significant role in the pathogenesis of asthma and the inflammatory phenotypes.
Methods
Participants
Adults with stable asthma (n = 52) and healthy controls (n = 10) were recruited. Asthma was defined according to ATS guidelines based upon current (past 12 mo) episodic respiratory symptoms, doctor’s diagnosis (ever) and demonstrated reversible airflow obstruction with a FEV1 bronchodilator response of ≥12% (and >200 ml) or airway hyper-responsiveness (AHR) to hypertonic (4.5%) saline with a PD15 < 15 ml. Participants were excluded if they had a recent (past month) respiratory infection, asthma exacerbation, change in maintenance therapy, or a course of oral corticosteroids or antibiotics. Participants were also excluded if they had lung function FEV1 < 0.5L, <40% predicted, were current smokers or ex-smokers who quit within the last 12 mo, if they were morbidly obese (BMI > 40) or had co-morbid conditions, such as diabetes mellitus, cancer or another respiratory condition, including COPD, emphysema or bronchiectasis.
Subjects attended a visit where spirometry, sputum induction, allergy skin tests, exhaled nitric oxide (FENO) and blood collection were performed, along with information collected regarding demographics, medical history, asthma control,52 and medication use. All participants gave informed written consent and the study was approved by the Hunter New England Health and the University of Newcastle Human Research Ethics Committees.
Induced sputum processing
Induced sputum was processed following the method described previously.53 Briefly, mucus plugs were selected and dispersed using Sputolysin containing 0.1% dithiothreitol (DTT) (Calbiochem, cat# 560000). The suspension was then filtered and total cell count (TCC) and cell viability (trypan blue exclusion) were performed. Cytospins were prepared, stained with May–Grünwald-Giemsa (MGG) and chromothrope 2R (C2R) cytopins for differential cell counts, performed on 400 non-squamous cells.
Asthma inflammatory phenotype classification
Subjects with >3% sputum eosinophils were classified as EA and those with >61% sputum neutrophils and <3% eosinophils were classified as NA. Those with <61% sputum neutrophils and <3% eosinophils were classified as paucigranulocytic asthma.1,53
Peripheral Blood Monocyte Isolation
Peripheral blood monocytes (PBMCs) were separated using Ficoll-hypaqueTM Plus (GE healthcare, cat# 17–1440–02) density gradient centrifugation. Monocytes were purified from PBMCs using the Human Monocyte Cell Isolation kit II (Miltenyi Biotec, cat# 130–091–153). The cell isolation kit allowed negative selection of the desired cells and used the magnetic cell separation system (MACS) (Miltenyi Biotec), LS cell separation columns (Miltenyi Biotec, cat# 130–042–401) and MACs buffer (Miltenyi Biotec, cat# 130–091–221) as per manufacturer’s recommendations. Monocyte isolations resulted in an average yield of 8 x 10⁶ cells and purity was consistently greater than 95%. The method allows specific isolation of CD14-expressing monocytes by depletion of all other cells containing CD3, 7, 16, 19, 56, 123, and Glycophorin A.
DNA isolation and bisulphite conversion
Genomic DNA was isolated from samples using the All Prep DNA/RNA/Protein kit, following the manufacturer’s protocol (Qiagen, cat# 8004). DNA was quantified using the Pico-Green assay (Life Technologies, cat# P11496) following manufacturer’s recommendations. A Nano drop 2000 (Thermo Fisher scientific) was used for assessment of DNA quality (the 260 nm/280 nm optical density ratio of 1.7–2.1 was deemed acceptable). DNA (500 ng) was treated with sodium bisulphite using the EZ DNA Methylation Gold Kit (Zymo Research, cat# D5005) according to the manufacturer’s recommended procedure adapted for Illumina’s Infinium methylation analysis.
Genome-wide methylation assay
DNA methylation analysis was conducted using the Illumina Infinium Human Methylation27 Bead Chip (Illumina, P/N# 270570 and 11297698). These arrays facilitate high-throughput processing and analysis of DNA methylation at genome-wide scale by interrogating over 27000 highly informative CpG dinucleotides, spanning 14495 genes. The assay is highly accurate and powerful in detecting the methylation status of queried CpG loci54 and has extremely high reproducibility.54 To assess DNA methylation, we used the standard Illumina protocols. In brief, bisulphite converted DNA was whole-genome amplified and the amplified products were then fragmented by an endpoint enzymatic process. The fragmented DNA was purified and hybridized to Infinium Human Methylation27 arrays. During hybridization, the amplified and fragmented DNA samples anneal to locus specific DNA oligomers residing on the bead chips. Single-base extension reaction, washing, and staining were performed using a TECAN Te-Flow chamber. The stained arrays were assessed for fluorescence intensities at methylated and unmethylated bead sites using Illumina BeadArray Reader (Illumina).
Data analysis
Bioconductor packages55 in the R software platform (www.r-project.org) were used for data analysis. Custom bash scripts were used for the quality control (QC) and statistical analysis of the 27K methylation data. In brief, the raw Illumina data (.idat) files were loaded into R and first went through a QA/QC step. Color balance adjustment of methylated and un-methylated probe intensities between two channels (red, green) was performed using a smooth quantile normalization method as implemented in the methylumi package.56 The methylated and unmethylated probe intensities were then normalized using the quantile normalization method. Beta values were calculated as the index of methylation level of the measured CpG sites. Beta values ranged along a continuum bounded by -1 to 1 whereby a value of -1 indicates the CpG is completely unmethylated and a value of 1 indicates complete methylation. After pre-processing, poorly detected loci (lower or around background levels) were removed from further analysis to reduce false positives. To minimize systematic differences due to gender, all probes related to X and Y chromosomes were dropped. We used a two-step statistical analysis approach to determine differentially methylated loci. First, the Kolmogorov-Smirnov (K-S) test was used to identify CpG associations between healthy controls and each of the phenotype subgroups considered separately. Second, as an additional level of stringency, the significant loci identified in the first step (unadjusted P < 0.05) were then subjected to a Kruskal-Wallis (K-W) test. The probes that remained significant from both K-S and K-W testing were determined to be robustly associated with asthma and were used to construct cluster diagrams. The hclust R function was used for the clustering of the subjects based on the differential methylation identified in inflammatory phenotypes.
All primary data used in this study are available at the NCBI Gene Expression Omnibus (http://www.ncbi.nlm.nih.gov/geo/) under accession number GSE59339.
Network Analysis
Network based approaches, studying gene sets rather than individual genes can be more informative in the derivation of relevant molecular pathways and to reveal network patterns. In this study, we used two different freely accessible web tools as described below. Search Tool for the Retrieval of Interacting Genes STRING v9.1 (http://string-db.org/)11 is an online protein-protein interaction database curated from literature that predicts associations from systemic genome comparisons. The database query can be made by using a list of gene IDs or protein sequences. The interactions (networks) can be drawn based on confidence, evidence, actions, or interactions. All network diagrams presented here are based on confidence scores of medium (>0.4) or high (>0.7), to retain the highest possible stringency as well as least one network consisting of a node with more than 3 neighbors. Relative spatial orientations of genes within those networks were adjusted manually to enhance reader clarity. Gene Annotation Tool to Help Explain Relationships, GATHER (http://gather.genome.duke.edu/)57 is a web-based tool for gene annotations. We entered lists of genes relevant for each of the networks separately, and investigated KEGG pathway annotations that were overrepresented in the chosen network to gain a sense of how the network was functioning. From the listing of significant pathways (P < 0.05), we further selected those with Bays factor ≥ 1 that consisted of at least 2 genes.
Disclosure of Potential Conflicts of Interest
No potential conflicts of interest were disclosed.
Acknowledgments
The authors thank all those who were involved in the sample collection and processing, especially Rebecca Oldham, Anne-Marie Gibson, Hayley Candler, Kelly Steel, and Juanjuan Fu for their invaluable help in the collection of samples. We gratefully appreciate the help of Kelly Fakes Michelle Gleeson and Bridgette in the processing of samples and all the participants who volunteered in the study. This study was partially supported by a grant from Asthma Foundation NSW, Australia and The University of Newcastle.
Glossary
Abbreviations:
- EA
eosinophilic asthma
- PGA
paucigranulocytic asthma
- NA
neutrophilic asthma
- BMI
body mass index
- FENO
fractional exhaled nitric oxide
- FEV1
forced expired volume in one second
- FVC
forced vital capacity
- ACQ
Asthma Control Questionnaire
- cAMP
cyclic adenosine monophosphate
- ECM
extracellular matrix
References
- 1.Simpson JL, Scott R, Boyle MJ, Gibson PG. Inflammatory subtypes in asthma: assessment and identification using induced sputum. Respirology. 2006;11:54–61. doi: 10.1111/j.1440-1843.2006.00784.x. [DOI] [PubMed] [Google Scholar]
- 2.Baines KJ, Simpson JL, Wood LG, Scott RJ, Gibson PG. Transcriptional phenotypes of asthma defined by gene expression profiling of induced sputum samples. J Allergy Clin Immunol. 2011;127:153–60, e1-9. doi: 10.1016/j.jaci.2010.10.024. [DOI] [PubMed] [Google Scholar]
- 3.Cahill N, Bergh AC, Kanduri M, Göransson-Kultima H, Mansouri L, Isaksson A, Ryan F, Smedby KE, Juliusson G, Sundström C, et al. 450K-array analysis of chronic lymphocytic leukemia cells reveals global DNA methylation to be relatively stable over time and similar in resting and proliferative compartments. Leukemia. 2013;27:150–8. doi: 10.1038/leu.2012.245. [DOI] [PubMed] [Google Scholar]
- 4.Brand S, Kesper DA, Teich R, Kilic-Niebergall E, Pinkenburg O, Bothur E, Lohoff M, Garn H, Pfefferle PI, Renz H. DNA methylation of TH1/TH2 cytokine genes affects sensitization and progress of experimental asthma. J Allergy Clin Immunol. 2012;129:1602–, e6. doi: 10.1016/j.jaci.2011.12.963. [DOI] [PubMed] [Google Scholar]
- 5.Kesper D, Brand S, Pinkenburg RO, Garn H, Pfefferle PI, Renz H. DNA demethylation of the IFNγ locus attenuates experimentally induced asthma. Pneumologie. 2012;66:A214. doi: 10.1055/s-0032-1315480. [DOI] [Google Scholar]
- 6.Tomita K, Lim S, Hanazawa T, Usmani O, Stirling R, Chung KF, Barnes PJ, Adcock IM. Attenuated production of intracellular IL-10 and IL-12 in monocytes from patients with severe asthma. Clin Immunol. 2002;102:258–66. doi: 10.1006/clim.2001.5176. [DOI] [PubMed] [Google Scholar]
- 7.Rivier A, Pène J, Rabesandratana H, Chanez P, Bousquet J, Campbell AM. Blood monocytes of untreated asthmatics exhibit some features of tissue macrophages. Clin Exp Immunol. 1995;100:314–8. doi: 10.1111/j.1365-2249.1995.tb03670.x. [DOI] [PMC free article] [PubMed] [Google Scholar]
- 8.Bains SN, Tourkina E, Atkinson C, Joseph K, Tholanikunnel B, Chu HW, Riemer EC, Martin R, Hoffman S. Loss of caveolin-1 from bronchial epithelial cells and monocytes in human subjects with asthma. Allergy. 2012;67:1601–4. doi: 10.1111/all.12021. [DOI] [PMC free article] [PubMed] [Google Scholar]
- 9.Pignatti P, Moscato G, Casarini S, Delmastro M, Poppa M, Brunetti G, Pisati P, Balbi B. Downmodulation of CXCL8/IL-8 receptors on neutrophils after recruitment in the airways. J Allergy Clin Immunol. 2005;115:88–94. doi: 10.1016/j.jaci.2004.08.048. [DOI] [PubMed] [Google Scholar]
- 10.Riek AE, Oh J, Sprague JE, Timpson A, de las Fuentes L, Bernal-Mizrachi L, Schechtman KB, Bernal-Mizrachi C. Vitamin D suppression of endoplasmic reticulum stress promotes an antiatherogenic monocyte/macrophage phenotype in type 2 diabetic patients. J Biol Chem. 2012;287:38482–94. doi: 10.1074/jbc.M112.386912. [DOI] [PMC free article] [PubMed] [Google Scholar]
- 11.Franceschini A, Szklarczyk D, Frankild S, Kuhn M, Simonovic M, Roth A, Lin J, Minguez P, Bork P, von Mering C, et al. STRING v9.1: protein-protein interaction networks, with increased coverage and integration. Nucleic Acids Res. 2013;41:D808–15. doi: 10.1093/nar/gks1094. [DOI] [PMC free article] [PubMed] [Google Scholar]
- 12.Baines KJ, Simpson JL, Wood LG, Scott RJ, Fibbens NL, Powell H, Cowan DC, Taylor DR, Cowan JO, Gibson PG. Sputum gene expression signature of 6 biomarkers discriminates asthma inflammatory phenotypes. J Allergy Clin Immunol. 2014;133:997–1007. doi: 10.1016/j.jaci.2013.12.1091. [DOI] [PubMed] [Google Scholar]
- 13.Rossnerova A, Tulupova E, Tabashidze N, Schmuczerova J, Dostal M, Rossner P, Jr., Gmuender H, Sram RJ. Factors affecting the 27K DNA methylation pattern in asthmatic and healthy children from locations with various environments. Mutat Res. 2013;741-742:18–26. doi: 10.1016/j.mrfmmm.2013.02.003. [DOI] [PubMed] [Google Scholar]
- 14.Runyon RS, Cachola LM, Rajeshuni N, Hunter T, Garcia M, Ahn R, Lurmann F, Krasnow R, Jack LM, Miller RL, et al. Asthma discordance in twins is linked to epigenetic modifications of T cells. PLoS One. 2012;7:e48796. doi: 10.1371/journal.pone.0048796. [DOI] [PMC free article] [PubMed] [Google Scholar]
- 15.Morales E, Bustamante M, Vilahur N, Escaramis G, Montfort M, de Cid R, Garcia-Esteban R, Torrent M, Estivill X, Grimalt JO, et al. DNA hypomethylation at ALOX12 is associated with persistent wheezing in childhood. Am J Respir Crit Care Med. 2012;185:937–43. doi: 10.1164/rccm.201105-0870OC. [DOI] [PubMed] [Google Scholar]
- 16.Shang Y, Das S, Rabold R, Sham JSK, Mitzner W, Tang WY. Epigenetic alterations by DNA methylation in house dust mite-induced airway hyperresponsiveness. Am J Respir Cell Mol Biol. 2013;49:279–87. doi: 10.1165/rcmb.2012-0403OC. [DOI] [PMC free article] [PubMed] [Google Scholar]
- 17.Michel S, Busato F, Genuneit J, Pekkanen J, Dalphin JC, Riedler J, Mazaleyrat N, Weber J, Karvonen AM, Hirvonen MR, et al. PASTURE study group Farm exposure and time trends in early childhood may influence DNA methylation in genes related to asthma and allergy. Allergy. 2013;68:355–64. doi: 10.1111/all.12097. [DOI] [PubMed] [Google Scholar]
- 18.Reinius LE, Acevedo N, Joerink M, Pershagen G, Dahlén S-E, Greco D, Söderhäll C, Scheynius A, Kere J. Differential DNA methylation in purified human blood cells: implications for cell lineage and studies on disease susceptibility. PLoS One. 2012;7:e41361. doi: 10.1371/journal.pone.0041361. [DOI] [PMC free article] [PubMed] [Google Scholar]
- 19.Sumino K, Tucker J, Shahab M, Jaffee KF, Visness CM, Gern JE, Bloomberg GR, Holtzman MJ. Antiviral IFN-γ responses of monocytes at birth predict respiratory tract illness in the first year of life. J Allergy Clin Immunol. 2012;129:1267–73, e1. doi: 10.1016/j.jaci.2012.02.033. [DOI] [PMC free article] [PubMed] [Google Scholar]
- 20.Liang Y, Wang P, Zhao M, Liang G, Yin H, Zhang G, Wen H, Lu Q. Demethylation of the FCER1G promoter leads to FcεRI overexpression on monocytes of patients with atopic dermatitis. Allergy. 2012;67:424–30. doi: 10.1111/j.1398-9995.2011.02760.x. [DOI] [PubMed] [Google Scholar]
- 21.Parker CWBM, Baumann ML, Huber MG. Alterations in cyclic AMP metabolism in human bronchial asthma. II. Leukocyte and lymphocyte responses to prostaglandins. J Clin Invest. 1973;52:1336–41. doi: 10.1172/JCI107305. [DOI] [PMC free article] [PubMed] [Google Scholar]
- 22.Landells LJ, Spina D, Souness JE, O’Connor BJ, Page CP. A biochemical and functional assessment of monocyte phosphodiesterase activity in healthy and asthmatic subjects. Pulm Pharmacol Ther. 2000;13:231–9. doi: 10.1006/pupt.2000.0248. [DOI] [PubMed] [Google Scholar]
- 23.Koga K, Takaesu G, Yoshida R, Nakaya M, Kobayashi T, Kinjyo I, Yoshimura A. Cyclic adenosine monophosphate suppresses the transcription of proinflammatory cytokines via the phosphorylated c-Fos protein. Immunity. 2009;30:372–83. doi: 10.1016/j.immuni.2008.12.021. [DOI] [PubMed] [Google Scholar]
- 24.Koga K, Takaesu G, Yoshida R, Nakaya M, Kobayashi T, Kinjyo I, Yoshimura A. Cyclic adenosine monophosphate suppresses the transcription of proinflammatory cytokines via the phosphorylated c-Fos protein. Immunity. 2009;30:372–83. doi: 10.1016/j.immuni.2008.12.021. [DOI] [PubMed] [Google Scholar]
- 25.Hanoune J, Defer N. Regulation and role of adenylyl cyclase isoforms. Annu Rev Pharmacol Toxicol. 2001;41:145–74. doi: 10.1146/annurev.pharmtox.41.1.145. [DOI] [PubMed] [Google Scholar]
- 26.Bachelet M, Vincent D, Havet N, Marrash-Chahla R, Pradalier A, Dry J, Vargaftig BB. Reduced responsiveness of adenylate cyclase in alveolar macrophages from patients with asthma. J Allergy Clin Immunol. 1991;88:322–8. doi: 10.1016/0091-6749(91)90093-4. [DOI] [PubMed] [Google Scholar]
- 27.Masada N, Ciruela A, Macdougall DA, Cooper DMF. Distinct mechanisms of regulation by Ca2+/calmodulin of type 1 and 8 adenylyl cyclases support their different physiological roles. J Biol Chem. 2009;284:4451–63. doi: 10.1074/jbc.M807359200. [DOI] [PMC free article] [PubMed] [Google Scholar]
- 28.Nagdeote AN. Study of defect in calcium Homeostasis in Asthmatic children. JPBMS. 2011;12 [Google Scholar]
- 29.Bialasiewicz P, Nowak D, Krol M, Antczak A. Altered intracellular calcium signalling after PAF stimulations in polymorphonuclear leukocytes from asthmatic patients. J Lipid Mediat Cell Signal. 1997;17:21–30. doi: 10.1016/S0929-7855(97)00018-7. [DOI] [PubMed] [Google Scholar]
- 30.Mahn K, Hirst SJ, Ying S, Holt MR, Lavender P, Ojo OO, Siew L, Simcock DE, McVicker CG, Kanabar V, et al. Diminished sarco/endoplasmic reticulum Ca2+ ATPase (SERCA) expression contributes to airway remodelling in bronchial asthma. Proc Natl Acad Sci U S A. 2009;106:10775–80. doi: 10.1073/pnas.0902295106. [DOI] [PMC free article] [PubMed] [Google Scholar]
- 31.Trian T, Benard G, Begueret H, Rossignol R, Girodet PO, Ghosh D, Ousova O, Vernejoux JM, Marthan R, Tunon-de-Lara JM, et al. Bronchial smooth muscle remodeling involves calcium-dependent enhanced mitochondrial biogenesis in asthma. J Exp Med. 2007;204:3173–81. doi: 10.1084/jem.20070956. [DOI] [PMC free article] [PubMed] [Google Scholar]
- 32.Akiyoshi J, Moriyama T, Isogawa K, Miyamoto M, Sasaki I, Kuga K, Yamamoto H, Yamada K, Fujii I. CCK-4-induced calcium mobilization in T cells is enhanced in panic disorder. J Neurochem. 1996;66:1610–6. doi: 10.1046/j.1471-4159.1996.66041610.x. [DOI] [PubMed] [Google Scholar]
- 33.Geldenhuys WJ, Kuzenko SR, Simmons MA. Virtual screening to identify novel antagonists for the G protein-coupled NK3 receptor. J Med Chem. 2010;53:8080–8. doi: 10.1021/jm1010012. [DOI] [PubMed] [Google Scholar]
- 34.Miller CW, Casimir DA, Ntambi JM. The mechanism of inhibition of 3T3-L1 preadipocyte differentiation by prostaglandin F2alpha. Endocrinology. 1996;137:5641–50. doi: 10.1210/endo.137.12.8940395. [DOI] [PubMed] [Google Scholar]
- 35.Holden CA, Chan SC, Hanifin JM. Monocyte localization of elevated cAMP phosphodiesterase activity in atopic dermatitis. J Invest Dermatol. 1986;87:372–6. doi: 10.1111/1523-1747.ep12524844. [DOI] [PubMed] [Google Scholar]
- 36.Gantner F, Kupferschmidt R, Schudt C, Wendel A, Hatzelmann A. In vitro differentiation of human monocytes to macrophages: change of PDE profile and its relationship to suppression of tumour necrosis factor-α release by PDE inhibitors. Br J Pharmacol. 1997;121:221–31. doi: 10.1038/sj.bjp.0701124. [DOI] [PMC free article] [PubMed] [Google Scholar]
- 37.Shepherd MC, Baillie GS, Stirling DI, Houslay MD. Remodelling of the PDE4 cAMP phosphodiesterase isoform profile upon monocyte-macrophage differentiation of human U937 cells. Br J Pharmacol. 2004;142:339–51. doi: 10.1038/sj.bjp.0705770. [DOI] [PMC free article] [PubMed] [Google Scholar]
- 38.Manning CD, McLaughlin MM, Livi GP, Cieslinski LB, Torphy TJ, Barnette MS. Prolonged beta adrenoceptor stimulation up-regulates cAMP phosphodiesterase activity in human monocytes by increasing mRNA and protein for phosphodiesterases 4A and 4B. J Pharmacol Exp Ther. 1996;276:810–8. [PubMed] [Google Scholar]
- 39.Melén E, Kho AT, Sharma S, Gaedigk R, Leeder JS, Mariani TJ, Carey VJ, Weiss ST, Tantisira KG. Expression analysis of asthma candidate genes during human and murine lung development. Respir Res. 2011;12:86. doi: 10.1186/1465-9921-12-86. [DOI] [PMC free article] [PubMed] [Google Scholar]
- 40.Eberth S, Schneider B, Rosenwald A, Hartmann EM, Romani J, Zaborski M, Siebert R, Drexler HG, Quentmeier H. Epigenetic regulation of CD44 in Hodgkin and non-Hodgkin lymphoma. BMC Cancer. 2010;10:517. doi: 10.1186/1471-2407-10-517. [DOI] [PMC free article] [PubMed] [Google Scholar]
- 41.Gaffin J. Beta-2-Adrenergic Receptor Methylation may influence Asthma Phenotype in The School Inner City Asthma Study. Receptors & Clinical Investigaton. 2014;1 doi: 10.14800/rci.15. [DOI] [PMC free article] [PubMed] [Google Scholar]
- 42.Wang C, Salam MT, Islam T, Wenten M, Gauderman WJ, Gilliland FD. Effects of in utero and childhood tobacco smoke exposure and β2-adrenergic receptor genotype on childhood asthma and wheezing. Pediatrics. 2008;122:e107–14. doi: 10.1542/peds.2007-3370. [DOI] [PMC free article] [PubMed] [Google Scholar]
- 43.Coulson FR, Fryer AD. Muscarinic acetylcholine receptors and airway diseases. Pharmacol Ther. 2003;98:59–69. doi: 10.1016/S0163-7258(03)00004-4. [DOI] [PubMed] [Google Scholar]
- 44.Maugeri N, Powell JE, ’t Hoen PA, de Geus EJ, Willemsen G, Kattenberg M, Henders AK, Wallace L, Penninx B, Hottenga JJ, et al. LPAR1 and ITGA4 regulate peripheral blood monocyte counts. Hum Mutat. 2011;32:873–6. doi: 10.1002/humu.21536. [DOI] [PubMed] [Google Scholar]
- 45.Goss AM, Tian Y, Cheng L, Yang J, Zhou D, Cohen ED, Morrisey EE. Wnt2 signaling is necessary and sufficient to activate the airway smooth muscle program in the lung by regulating myocardin/Mrtf-B and Fgf10 expression. Dev Biol. 2011;356:541–52. doi: 10.1016/j.ydbio.2011.06.011. [DOI] [PMC free article] [PubMed] [Google Scholar]
- 46.Ferreira JC, Choufani S, Grafodatskaya D, Butcher DT, Zhao C, Chitayat D, Shuman C, Kingdom J, Keating S, Weksberg R. WNT2 promoter methylation in human placenta is associated with low birthweight percentile in the neonate. Epigenetics. 2011;6:440–9. doi: 10.4161/epi.6.4.14554. [DOI] [PubMed] [Google Scholar]
- 47.Rowan WC, Smith JL, Affleck K, Amour A. Targeting phosphoinositide 3-kinase δ for allergic asthma. Biochem Soc Trans. 2012;40:240–5. doi: 10.1042/BST20110665. [DOI] [PubMed] [Google Scholar]
- 48.Ito K, Caramori G, Adcock IM. Therapeutic potential of phosphatidylinositol 3-kinase inhibitors in inflammatory respiratory disease. J Pharmacol Exp Ther. 2007;321:1–8. doi: 10.1124/jpet.106.111674. [DOI] [PubMed] [Google Scholar]
- 49.Kobayashi Y, Bossley C, Gupta A, Akashi K, Tsartsali L, Mercado N, Barnes PJ, Bush A, Ito K. Passive smoking impairs histone deacetylase-2 in children with severe asthma. Chest. 2014;145:305–12. doi: 10.1378/chest.13-0835. [DOI] [PMC free article] [PubMed] [Google Scholar]
- 50.Arora R, Metzger RJ, Papaioannou VE. Multiple roles and interactions of Tbx4 and Tbx5 in development of the respiratory system. PLoS Genet. 2012;8:e1002866. doi: 10.1371/journal.pgen.1002866. [DOI] [PMC free article] [PubMed] [Google Scholar]
- 51.Schuster GU, Kenyon NJ, Stephensen CB. Vitamin A deficiency decreases and high dietary vitamin A increases disease severity in the mouse model of asthma. J Immunol. 2008;180:1834–42. doi: 10.4049/jimmunol.180.3.1834. [DOI] [PubMed] [Google Scholar]
- 52.Juniper EF, O’Byrne PM, Guyatt GH, Ferrie PJ, King DR. Development and validation of a questionnaire to measure asthma control. Eur Respir J. 1999;14:902–7. doi: 10.1034/j.1399-3003.1999.14d29.x. [DOI] [PubMed] [Google Scholar]
- 53.Simpson JL, McElduff P, Gibson PG. Assessment and reproducibility of non-eosinophilic asthma using induced sputum. Respiration. 2010;79:147–51. doi: 10.1159/000245899. [DOI] [PubMed] [Google Scholar]
- 54.Bibikova M, Le J, Barnes B, Saedinia-Melnyk S, Zhou L, Shen R, Gunderson KL. Genome-wide DNA methylation profiling using Infinium® assay. Epigenomics. 2009;1:177–200. doi: 10.2217/epi.09.14. [DOI] [PubMed] [Google Scholar]
- 55.Gentleman RC, Carey VJ, Bates DM, Bolstad B, Dettling M, Dudoit S, Ellis B, Gautier L, Ge Y, Gentry J, et al. Bioconductor: open software development for computational biology and bioinformatics. Genome Biol. 2004;5:R80. doi: 10.1186/gb-2004-5-10-r80. [DOI] [PMC free article] [PubMed] [Google Scholar]
- 56.Sean Davis PD, Sven Bilke, Tim Triche, Jr., Moiz Bootwalla. methylumi: Handle Illumina methylation data. R package version 2.11.1. 2014
- 57.Chang JT, Nevins JR., Jr. GATHER: a systems approach to interpreting genomic signatures. Bioinformatics. 2006;22:2926–33. doi: 10.1093/bioinformatics/btl483. [DOI] [PubMed] [Google Scholar]