

Abstract
Resident microglia and blood-borne macrophages have both been implicated to play a dominant role in mediating the neuroinflammatory response affecting implanted intracortical microelectrodes. However, the distinction between each cell type has not been demonstrated due to a lack of discriminating cellular markers. Understanding the subtle differences of each cell population in mediating neuroinflammation can aid in determining the appropriate therapeutic approaches to improve microelectrode performance. Therefore, the goal of this study is to characterize the role of infiltrating blood-derived cells, specifically macrophages, in mediating neuroinflammation following intracortical microelectrode implantation. Interestingly, we found no correlation between microglia and neuron populations at the microelectrode-tissue interface. On the other hand, blood-borne macrophages consistently dominated the infiltrating cell population following microelectrode implantation. Most importantly, we found a correlation between increased populations of blood-derived cells (including the total macrophage population) and neuron loss at the microelectrode-tissue interface. Specifically, the total macrophage population was greatest at two and sixteen weeks post implantation, at the same time points when we observed the lowest densities of neuronal survival in closest proximity to the implant. Together, our results suggest a dominant role of infiltrating macrophages, and not resident microglia, in mediating neurodegeneration following microelectrode implantation.
Keywords: Microelectrode, Neuroinflammation, Microglia, Macrophage
1. Introduction
Microelectrode technology is emerging as a promising tool in both basic neuroscience and functional rehabilitation applications [1,2]. Intracortical microelectrodes can record signals from individual or small populations of neurons within the brain. Recorded signals can then be used as control signals to functionally map neuronal circuits and advance our understanding of normal brain function as well as the progression of several diseased states [3–6]. In addition, recent advances in microelectrode technology have enabled researchers to use recorded signals to control several assist devices for rehabilitation applications [7–11].
Despite the enormous potential in using intracortical micro-electrodes in both research and clinical settings, microelectrode technology is limited by the diminishing ability to consistently record high-quality signals over time [12–14]. To this end, significant efforts have been made to elucidate the mechanisms of microelectrode failure over time. Increasing evidence suggests a dominant role of the neuroinflammatory response in mediating mechanical-, material- and biological-mediated failure of intra-cortical microelectrodes [15–17]. Specifically, several groups have suggested a dominant role of microglia and infiltrating blood-derived cells in mediating the neuroinflammatory events following microelectrode implantation [18–21].
Rennekar et al. established the first connection between neuro-inflammation and intracortical microelectrode recording quality in 2007 by using the anti-inflammatory drug minocycline to improve the longevity of recorded neuronal signals [19]. Minocycline, a known antibiotic, can inhibit activation of microglia and macrophages by blocking the nuclear factor kappa-light-chain-enhancer of activated B cells (NF-κβ) pathway, as well as inhibiting cell apoptosis by down-regulating tumor-necrosis factor-alpha (TNF-α) production by activated T-lymphocytes (T-cells) [22,23]. Specifically, Rennekar and colleagues showed increased signal to noise ratios and reduced astroglial scar formation in animals receiving mino-cycline, compared to animals without treatment. More recent studies have demonstrated the potential importance of myeloid cells in mediating neuroinflammatory events and chronic recording stability to implanted intracortical microelectrodes. For example, Saxena and colleagues found a direct correlation between blood--brain barrier disruption and recording quality [18]. Specifically, the authors showed that the presence of infiltrating myeloid cells at sixteen weeks post-implantation correlated with chronic neuro-inflammation and loss in recording function [18].
In addition to infiltrating blood-derived cells, Winslow et al. first suggested the correlation between blood–brain barrier integrity and neuroinflammation at the microelectrode tissue interface by quantifying IgG+ immunoreactivity at the microelectrode interface [24]. Building off the work from Tresco’s laboratory, Potter et al. also suggested the role of extravasated serum proteins in propagating self-perpetuating neuroinflammatory events at the microelectrode-tissue interface by correlating chronic blood–brain barrier dysfunction with neurodegeneration directly surrounding the implanted microelectrodes [21]. Further, the authors also showed that preventing the accumulation of reactive oxygen species using resveratrol significantly improved blood–brain barrier integrity and neuronal viability [21]. Interestingly, resveratrol is a naturally occurring anti-oxidant that controls the accumulation of reactive oxygen species through Toll-like receptor 4 (TLR-4) found on microglia, macrophages and other blood-derived ells leading to activation of NF-κβ mediated pathways [25,26].
Collectively, these studies suggest a correlation between microelectrode-mediated neurodegeneration and either microglia or infiltrating blood-derived serum and cellular components. However, due to a lack of discriminating cellular markers, a distinction between microglia and macrophages in this process has been elusive. Additionally, the temporal role that blood-derived cells play in mediating neuroinflammation to implanted micro-electrodes remains unclear. A detailed understanding of the temporal contribution that specific cell types play in the neuroinflammatory response to microelectrodes is essential to engineer the appropriate therapeutic approach to improve micro-electrode performance. To decouple the role of infiltrating blood-derived cells from that of resident microglia, we generated chimera mice with cyan fluorescent protein (CFP) blood-derived cells in a C57/BL6 background mouse strain. Here, we first validated the chimera itself had no effect on the neuroinflammatory response to implanted microelectrodes. Then, we characterized the role of blood-derived cells and independently investigated the role of microglia versus macrophages in mediating neuroinflammation to implanted intracortical microelectrodes.
2. Methods
All mice used in this study were obtained from Jackson Laboratory (C57/BL6 strain #000664; cyan fluorescent protein (CFP+) on C57/BL6 background strain #004218). All animal care and use were in accordance to protocols established by Case Western Reserve University, Institutional Animal Care and Use Committee and guidelines from the National Institutes of Health, Principles of Laboratory Animal Care on the Ethical use of Animals.
2.1. Bone marrow chimera model
All bone marrow chimera mice were constructed according to previously described protocols [27]. A schematic illustration of bone marrow chimera experiments is shown in Fig. 1. Briefly, male C57/BL6 mice were irradiated at ~4 weeks of age with 1000 rad Cs137 gamma rays. Male, cyan fluorescent protein (CFP+) donor mice (bred on a C57/BL6 background) were euthanized under CO2 asphyxiation. Femur and tibia bones were then isolated from the CFP+ donor mouse. Bone marrow cells were flushed out of the femur and tibia bones into sterile DMEM + 10% Fetal Bovine Serum (FBS) cell culture media. Following isolation, red blood cells were lysed using Ammonium-Chloride-Potassium (ACK) lysis buffer (Life Technologies) at least twice, or until the cell pellet was void of red color. Next, the cell suspension was strained through a 40 μm cell strainer and live cell counts were obtained using a hemocytometer and trypan blue staining. Cells were resuspended at a concentration of 15–25 million cells/mL in sterile Hanks Balanced Salt Solution (HBSS) and stored on ice until transplantation (usually less than 1 h). Approximately 4–6 h following radiation, 200 μL of isolated bone marrow cells (~3–5 million cells) were transplanted into irradiated mice via tail vein injection. Following transplantation, mice were fed normal food and acidified water (pH 3.0 using hydrochloric acid) for a fourteen-day recovery period.
Fig. 1.
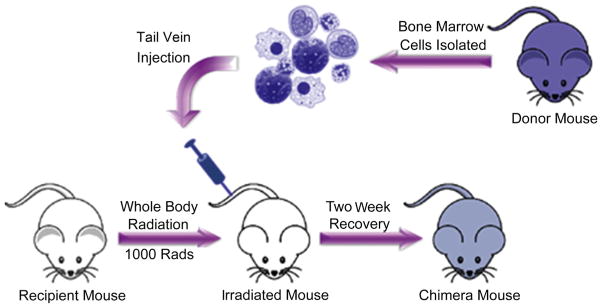
Schematic illustration of chimera mouse generation. Mice were irradiated with 1000 rad of Cs137 γ radiation. Bone marrow cells were isolated from the femur of a fluorescent protein (CFP+) donor mouse and transplanted into the irradiated mice via tail vein injection. Following transplantation, mice were fed normal food and acidic pH 3.0 water for a fourteen-day recovery period.
2.2. Assessment of transplant efficiency
One mouse within each batch of chimeras received radiation but was not transplanted with bone marrow cells from the CFP+ donor mouse. Irradiated mice that did not receive a bone marrow transplant died within ten to fourteen days post radiation, verifying that bone marrow transplant was necessary for survival. Transplant efficiency was further verified using complete blood count (CBC) analysis and Fluorescence-activated cell sorting (FACS) analysis. To perform CBC analysis, 30 μL of whole blood was collected from the tail vein of chimera, WT and CFP+ mice and combined with 5 μL 10X Heparin (Sigma). All samples were placed on ice immediately after blood collection and CBC analysis was performed using a Hemavet 950FS within 30 min of blood collection.
FACS analysis was performed at two, four and eight weeks post implantation using blood samples collected from chimera, wildtype and CFP+ mice. Specifically, 200 μL whole blood was collected from the tail vein along with 70 μL of 1X Heparin. Additionally, at sixteen weeks, chimera, wildtype and CFP+ mice were euthanized by CO2 affixation. Blood was then collected by cardiac puncture and the spleen, bone marrow and lymph nodes were harvested from each mouse. A minimum of four mice was used per condition at each time point. Collected blood and all harvested tissue was placed on ice and kept on ice throughout the staining procedure.
Single cell suspensions were then made from spleen, lymph nodes and bone marrow. Spleen and lymph nodes were strained through a 40 μm tissue strainer using a 1 mL syringe plunger and suspended in 1X PBS and 5% goat serum (FACS buffer). Bone marrow cells were flushed out of the femur and tibia bones into DMEM + 10% Fetal Bovine Serum (FBS) cell culture media. Blood, spleen and bone marrow homogenates treated with ACK lysis buffer (Life Technologies) at least twice to lyse red blood cells, or until the cell pellet was void of red color. For each sample, live cell counts were then obtained using a hemocytometer and trypan blue staining. Cells were then plated onto a 96-well plate at a concentration of 1 million cells/well. Cell suspensions were stained with fluorescein isothiocyanate (FITC) conjugated CD45 antibody (11-0451-81, eBioscience) and phycoerythrin (PE) conjugated F4/80 antibody (MCA497APC, AbD Serotec) at a dilution of 1:100, to label hemapoietic cells and macrophages, respectively. All samples were counterstained with 7-Aminoactinomycin D (7-AAD) to exclude non-viable cells from analysis. Specifically, 7-AAD is a fluorescent compound that does not pass through intact cell membranes (live cells) and only passes through disrupted and permeable cell membranes (dead cells) [28]. Further, isotype controls for CD45 (Rat IgG2b K Isotype Control FITC, 53-4031-80, eBioscience) and F4/ 80 (Rat IgG2a K Isotype Control PE, MCA1125APC, Abd Serotec) were used to determine the level of background staining. All samples were run on a BD™ LSR II Flow Cytometer at the Case Comprehensive Cancer Center Core Facility.
2.3. Surgical implantation of intracortical microelectrodes
To assess propagation of neuroinflammatory events following microelectrode implantation, a sterile, single-shank, non-functional ‘Michigan-style’ silicon microelectrode (2 mm × 123 μm × 15 μm) was implanted in wildtype and chimera mice for two, four, eight or sixteen weeks according to previously published protocols [29,30]. All surgeries in this study were performed in a class II sterile hood by the same surgeon to minimize infection and variability, respectively. Briefly, mice were anesthetized with isoflurane and mounted onto a stereotaxic frame. The head was shaved and a sterile field was maintained throughout the surgery. Meloxicam (0.7 mL, 1.15 mg/ mL), marcaine (100 μL, 0.25%), and cefazolin (16 mg/kg) were administered by subcutaneous (SQ) injection. An incision was made down the midline and a 3 mm hole was made using a biopsy punch 1 mm lateral to the midline and 2 mm caudal to bregma. A single microelectrode was then manually implanted at the site where the bone plug was removed, taking precaution to avoid damaging any major vasculature. Following microelectrode implantation, the brain tissue was sealed with Kwik-Sil (World Precision Instruments) and the microelectrode was tethered to the skull with uv-cured liquid dentin (Fusio/Flow-it ALC). The surgical site was then closed using 5-0 monofilament polypropylene suture.
2.4. Tissue processing
At two, four, eight and sixteen weeks post implantation, mice were perfused and brain tissue was cryoprotected according to methods previously described [29,30]. Briefly, mice were anesthetized with an intraperitoneal (IP) injection of rodent cocktail (150 μl 100 mg/ml Ketamine HCl, 150 μl 20 mg/ml Xylazine HCl, 50 μl 10 mg/ml Acepromazine). Mice were then transcardially perfused with phosphate buffered saline (PBS) and fixed with 4% paraformaldehyde (PFA). Following perfusion, brains were extracted and post-fixed for an additional two days in 4% PFA at 4 °C. Brains were then equilibrated in 30% sucrose for ~72 h and cryopreserved in optimal cutting temperature compound (OCT). Following cryopreservation, 16 μm thick horizontal sections were collected and directly mounted onto glass slides. All slides were stored at −80 °C until immunohistochemistry was performed.
2.5. Immunohistochemistry
2.5.1. Antibodies
The following primary antibodies were used in this study: rat mAb to CD68 [FA-11] (1:500, ab53444, Abcam), GFAP polyclonal rabbit antiserum (1:500, RA22101, Neuromics), rabbit anti-mouse lgG (1:1000, STAR26B AbD Serotec), mouse anti-NeuN clone A60 (1:250, MAB377, Millipore), goat anti-Iba1 antibody (1:100, ab107159 Abcam), 6556) and rabbit polyclonal to anti-GFP (1:500, ab6556 Abcam).
The following secondary antibodies were used in this study: chicken anti rat AlexaFluor™ 488 (1:1000, A21470, Life Technologies), chicken anti rabbit AlexaFluor™ 488 (1:1000, A21441, Life Technologies), chicken anti goat AlexaFluor™594 (1:1000, A21468, Life Technologies), chicken anti rabbit AlexaFluor™ 594 (1:1000, A21442, Life Technologies).
2.5.2. Assessment of neuroinflammation
Immunohistological (IHC) analysis of neuroinflammatory associated cellular markers (microglia/macrophages, activated microglia/macrophages and astrocytes) as well as blood protein Immunoglobulin G (IgG) was performed in wildtype and chimera mice to quantify the extent of the neuroinflammatory response at the tissue–electrode interface, as previously described [29,30]. Additionally, IHC analysis of CFP+ cells was also performed in chimera mice in order to quantify the populations of infiltrating blood-derived cells over time surrounding the microelectrode. First, tissue sections were equilibrated to room temperature (RT) for 30 min and slides were washed with PBS to remove the remaining OCT. Tissue sections were then permeated by incubating in 0.1% Triton-X (PBS-T) for 15 min. Following tissue permeation, sections were blocked in 4% chicken serum for 1 h at RT. Primary antibodies diluted in blocking buffer targeting specific antigens (IBA1+, 1:100; CD68+, 1:500; IgG 1; 1000 or CFP+, 1:500) were then added to their respective tissue sections and incubated for 18–22 h at 4 °C. To remove unbound primary antibody, tissue sections were washed with PBS-T six times. Next, tissue sections were incubated in secondary antibodies corresponding to the primary antibodies (see Section 2.5.1) for 2 h at RT. To remove unbound secondary antibody, tissue sections were washed in PBS-T six times followed by PBS for an additional three times. Additionally, tissue sections were incubated with 0.5 mM copper sulfate buffer for 10 min at RT following previously established methods [31] to minimize tissue autofluorescence. Following CuSO4 treatment, all slides were washed thoroughly with ddH2O, mounted using Fluoromount-G, sealed with a coverslip and stored in the dark at 4 °C until imaged.
2.5.3. Assessment of neuronal density
Neuronal densities were assessed using diaminobenzidine (DAB) histochemistry following the methods previously described [29,30]. Tissue sections were equilibrated to RT and permeated as described in Section 2.7.1. Next, tissue sections were blocked in 4% goat serum for 1 h at RT. Primary antibody specific to neuronal nuclei (NeuN) was then added to the tissue sections at 1:250 diluted in blocking buffer for 1 h at RT. To remove unbound primary antibody, tissue sections were washed with PBS three times. Next, 100 μl horseradish peroxidase (HRP) polymer conjugate was added to each tissue section for 10 min. Unbound HRP polymer conjugate was subsequently removed by washing tissue sections with PBS three times. Next, 100 μl of DAB chromogen was added to each tissue section for 5 min. Following DAB staining, tissue sections were rinsed thoroughly with ddH2O, counterstained with hematoxylin, mounted using Histomount and stored at RT until imaged.
2.5.4. Assessment of co-localization
In order to assess co-localization of cellular markers IBA1+ (microglia and macrophages) and CFP+ (blood-derived ells) as well as CD68+ (activated microglia and macrophages) and CFP+, IHC staining was performed with slight modifications from protocols described in Section 2.5.2. First, tissue sections were equilibrated to RT and permeated with PBS-T as described previously. The sections were then blocked with 4% chicken serum for 24 h at RT to ensure minimal non-specific binding of primary and secondary antibodies to the tissue sections. Primary antibodies diluted in blocking buffer targeting specific antigens (IBA1+, 1:100; CD68+, 1:500 or CFP+, 1:500) were then added to their respective tissue samples and incubated for 36 h at 4 °C. To remove unbound primary antibody, the tissue sections were washed three times with PBS-T for 15 min each, followed by three additional washes with PBS-T for 45 min each on a rocker plate. Tissue sections were then incubated with secondary antibodies corresponding to their respective primary antibodies (see Section 2.5.1) for 18–22 h at 4 °C. Next, to remove any unbound secondary antibodies, samples were washed three times with PBS-T for 15 min each, followed by three additional washes with PBS for 45 min each on a rocker plate. Tissue auto-fluorescence was then minimized with a 10 min incubation of 0.5 mM CuSO4. Tissue sections were then thoroughly washed with ddH2O, mounted using Fluoromount-G, sealed with a coverslip and stored in the dark at 4 °C until imaged.
2.6. Image analysis
All images were acquired using a Carl Zeiss inverted microscope according to protocols previously described [29]. Briefly, fluorescent markers (GFAP+, CD68+, IgG+, IBA1+, CFP+) were imaged using an AxioCam MRm monochrome camera. NeuN stained DAB sections were imaged using an AxioCam ERc5 color camera. Exposure times were held constant for each fluorescent stain at all analyzed time points. In order to increase the field of view without compromising image resolution, sixteen separate 10x images were acquired using an automated stage and stitched together using MosaiX software. All quantification, analysis and statistical comparisons were performed on raw images. However, images reported here were cropped, pseudo-colored and slightly enhanced to increase clarity in presentation. In addition to 10x images, co-localized sections with IBA1+, CD68+, and CFP+ were also imaged using a 40x objective for enhanced visual display of co-localization at the interface.
2.7. Quantification
2.7.1. Assessment of neuroinflammation
Neuroinflammation was assessed at the microelectrode-tissue interface for GFAP+, CD68+, IgG+, IBA1+ stained sections, according to protocols previously described [29,30]. Following acquisition, unaltered fluorescent images were analyzed using a custom MATLAB program (MINUTE V1.5, Microelectrode Interface Universal Tool for Evaluation) [29,30]. Briefly, the implant region of each image was manually designated and the fluorescent intensity was extracted within the program in expanding 2 μm concentric intervals out to 1000 μm from the user-defined interface. Fluorescent intensities were then normalized to background signal, which was defined as approximately 600 μm from the implant site for each labeled antigen and the area under the curve was calculated from the intensity profile for each image to allow for statistical comparisons between conditions. Here, the data is reported as normalized fluorescent intensity as a function of distance from the implant.
2.7.2. Assessment of neuronal densities
Neuronal densities surrounding the implant was analyzed using a custom MATLAB code (NERD, Neurons Encompassed aRound the Device) using protocols previously described [29,30]. Briefly, the implant region was manually designated and the number of neurons in expanding concentric rings at fixed radial distances from the implant was calculated through user-defined location of neuronal cell bodies. Neuronal cell counts were then normalized to background counts from non-surgical, aged-matched control animals. Here, the data is reported as a percentage of neuronal density normalized to non-surgical age-matched control animals as a function of distance from the implant.
2.7.3. Characterization of infiltrating CFP+ cells
Infiltrating blood-derived cells were characterized by assessing CFP+ immunoreactivity in the brain tissue of chimera mice at each of the pre-determined time points following microelectrode implantation. Normalized fluorescent intensity profiles for CFP+ cells were calculated at two, four, eight and sixteen weeks post implantation as described in Section 2.7.1. Additionally, the area under the curve was calculated from the intensity profile for each image to allow for statistical comparisons between time points. Here, data is reported as the normalized fluorescent intensity as a function of distance from the implant.
In addition to quantifying populations of infiltrating blood-derived cells (CFP+ immunoreactivity), we also used co-localization analysis to quantify the percentage of macrophages within the following thee populations: infiltrating blood-derived cell population, total IBA1+ population and total CD68+ population. Following acquisition, co-localized images of IBA1+, CFP+ and CD68+ were analyzed using a custom MATLAB code (U-CLOSE, Understanding Cells Located On Small Electrodes). Within the graphic user interface of the MATALB program, the implant region was manually designated. Next, a background region was manually designated for each stain and the average background intensity, within the user-defined background region, was calculated for each stain within the code. The code was then designed to draw concentric rings at fixed radial distances from the user-defined implant region. The location of each pixel within each binned interval with an intensity greater than background was calculated within the code. Percent co-localization was then calculated within each of the binned intervals. For example, co-localization of IBA1+ and CFP+ immunoreactivity was assessed within the total population of CFP+ immunoreactivity to quantify the percentage of infiltrating population that were comprised of blood-borne macrophages (Equation (1)).
| (1) |
Similarly, co-localization of IBA1+ and CFP+ immunoreactivity was assessed within the total population of IBA1+ population to quantify the percentage of the total IBA1+ population that were comprised of blood-borne macrophages (Equation (2)).
| (2) |
Additionally, co-localization of CD68+ and CFP+ immunoreactivity was assessed within the total population of CD68+ population to quantify the percentage of the total CD68+ population that were comprised of activated blood-borne macrophages (Equation (3)).
| (3) |
Co-localization percentages (Equation (1)–3) were then multiplied by their respective intensity profile curves (CFP+, Equation (1); IBA1+, Equation (2), and CD68+, Equation (3)) to generate intensity profile curves of individual populations of macrophages, blood-derived cells excluding macrophages, and microglia surrounding the implant, over time. For visual clarity, the total intensity profile, as well as both individual populations, are reported for all three equations as a function of both distance and time post implantation.
2.8. Statistical analysis
All statistical analyses were performed using Minitab software (Minitab, Inc) using a general linear one-way analysis of variance (ANOVA) model. To account for dependencies between slices from the same animal, all statistical comparisons were then performed using independent animal averages (n = 4–7 animals for each cohort). Significance was considered as p < 0.05.
3. Results
3.1. Verification of transplant efficiency
Transplant efficiency of bone marrow chimeras was verified using complete blood count (CBC) analysis as well as FACS analysis at two, four, eight and sixteen weeks post microelectrode implantation. Table 1 shows CBC analysis of chimeras, wildtype and CFP+ mice. All of the cell populations analyzed were within normal limits for mice [32]. Further, CBC analysis of blood samples showed no significant difference between chimeras, wildtype or CFP+ mice, at any of the time points analyzed. Our results verified that bone marrow and blood cell populations were not affected by the chimera generation procedure.
Table 1.
All analyzed blood samples were within normal limits for mice for all cell populations. Further, no significant difference was observed in any of the cell populations across any time point between CFP+, wildtype and chimera mice. n = 4–7 for each cohort.
|
|
2 weeks
|
4 weeks
|
8 weeks
|
16 weeks
|
||||||||||
|---|---|---|---|---|---|---|---|---|---|---|---|---|---|---|
| Parameter and normal range | Cyan | Wildtype | Chimera | Cyan | Wildtype | Chimera | Cyan | Wildtype | Chimera | Cyan | Wildtype | Chimera | ||
| Leukocytes | ||||||||||||||
| WRB | 1.8–10.7 | (K/μL) | 8.16 ± 3.21 | 9.73 ± 2.46 | 8.42 ± 1.16 | 9.59 ± 1.23 | 7.94 ± 1.15 | 9.46 ± 0.78 | 9.94 ± 0.95 | 9.56 ± 0.50 | 9.84 ± 0.45 | 9.97 ± 0.57 | 10.5 ± 0.76 | 9.80 ± 0.72 |
| Neutrophil | 0.1–2.4 | (K/μL) | 1.42 ± 1.10 | 1.70 ± 0.85 | 1.41 ± 0.33 | 1.08 ± 0.21 | 1.27 ± 0.14 | 1.67 ± 0.06 | 1.88 ± 0.28 | 1.81 ± 0.41 | 1.58 ± 0.26 | 1.40 ± 0.23 | 1.55 ± 0.61 | 1.62 ± 0.40 |
| Leukocyte | 0.9–9.3 | (K/μL) | 6.04 ± 1.71 | 7.37 ± 1.31 | 6.46 ± 1.03 | 7.92 ± 0.88 | 6.29 ± 1.18 | 7.16 ± 0.72 | 7.44 ± 0.62 | 7.37 ± 0.80 | 7.81 ± 0.32 | 8.02 ± 0.30 | 8.47 ± 0.67 | 7.64 ± 0.30 |
| Monocyte | 0.0–0.4 | (K/μL) | 0.38 ± 0.18 | 0.35 ± 0.14 | 0.36 ± 0.03 | 0.29 ± 0.03 | 0.18 ± 0.08 | 0.40 ± 0.09 | 0.34 ± 0.05 | 0.23 ± 0.05 | 0.32 ± 0.06 | 0.30 ± 0.14 | 0.25 ± 0.08 | 0.35 ± 0.06 |
| Eosinophil | 0.0–0.2 | (K/μL) | 0.22 ± 0.20 | 0.21 ± 0.11 | 0.14 ± 0.07 | 0.23 ± 0.14 | 0.13 ± 0.05 | 0.17 ± 0.06 | 0.21 ± 0.10 | 0.10 ± 0.03 | 0.08 ± 0.01 | 0.18 ± 0.16 | 0.14 ± 0.06 | 0.11 ± 0.04 |
| Basophil | 0.0–0.2 | (K/μL) | 0.1 ± 0.09 | 0.09 ± 0.07 | 0.06 ± 0.03 | 0.08 ± 0.03 | 0.07 ± 0.03 | 0.05 ± 0.02 | 0.07 ± 0.03 | 0.05 ± 0.02 | 0.06 ± 0.02 | 0.06 ± 0.06 | 0.07 ± 0.03 | 0.08 ± 0.03 |
| Erythrocytes | ||||||||||||||
| RBC | 6.36–9.42 | (m/μL) | 6.79 ± 1.94 | 6.53 ± 0.88 | 6.39 ± 0.12 | 7.69 ± 0.13 | 6.83 ± 1.39 | 6.86 ± 0.25 | 8.33 ± 1.26 | 8.15 ± 0.72 | 7.63 ± 0.43 | 8.30 ± 0.98 | 7.46 ± 0.67 | 8.92 ± 0.50 |
| Hematocrit | 35.1–45.4 | (%) | 40.8 ± 4.33 | 38.9 ± 0.91 | 36.8 ± 2.48 | 34.2 ± 0.87 | 40.8 ± 0.93 | 36.0 ± 0.98 | 38.4 ± 2.66 | 41.0 ± 2.33 | 39.0 ± 0.71 | 38.6 ± 2.43 | 39.8 ± 0.69 | 43.8 ± 1.06 |
| Thrombocytes | ||||||||||||||
| Platelet | 592–2972 | (K/μL) | 632 ± 29.1 | 715 ± 134 | 623 ± 143 | 620 ± 18.4 | 620 ± 36.0 | 615 ± 34.3 | 587 ± 27.7 | 618 ± 76.7 | 620 ± 47.2 | 597 ± 39.7 | 594 ± 14.6 | 625 ± 55.5 |
FACS analysis was used to further evaluate transplant efficiency by determining the percentage of CFP+ blood cells Table 2. Our results show that at all analyzed time points, over 88% of blood-derived cells from collected blood samples were CFP+ in both chimera and CFP+ mice. In control wildtype mice, less than 3% of blood-derived cells were CFP+, indicating a low background auto-fluorescence at the CFP wavelength. In addition, no significant differences were observed in CFP+ blood cell populations between chimera and CFP+ donor mice (Table 2). FACS analysis of spleen, bone marrow and lymph nodes at sixteen weeks were consistent and not significantly different from analysis of blood samples (data not shown). Overall, average transplant efficiency at 16 weeks post implantation was 96.2%. Together, CBC and FACS analysis validate successful, stable bone marrow transplant of CFP+ blood-derived cells into irradiated wildtype mice.
Table 2.
Analysis of CFP+ cells in blood show that for all analyzed time points, over 85% of blood cells were CFP+ in chimera mice, while less than 5% were CFP+ in wildtype mice. No statistical significance was detected in CFP+ populations between CFP and chimera mice. n = 4–7 for each cohort.
| 2 weeks | 4 weeks | 8 weeks | 16 weeks | ||
|---|---|---|---|---|---|
| Percentage of blood cells expressing cyan fluorescent protein (CFP) | Wildtype | 2.15 ± 0.63 | 1.51 ± 0.61 | 2.03 ± 0.56 | 1.73 ± 0.42 |
| Chimera | 88.4 ± 1.99 | 92.4 ± 5.66 | 94.9 ± 6.23 | 93.5 ± 3.66 | |
| CFP | 89.3 ± 7.40 | 93.3 ± 4.39 | 95.3 ± 6.56 | 97.2 ± 11.1 |
3.2. Assessment of endogenous cell expression
Bone marrow transplant of CFP+ cells into irradiated wildtype mice produced chimera mice, where CFP+ cells were present in only blood-derived cell populations (See Section 3.1). First, to confirm that irradiation and bone marrow transplant did not affect the endogenous expression of resident cells, we analyzed tissue sections from non-surgical wildtype and chimera animals (that did not receive a microelectrode implant). Fig. 2 shows no apparent differences in endogenous cellular expression of neurons (Fig. 2A/ B), microglia (Fig. 2C/D) or astrocytes (Fig. 2E/F) between wildtype and chimera mice. Further, we evaluated the level of microglia activation and IgG+ immunoreactivity in wildtype and chimera mice and found that both cohorts demonstrated minimal CD68+ immunoreactivity (Fig. 2G/H) and IgG+ immunoreactivity (Fig. 2I/ J), suggesting that there was minimal microglia activation and blood–brain barrier disruption in non-surgical animals. Finally, to confirm that no CFP+ cells were present in the cortical tissue prior to implantation, we analyzed tissue sections from chimera mice that did not receive a microelectrode implant. Chimera mice that did not receive a microelectrode implant, did not demonstrate any CFP+ cells within cortical tissue (Fig. 2K/L), confirming that CFP+ cells were not present in the brain prior to microelectrode implantation.
Fig. 2.
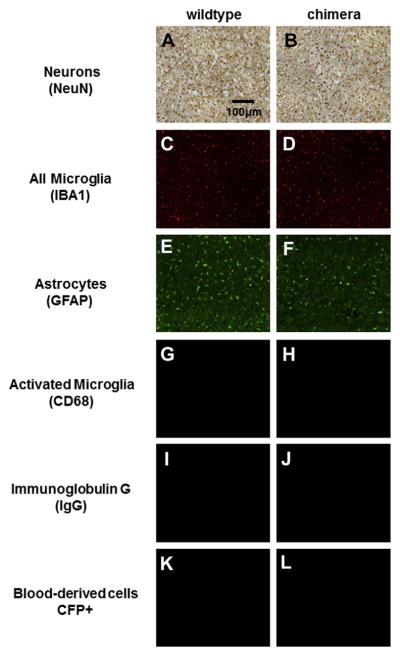
Endogenous cellular expression of inflammatory cell populations between wildtype and chimera non-surgical controls. No apparent difference was observed in endogenous expression of neurons (A/B), microglia (C/D), and astrocytes (E/F). In addition, minimal levels of microglia activation (G/H), IgG extravasation (I/J) and CFP+ expression (K/L) were seen in wildtype and chimera mice. No apparent differences were seen between wildtype and chimera mice.
3.3. Assessment of neuroinflammation
Next, we tracked the neuroinflammatory response following microelectrode implantation to confirm that irradiation and bone marrow transplantation did not have an effect on neuro-inflammation following microelectrode implantation. To date, most approaches evaluating the neuroinflammatory response have focused on analyzing neuronal densities, total population of microglia/macrophage (IBA1+ immunoreactivity), activated population of microglia/macrophage (CD68+ immunoreactivity), astrocyte population (GFAP+ immunoreactivity), and blood–brain barrier integrity (IgG+ immunoreactivity) [29,30,33–37]. To this end, we assessed neuroinflammation for wildtype and chimera mice following microelectrode implantation using traditionally utilized cellular markers commonly used in the field.
3.3.1. Neuronal densities
The proximity of neuronal cell bodies to intracortical micro-electrodes is critical in order to record high-quality neural activity over time. It has been suggested that neuronal cell bodies must be within 140 μm from the microelectrode-tissue interface in order to obtain reliable recordings [38]. Therefore, we first assessed neuronal densities surrounding intracortical microelectrodes following implantation into wildtype and chimera mice.
Using a mouse anti-NeuN (clone 60) monoclonal antibody to stain neuronal cell bodies in cortical tissue. Fig. 3A–D shows quantitative assessment of neuronal densities surrounding implanted intracortical microelectrodes at two, four, eight and sixteen weeks post implantation for wildtype and chimera mice. Our results demonstrate no significant difference in neuronal densities between wildtype and chimera mice at any of the binned intervals, for any of the time points assessed post implantation. These results suggest that irradiation and bone marrow transplant did not affect the localization of neuronal populations around microelectrode implantation.
Fig. 3.

Neuronal densities surrounding intracortical microelectrodes in wildtype and chimera mice at two, four, eight and sixteen weeks. Comparable levels of neuronal densities were calculated between chimera and wildtype mice across all time points, regardless of the distance from the implant. *Indicates significance between wildtype and chimera mice; #indicates significance between each cohort and background neuronal densities. scale bar = 100 μm; significance p < 0.05; n = 4–7 per cohort.
In addition, we also compared neuronal densities around the microelectrode of wildtype and chimera mice to background neuronal densities from non-surgical age matched controls within each cohort. At two weeks, neuronal densities remained significantly lower than background densities across all binned intervals assessed for both wildtype and chimera mice Fig. 3A. At four and sixteen weeks, neuronal densities remained lower than background densities within the first 200 μm from the implant for both wildtype and chimera mice Fig. 3B/D. In contrast, at eight weeks, neuronal densities return to background densities for both wild-type and chimera mice beyond 50 μm from the interface Fig. 3C.
3.3.2. Microglia/macrophages
Microglia are responsible for maintaining homeostasis in cortical tissue and have been shown to respond to foreign invaders, cellular injury as well as infiltrating serum proteins following vascular injury [39–41]. When activated, microglia/macrophages release several neurotoxic pro-inflammatory molecules that have been shown to propagate neuroinflammatory events following microelectrode implantation [42–45]. To this end, several studies have focused on evaluating both total microglia/macrophages populations as well as activated microglia/macrophage populations at the microelectrode-tissue interface [18,21,46,47].
Here, we used IBA1+, which is a marker for ionized calcium binding adapter molecule, to label the total population of microglia/ macrophages (both resting and activated) [48]. Fig. 4A–D shows quantitative assessment of IBA1+ immunoreactivity in wildtype and chimera. Here, we observed no significant difference in the total population of microglia/macrophages (IBA1+ immunoreactivity) between wildtype and chimera mice, at any of the time points we assessed, regardless of the distance from the implant (Fig. 4A–D).
Fig. 4.

IBA1+ immunoreactivity surrounding intracortical microelectrodes in wildtype and chimera mice at two, four, eight and sixteen weeks. Comparable levels of IBA1+ immunoreactivity was found between chimera and wildtype mice across all time points, regardless of the distance from the implant. scale bar = 100 μm; significance p < 0.05; n = 4–7 per cohort.
Activated microglia/macrophage population was evaluated using a CD68+ antibody. Specifically, we used Rat anti-CD68 (FA-11) clone monoclonal antibody that is specific to marosialinin, a sialogylcoprotein confined to activated, murine mononuclear phagocytes [49]. Evaluation of CD68+ immunoreactivity (Fig. 5A–D) showed no significant difference between wildtype and chimera mice at any of the assessed time points, across all distances from the implant. Our results show that radiation did not have a significant effect on the activated microglial/macrophage populations at the investigated time points post microelectrode implantation.
Fig. 5.

CD68+ immunoreactivity surrounding intracortical microelectrodes in wildtype and chimera mice at two, four, eight and sixteen. Comparable levels of CD68+ immunore-activity was found between chimera and wildtype mice across all time points, regardless of the distance from the implant. scale bar = 100 μm; significance p < 0.05; n = 4–7 per cohort.
3.3.3. Astrocytes
Astrocytes also play an important role in tissue repair following CNS injury [50]. Upon insertion of a microelectrode into the cortical tissue, astrocytes become activated and form a glial scar encapsulating the electrode [51–53]. Therefore, we used glial fibril acidic protein (GFAP) as a marker to label immature/mature resting and activated astrocytes [54]. Fig. 6A–D shows quantitative assessment of GFAP+ immunoreactivity at the microelectrode-tissue interface for wildtype and chimera mice. No significant difference in GFAP+ immunoreactivity were seen between wildtype and chimera mice at any of the time points we assessed, regardless of the distance from the implant. Again, irradiation and bone marrow transplantation did not have a significant effect on the investigated cell at the investigated time points post microelectrode implantation.
Fig. 6.

GFAP+ immunoreactivity surrounding intracortical microelectrodes in wild type and chimera mice at two, four, eight and sixteen. Comparable levels of GFAP+ immunoreactivity was found between chimera and wildtype mice across all time points, regardless of the distance from the implant. scale bar = 100 μm; significance p < 0.05; n = 4–7 per cohort.
3.3.4. Blood–brain barrier integrity
Extravasated serum proteins resulting from blood–brain barrier disruption has been shown to serve as persistent microglia and macrophage stimuli that can create a self-perpetuating cycle of neuroinflammatory events leading to neurodegeneration (neuronal dieback as well as impaired neuronal viability) [21]. Therefore, we also evaluated blood–brain barrier disruption using a marker for IgG. IgG is a blood protein normally not found in native brain tissue. Quantitative assessment of blood–brain barrier permeability though IgG+ reactivity (Fig. 7A–D) shows no significant difference in either intensity or distribution between wildtype and chimera mice at any of the time points assessed. Our results indicate that radiation and bone marrow transplant did not significantly affect BBB permeability at the investigated time points post microelectrode implantation.
Fig. 7.

IgG+ immunoreactivity surrounding intracortical microelectrodes in wildtype and chimera mice at two, four, eight and sixteen weeks. Comparable levels of IgG+ immunoreactivity was found between chimera and wildtype mice across all time points, regardless of the distance from the implant. scale bar = 100 μm; significance p < 0.05; n = 4–7 per cohort.
3.4. Characterization of blood-derived cells
3.4.1. Temporal infiltration of blood-derived cells
Next, we investigated the temporal infiltration of blood-derived cells (CFP+ cells) following microelectrode implantation. Fig. 8A–E shows quantitative assessment of infiltrating blood-derived cells following microelectrode implantation in chimera mice. Specifically, within the first 100 μm we found the highest populations of blood-derived cells at two weeks post implantation (Fig. 8A–E, Table 3). The CFP+ population at four weeks post implantation was significantly lower than the CFP+ population at two weeks (Fig. 8A–E, Table 3). In contrast, we found the lowest populations of blood-derived cells at eight weeks post implantation (Fig. 8A–E, Table 3). Interestingly, we found that the CFP+ population at sixteen weeks was significantly higher than the CFP+ population at eight weeks and comparable to the CFP+ population at four weeks.
Fig. 8.

Assessment of CFP+ immunoreactivity surrounding intracortical microelectrodes over time. Highest levels of CFP+ immunoreactivity were observed at two and sixteen weeks post implantation, with significantly lower CFP+ immunoreactivity observed at eight weeks post implantation (A–E). Co-localization of CFP+ and IBA1+ immunoreactivity within the total CFP+ population demonstrated that over 60% of the CFP+ population were comprised of blood-borne macrophages across all time points (F). Quantification of the remaining blood-derived CFP+ population over time (G). scale bar = 100 μm; significance p < 0.05; n = 4–7 per cohort.
Table 3.
Statistical comparisons for total CFP+ population, macrophage population within the CFP+ population and remaining blood-derived cell population within the CFP+ population over time from 0–100 μm; significance p < 0.05; n = 4–7 per cohort.
| 4 weeks | 8 weeks | 16 weeks | ||
|---|---|---|---|---|
| 2 weeks | CFP+ population | 0.009 | <0.001 | 0.020 |
| Macrophages in CFP+ population | 0.005 | <0.001 | 0.007 | |
| Remaining CFP+ population | 0.021 | <0.001 | 0.097 | |
| 4 weeks | CFP+ population | X | 0.041 | 0.9653 |
| Macrophages in CFP+ population | X | 0.038 | 0.9987 | |
| Remaining CFP+ population | X | 0.043 | 0.8028 | |
| 8 weeks | CFP+ population | X | X | 0.032 |
| Macrophages in CFP+ population | X | X | 0.049 | |
| Remaining CFP+ population | X | X | 0.009 |
“Bold and italics” represent conditions in which the p value was <0.05, indicating statistical significance.
3.4.2. Quantification of macrophages from infiltrating CFP+ population
To decouple the cell populations within the total CFP+ population, we first sought to characterize the percentage of infiltrating cells that were comprised of blood-borne macrophages. Fig. 8F/G shows a quantitative assessment of both the relative macrophage population and the remaining blood-derived cell populations within the total CFP+ population. Surprisingly, we observed that regardless of the specific time point, over 60% of the CFP+ population are comprised of macrophages (Equation (1); Fig. 8F/G).
3.5. Quantification of microglia versus macrophages
3.5.1. Resting versus activated macrophages from IBA1+ population
Due to the fact that we observed a predominant role of infiltrating macrophages from the total CFP+ cells, we next investigated the relative contribution of microglia versus macrophages within the total IBA1+ population. Here, we saw the highest levels of IBA1+ immunoreactivity within the first 100 μm at two and sixteen weeks post implantation, with significantly lower levels at eight weeks post implantation (Fig. 9A–E). We also observed significantly more macrophages present at two and sixteen weeks post micro-electrode implantation within the first 100 μm compared to eight weeks post microelectrode implantation. (Fig. 9F, Table 4). Within the total IBA1+ population, we saw that only 20% of the total IBA1+ population (Equation (2)) was comprised of microglia at two weeks post implantation (Fig. 9G). Additionally, at chronic time points (four, eight and sixteen weeks), we observed that less than 40% of the total IBA1+ population (Equation (2)) was comprised of microglia (Fig. 9G). On the other hand, no significant differences were observed in microglia populations over time (Fig. 9G, Table 4). Together, our results suggest a predominant role of infiltrating macrophages surrounding implanted microelectrodes over time.
Fig. 9.

Assessment of total IBA1+ immunoreactivity surrounding intracortical microelectrodes over time. Highest levels of IBA1+ immunoreactivity was observed at two and sixteen weeks post implantation, with significantly lower IBA1+ immunoreactivity observed at eight weeks post implantation (A–E). Co-localization of CFP+ and IBA1+ immunoreactivity within the total IBA1+ population demonstrated that less than 20% of the IBA1+ population were comprised of resident microglia at two weeks, while 40% of IBA1+ population was comprised of resident microglia by sixteen weeks (F/G). scale bar = 100 μm; significance p < 0.05; n = 4–7 per cohort.
Table 4.
Statistical comparisons for total IBA1+ population, macrophage population within the IBA1+ population and microglia population within the IBA1+ population over time from 0–100 μm; significance p < 0.05; n = 4–7 per cohort.
| 4 weeks | 8 weeks | 16 weeks | ||
|---|---|---|---|---|
| 2 weeks | IBA1+ population | 0.042 | 0.003 | 0.047 |
| Macrophages in IBA1+ population | 0.049 | 0.002 | 0.048 | |
| Microglia in IBA1+ population | 0.138 | 0.082 | 0.203 | |
| 4 weeks | IBA1+ population | X | 0.027 | 0.997 |
| Macrophages in IBA1+ population | X | 0.049 | 0.988 | |
| Microglia in IBA1+ population | X | 0.676 | 0.994 | |
| 8 weeks | IBA1+ population | X | X | 0.034 |
| Macrophages in IBA1+ population | X | X | 0.029 | |
| Microglia in IBA1+ population | X | X | 0.531 |
“Bold and italics” represent conditions in which the p value was <0.05, indicating statistical significance.
3.5.2. Activated macrophages from CD68+ population
In addition, we also quantified the percentage of activated microglia and activated macrophages within the total CD68+ population following microelectrode implantation (Fig. 10A–E). We observed the highest levels of CD68+ immunoreactivity at two weeks post implantation, with significantly lower CD68+ immunoreactivity at chronic time points (four, eight, and sixteen weeks) (Fig. 10A–E). In evaluating the co-localized CFP+ and CD68+ population within the total CD68+ population, we observed that at all time points, ~70% of the CD68+ population (Equation (3)) were comprised of macrophages (Fig. 10F), while ~30% of the total CD68+ population (Equation (3)) were comprised of microglia cells (Fig. 10G). Interestingly, we observed significantly more activated macrophages and activated microglia within the first 100 μm at two weeks post implantation compared to any other time point (Fig. 10F/G, Table 5). No significant differences were observed in either activated microglia or activated macrophages populations across time points beyond four weeks (Fig. 10F/G, Table 5).
Fig. 10.

Assessment of total CD68+ immunoreactivity surrounding intracortical microelectrodes over time. Highest levels of CD68+ immunoreactivity were observed at two weeks post implantation, with significantly lower CD68+ immunoreactivity observed beyond two weeks (A–E). Co-localization of CFP+ and CD68+ immunoreactivity within the total CD68+ population demonstrated that approximately 70% of CD68+ cells at two weeks were comprised of blood borne macrophages (F/G). scale bar = 100 μm; significance p < 0.05; n = 4–7 per cohort.
Table 5.
Statistical comparisons for total CD68+ population, macrophage population within the CD68+ population and microglia population within the CD68+ population over time from 0–100 μm; significance p < 0.05; n = 4–7 per cohort.
| 4 weeks | 8 weeks | 16 weeks | ||
|---|---|---|---|---|
| 2 weeks | CD68+ population | <0.001 | <0.001 | <0.001 |
| Macrophages in CD68+ population | <0.001 | <0.001 | <0.001 | |
| Microglia in CD68+ population | <0.001 | <0.001 | <0.001 | |
| 4 weeks | CD68+ population | X | 0.8737 | 0.5198 |
| Macrophages in CD68+ population | X | 0.8389 | 0.6275 | |
| Microglia in CD68+ population | X | 0.9477 | 0.2773 | |
| 8 weeks | CD68+ population | X | X | 0.9128 |
| Macrophages in CD68+ population | X | X | 0.9793 | |
| Microglia in CD68+ population | X | X | 0.5432 |
“Bold and italics” represent conditions in which the p value was <0.05, indicating statistical significance.
4. Discussion
Several other groups have attempted to separate resident microglia and infiltrating macrophages using in utero transplantation models [55], busulfan chimeras [56], as well as depletion of macrophages using clodronate liposomes [57]. However, separating microglia and macrophages within cortical tissue remains challenging since alterations to animals may result in irreversible changes to CNS cell populations. For example, Bosco et al. showed that irradiation can reduce microglia activation in the retina [58]. On the other hand, while busulfan chimeras do not use radiation, busulfan is a chemotherapeutic drug, which may have harmful side effects. Further, Kierdorf et al. suggested that busulfan chimeras resulted in reduced infiltration of myeloid cells into the cortical tissue [56]. Further, clodronate liposomes have been shown to increase inflammation in animals resulting in complications [59]. Resident microglia cells are resistant to irradiation and further, the number of infiltrating blood-derived cells into the CNS following irradiation is minimal [60]. Therefore, we used a bone marrow chimera model with CFP+ bone marrow progenitor cells in order to study the temporal role of blood-derived cells in mediating neuroinflammatory events following microelectrode implantation. Here, using our described methods, we did not observe any changes in pre-implantation cell populations (Fig. 2, Table 1, Table 2) or the inflammatory response following microelectrode implantation between wildtype and chimera animals (Figs. 3–7) suggesting that irradiation and bone marrow transplant did not significantly alter CNS cell populations within our model.
Since the proximity of neuronal cell bodies to the electrode contact is most critical to maintain high-quality signals over time [38], we first evaluated neuronal densities surrounding intra-cortical microelectrodes over time. Neuronal densities fluctuated in a multi-phasic response following implantation of intracortical microelectrodes. The lowest percentages of neuronal densities closest to the implant site were observed at two and sixteen weeks post implantation (Fig. 3A/D), consistent with several other reports in the field [18,29,30,34,36].
No correlation was seen between total (IBA1+) or activated (CD68+) microglia/macrophages populations and neuronal dieback beyond four weeks post microelectrode implantation (Fig. 11A). However, we observed chronic blood–brain barrier (BBB) disruption throughout the time course following microelectrode implantation. Specifically, we observed elevated levels of IgG + immunoreactivity that remained comparable across all evaluated time points (Fig. 7A–D, Fig. 11A). Although we did not see a correlation between IgG+ immunoreactivity and neurodegeneration (Fig. 11A), disruption of the BBB alone has been shown to facilitate neurodegeneration and adversely affect recording performance [18,21,45]. It is likely that beyond accumulation of serum proteins at the microelectrode-tissue interface, cell trafficking between blood-derived cells and native brain tissue results in a persistent inflammatory stimulus and continued BBB disruption [61].
Fig. 11.

Summary of immunohistochemical assessment following microelectrode implantation. (A) Time course of neuroinflammatory markers and neurodegeneration following microelectrode implantation demonstrates no correlation between IBA1+, CD68+ or IgG + immunoreactivity and neuronal dieback. However, GFAP+ immunoreactivity was highest at two and sixteen weeks, the same time points we observed neurodegeneration. (B) We observed a temporal correlation between increased CFP+ immunoreactivity and neurodegeneration following microelectrode implantation. (C) In evaluating co-localization of activated macrophages and activated microglia within the CD68+ population, we did not observe a correlation between either cell type (activated microglia or activated macrophages) and neurodegeneration. (D) In evaluating the co-localized population of macrophage versus microglia within the total IBA1+ population, we observed a correlation between macrophages, but not microglia and neuronal dieback.
Astrocytes have been shown to play an active role in the integrity of the BBB and the facilitation of cell trafficking across the BBB [62]. When comparing GFAP+ immunoreactivity and neuronal densities, a correlation was observed between a more widespread astroglial scar and neuronal dieback over time (Fig. 11A). Specifically, significantly more GFAP+ immunoreactivity was observed within the first 100 μm at two and sixteen weeks (Fig. 6A/D) compared to four and eight weeks (Fig. 6B/C) post microelectrode implantation. Interestingly, fluctuations in GFAP+ immunoreactivity correlated well with neuronal density and CFP+ immunoreactivty, suggesting a possible role of astrocytes in facilitating trafficking of blood-derived cells.
Therefore, we next investigated the temporal contribution of blood-derived cells in mediating neurodegeneration by quantifying CFP+ immunoreactivity over time. We observed a direct correlation between populations of infiltrating blood-derived cells (CFP+ cells) and neuronal dieback over time (Fig. 11B). Specifically, the highest populations of blood-derived cells were observed at two and sixteen weeks post implantation (Figs. 11B and 4). At the same time points, the lowest percentages of neuronal densities were observed (Figs. 11B and 3). Collectively, the data suggests that infiltration of systemic macrophages may mediate the loss of surrounding neurons. This bimodal influx occurs independently of passive BBB integrity, suggesting the role of macrophage-specific signaling/ trafficking mechanisms that are decoupled from microglia activating signals.
Microglia cells arrive into the CNS from the primitive myeloid progenitors, which originate from the yolk sac in early embryonic development [63]. In normal cortical tissue, microglia cells are responsible for continually surveying the brain environment and maintaining homeostasis. Maintenance and proliferation of microglia cells within the brain has been shown to be entirely self-renewing with minimal recruitment from blood-derived cells [60]. However, following CNS injury, two distinct immune populations of phagocytic immune cells including resident microglia and infiltrating macrophages are found surrounding the injury site [18]. Interestingly, several groups have suggested a neuroprotective role of microglia cells, in which microglia cells switch to an activated phenotype in an attempt to protect the brain from further injury [64,65]. On the other hand, infiltrating macrophages enter the injury site in response to signals from injured tissue [27,57,66]. Therefore, it is important to better understand the potential contrasting roles of microglia and macrophages in response to implanted intracortical microelectrodes.
Unfortunately, the distinction between resident microglia and infiltrating macrophages has not been demonstrated due to a lack of discriminating cellular markers. Both microglia and macrophages express many of the same markers including CD68 and IBA-1. Here, investigating co-localization of IBA1+ and CFP+ immunoreactivity in chimera mice, allowed us to differentiate between infiltrating macrophages and resident microglia within the total IBA1+ population. Herein, we show that over 60% of the infiltration blood-derived cells were comprised of macrophages, regardless of the time point following microelectrode implantation (Fig. 8A/F, Fig. 9A/F).
To better understand the distinction between activated microglia and infiltrating macrophages, we investigated the co-localization of CD68+ and CFP+ immunoreactivity in chimera mice. Contrary to what has been suggested by many intracortical microelectrode studies [34,36,45,67,68], a consistent connection was not found between activated microglia/macrophages and neuron density in our chimera models (Fig. 11C). Specifically, at two weeks, significantly higher populations of activated macrophages as well as activated microglia at the interface within the CD68+ population was observed, correlating with decreased neuronal densities (Fig. 11C). However, by sixteen weeks, although decreased neuronal densities were observed, increased activated macrophage populations or activated microglia populations within the total CD68 population was not observed (Fig. 11C). These data suggest that cellular activation alone does not directly correlate with neuronal dieback.
Our data also demonstrated a correlation between the percentage of the total macrophage population and neuronal dieback following microelectrode implantation (Fig. 11D). However, there was no correlation observed between the total microglia population and neuronal dieback following microelectrode implantation (Fig. 11D), supporting the idea that microglia cells do not play a neurodegenerative role following cellular injury. Interestingly, unlike resident microglia, infiltrating macrophages have been suggested to exert both neuroprotective as well as neurotoxic functions on neurons depending on the specific inflammatory cytokines that are secreted. For example, CCR2 and CX3CR1 have been shown to play a role in secondary injury following spinal cord trauma [69]. In fact, Silver’s group has previously demonstrated that macrophages, not microglia are responsible for neuronal damage after spinal cord trauma in a similar chimeric model described here [27,57]. Further, CCL7, IL-1 and TNF-β have been shown to induce infiltrating macrophages to leave injured site [70]. Therefore, it may be possible that the mere presence of blood-borne macrophages (Fig. 11D) within the cortical tissue can result in downstream signaling effects including recruitment of inflammatory cells as well as the secretion of pro-inflammatory molecules, which can be neurotoxic to the surrounding tissue.
Collectively, our data suggests an important role for blood-borne macrophages in mediating neurodegeneration following micro-electrode implantation. Our results also show that traditionally used markers for IBA1+ immunoreactivity or CD68+ immunore-activity may not directly correlate to neuronal cell loss, but this does not necessarily indicate that macrophages or microglia are not mediating the effect. Future studies using a bone marrow chimera model with transgenic knock-out or knock-in mice may facilitate a better understanding of the role of specific inflammatory pathways derived from specific cell types and elucidate the temporal relationship between neuron death, macrophage infiltration and astrocytic scar. By understanding which cell type elicits specific factors that drive the response, therapeutics can be developed to modify it.
5. Conclusions
In this study, we have characterized the role of blood-derived cells in mediating neuroinflammatory events following micro-electrode implantation. Our results suggest an important role for systemic myeloid cells in mediating neuronal dieback. We demonstrated that over 60% of infiltrating the infiltrating blood-derived cell population was comprised of macrophages across all time points investigated. Importantly, we showed a correlation between the total infiltrating macrophage population (not the total microglia population) and neurodegeneration following micro-electrode implantation that was independent of BBB breakdown. Specifically, the total macrophage populations was greatest at two and sixteen weeks post implantation, the same time points we observed the lowest densities of neuronal survival closest to the implant. Our results suggest a dominant role for infiltrating macrophages, and not resident microglia, in mediating neuro-degeneration following microelectrode implantation. We suggest that future studies can utilize a chimera model to study the role of specific receptor-mediated pathways on specific cell types in mediating neuroinflammation and neurodegeneration. A better temporal understanding of key mechanistic pathways may aid in the development of more targeted therapeutics as well as help engineer the appropriate therapeutic approach to improve micro-electrode performance.
Acknowledgments
This work was supported in part by the Department of Biomedical Engineering and Case School of Engineering at Case Western Reserve University through laboratory start-up funds (JR. Capadona), the National Institute of Health, National Institute of Neurological Disorders and Stroke, (Grant # 1R01NS082404-01A1 JR. Capadona), the NIH Neuroengineering Training Grant 5T-32EB004314-14 (M. Ravikumar), the Presidential Early Career Award for Scientists and Engineers (PECASE, JR. Capadona) and the Department of Veterans Affairs Merit Review Award (B7122R, JRC). This research was also partly supported by the Radiation Resources Core Facility of the Comprehensive Cancer Center of Case Western Reserve University and University Hospitals of Cleveland (P30CA43703). The authors would like to thank John Mulvihill and Michael Sramkoski for help with irradiation and FACS experiments, respectively. None of the funding sources aided in collection, analysis and interpretation of the data, in writing of the manuscript, or in the decision to submit the manuscript for publication.
Footnotes
The authors have no conflict of interest related to this work to disclose.
References
- 1.Schwartz AB. Cortical neural prosthetics. Annu Rev Neurosci. 2004;27:487–507. doi: 10.1146/annurev.neuro.27.070203.144233. [DOI] [PubMed] [Google Scholar]
- 2.Cogan SF. Neural stimulation and recording electrodes. Annu Rev Biomed Eng. 2008;10:275–309. doi: 10.1146/annurev.bioeng.10.061807.160518. [DOI] [PubMed] [Google Scholar]
- 3.Oakes TR, Pizzagalli DA, Hendrick AM, Horras KA, Larson CL, Abercrombie HC, et al. Functional coupling of simultaneous electrical and metabolic activity in the human brain. Hum Brain Mapp. 2004;21:257–70. doi: 10.1002/hbm.20004. [DOI] [PMC free article] [PubMed] [Google Scholar]
- 4.Anderson ML. Neural reuse: a fundamental organizational principle of the brain. Behav Brain Sci. 2010;33:245–66. doi: 10.1017/S0140525X10000853. [DOI] [PubMed] [Google Scholar]
- 5.Carlson KS, Xia CZ, Wesson DW. Encoding and representation of intranasal CO2 in the mouse olfactory cortex. J Neurosci. 2013;33:13873–81. doi: 10.1523/JNEUROSCI.0422-13.2013. [DOI] [PMC free article] [PubMed] [Google Scholar]
- 6.Duffau H. Brain mapping in tumors: intraoperative or extraoperative? Epilepsia. 2013;54:79–83. doi: 10.1111/epi.12449. [DOI] [PubMed] [Google Scholar]
- 7.Simeral JD, Kim SP, Black MJ, Donoghue JP, Hochberg LR. Neural control of cursor trajectory and click by a human with tetraplegia 1000 days after implant of an intracortical microelectrode array. J Neural Eng. 2011;8:025027. doi: 10.1088/1741-2560/8/2/025027. [DOI] [PMC free article] [PubMed] [Google Scholar]
- 8.Donoghue JP, Nurmikko A, Black M, Hochberg LR. Assistive technology and robotic control using motor cortex ensemble-based neural interface systems in humans with tetraplegia. J Physiol. 2007;579:603–11. doi: 10.1113/jphysiol.2006.127209. [DOI] [PMC free article] [PubMed] [Google Scholar]
- 9.Hochberg LR, Bacher D, Jarosiewicz B, Masse NY, Simeral JD, Vogel J, et al. Reach and grasp by people with tetraplegia using a neurally controlled robotic arm. Nature. 2012;485:372–5. doi: 10.1038/nature11076. [DOI] [PMC free article] [PubMed] [Google Scholar]
- 10.Hochberg LR, Serruya MD, Friehs GM, Mukand JA, Saleh M, Caplan AH, et al. Neuronal ensemble control of prosthetic devices by a human with tetraplegia. Nature. 2006;442:164–71. doi: 10.1038/nature04970. [DOI] [PubMed] [Google Scholar]
- 11.Kim SP, Simeral JD, Hochberg LR, Donoghue JP, Black MJ. Neural control of computer cursor velocity by decoding motor cortical spiking activity in humans with tetraplegia. J Neural Eng. 2008;5:455–76. doi: 10.1088/1741-2560/5/4/010. [DOI] [PMC free article] [PubMed] [Google Scholar]
- 12.Liu X, McCreery DB, Bullara LA, Agnew WF. Evaluation of the stability of intracortical microelectrode arrays. IEEE Trans Neural Systems Rehab Eng: Pub IEEE Eng Med Biol Soc. 2006;14:91–100. doi: 10.1109/TNSRE.2006.870495. [DOI] [PubMed] [Google Scholar]
- 13.Ludwig KA, Uram JD, Yang J, Martin DC, Kipke DR. Chronic neural recordings using silicon microelectrode arrays electrochemically deposited with a poly(3,4-ethylenedioxythiophene) (PEDOT) film. J Neural Eng. 2006;3:59–70. doi: 10.1088/1741-2560/3/1/007. [DOI] [PubMed] [Google Scholar]
- 14.Burns BD, Stean JP, Webb AC. Recording for several days from single cortical neurons in completely unrestrained cats. Electroencephalogr Clin Neuro-physiol. 1974;36:314–8. doi: 10.1016/0013-4694(74)90175-8. [DOI] [PubMed] [Google Scholar]
- 15.Barrese JC, Rao N, Paroo K, Triebwasser C, Vargas-Irwin C, Franquemont L, et al. Failure mode analysis of silicon-based intracortical microelectrode arrays in non-human primates. J Neural Eng. 2013;10:066014. doi: 10.1088/1741-2560/10/6/066014. [DOI] [PMC free article] [PubMed] [Google Scholar]
- 16.Prasad A, Xue QS, Dieme R, Sankar V, Mayrand RC, Nishida T, et al. Abiotic-biotic characterization of Pt/Ir microelectrode arrays in chronic implants. Front Neuroeng. 2014;7:2. doi: 10.3389/fneng.2014.00002. [DOI] [PMC free article] [PubMed] [Google Scholar]
- 17.Prasad A, Xue Q-S, Sankar V, Nishida T, Shaw G, Streit WJ, et al. Comprehensive characterization and failure modes of tungsten microwire arrays in chronic neural implants. J Neural Eng. 2012;9:056015. doi: 10.1088/1741-2560/9/5/056015. [DOI] [PubMed] [Google Scholar]
- 18.Saxena T, Karumbaiah L, Gaupp EA, Patkar R, Patil K, Betancur M, et al. The impact of chronic blood–brain barrier breach on intracortical electrode function. Biomaterials. 2013;34:4703–13. doi: 10.1016/j.biomaterials.2013.03.007. [DOI] [PubMed] [Google Scholar]
- 19.Rennaker RL, Miller J, Tang H, Wilson DA. Minocycline increases quality and longevity of chronic neural recordings. J Neural Eng. 2007;4:L1–5. doi: 10.1088/1741-2560/4/2/L01. [DOI] [PMC free article] [PubMed] [Google Scholar]
- 20.Polikov V, Tresco P, Reichert W. Response of brain tissue to chronically implanted neural electrodes. J Neurosci Methods. 2005;148:1–18. doi: 10.1016/j.jneumeth.2005.08.015. [DOI] [PubMed] [Google Scholar]
- 21.Potter KA, Buck AC, Self WK, Callanan ME, Sunil S, Capadona JR. The effect of resveratrol on neurodegeneration and blood brain barrier stability surrounding intracortical microelectrodes. Biomaterials. 2013;34:7001–15. doi: 10.1016/j.biomaterials.2013.05.035. [DOI] [PubMed] [Google Scholar]
- 22.Giuliani F, Hader W, Yong VW. Minocycline attenuates T cell and microglia activity to impair cytokine production in T cell-microglia interaction. J Leukoc Biol. 2005;78:135–43. doi: 10.1189/jlb.0804477. [DOI] [PubMed] [Google Scholar]
- 23.Yong VW, Wells J, Giuliani F, Casha S, Power C, Metz LM. The promise of minocycline in neurology. Lancet Neurol. 2004;3:744–51. doi: 10.1016/S1474-4422(04)00937-8. [DOI] [PubMed] [Google Scholar]
- 24.Winslow BD, Christensen MB, Yang W-K, Solzbacher F, Tresco PA. A comparison of the tissue response to chronically implanted parylene-C-coated and uncoated planar silicon microelectrode arrays in rat cortex. Bio-materials. 2010;31:9163–72. doi: 10.1016/j.biomaterials.2010.05.050. [DOI] [PMC free article] [PubMed] [Google Scholar]
- 25.Capiralla H, Vingtdeux V, Zhao H, Sankowski R, Al-Abed Y, Davies P, et al. Resveratrol mitigates lipopolysaccharide- and Abeta-mediated microglial inflammation by inhibiting the TLR4/NF-kappaB/STAT signaling cascade. J Neurochem. 2012;120:461–72. doi: 10.1111/j.1471-4159.2011.07594.x. [DOI] [PMC free article] [PubMed] [Google Scholar]
- 26.Manna SK, Mukhopadhyay A, Aggarwal BB. Resveratrol suppresses TNF-induced activation of nuclear transcription factors NF-kappa B, activator protein-1, and apoptosis: potential role of reactive oxygen intermediates and lipid peroxidation. J Immunol. 2000;164:6509–19. doi: 10.4049/jimmunol.164.12.6509. [DOI] [PubMed] [Google Scholar]
- 27.Evans TA, Barkauskas DS, Myers JT, Hare EG, You JQ, Ransohoff RM, et al. High-resolution intravital imaging reveals that blood-derived macrophages but not resident microglia facilitate secondary axonal dieback in traumatic spinal cord injury. Exp Neurol. 2014;254C:109–20. doi: 10.1016/j.expneurol.2014.01.013. [DOI] [PMC free article] [PubMed] [Google Scholar]
- 28.Schmid I, Krall WJ, Uittenbogaart CH, Braun J, Giorgi JV. Dead cell discrimination with 7-amino-actinomycin D in combination with dual color immunofluorescence in single laser flow cytometry. Cytometry. 1992;13:204–8. doi: 10.1002/cyto.990130216. [DOI] [PubMed] [Google Scholar]
- 29.Ravikumar M, Hageman DJ, Tomaszewski WH, Chandra GM, Skousen JL, Capadona JR. The effect of residual endotoxin contamination on the neuro-inflammatory response to sterilized intracortical microelectrodes. J Mater Chem B Mater Biol Med. 2014;2:2517–29. doi: 10.1039/C3TB21453B. [DOI] [PMC free article] [PubMed] [Google Scholar]
- 30.Potter-Baker KA, Ravikumar M, Burke AA, Meador WD, Householder KT, Buck AC, et al. A comparison of neuroinflammation to implanted microelectrodes in rat and mouse models. Biomaterials. 2014;34:5637–46. doi: 10.1016/j.biomaterials.2014.03.076. [DOI] [PMC free article] [PubMed] [Google Scholar]
- 31.Potter KA, Simon JS, Velagapudi B, Capadona JR. Reduction of autofluorescence at the microelectrode-cortical tissue interface improves antibody detection. J Neurosci Methods. 2012;203:96–105. doi: 10.1016/j.jneumeth.2011.09.024. [DOI] [PubMed] [Google Scholar]
- 32.Nemzek JA, Bolgos GL, Williams BA, Remick DG. Differences in normal values for murine white blood cell counts and other hematological parameters based on sampling site. Inflamm Res. 2001;50:523–7. doi: 10.1007/PL00000229. [DOI] [PubMed] [Google Scholar]
- 33.Winslow BD, Tresco PA. Quantitative analysis of the tissue response to chronically implanted microwire electrodes in rat cortex. Biomaterials. 2010;31:1558–67. doi: 10.1016/j.biomaterials.2009.11.049. [DOI] [PubMed] [Google Scholar]
- 34.Potter KA, Buck AC, Self WK, Capadona JR. Stab injury and device implantation within the brain results in inversely multiphasic neuroinflammatory and neurodegenerative responses. J Neural Eng. 2012;9:046020. doi: 10.1088/1741-2560/9/4/046020. [DOI] [PubMed] [Google Scholar]
- 35.Biran R, Martin D, Tresco P. Neuronal cell loss accompanies the brain tissue response to chronically implanted silicon microelectrode arrays. Exp Neurol. 2005;195:115–26. doi: 10.1016/j.expneurol.2005.04.020. [DOI] [PubMed] [Google Scholar]
- 36.McConnell GC, Rees HD, Levey AI, Gutekunst C-A, Gross RE, Bellamkonda RV. Implanted neural electrodes cause chronic, local inflammation that is correlated with local neurodegeneration. J Neural Eng. 2009;6:056003. doi: 10.1088/1741-2560/6/5/056003. [DOI] [PubMed] [Google Scholar]
- 37.Potter KA, Jorfi M, Householder KT, Foster EJ, Weder C, Capadona JR. Curcumin-releasing mechanically-adaptive intracortical implants improve the proximal neuronal density and blood–brain barrier stability. Acta Biomater. 2014;10:2209–22. doi: 10.1016/j.actbio.2014.01.018. [DOI] [PubMed] [Google Scholar]
- 38.Buzsáki G. Large-scale recording of neuronal ensembles. Nat Neurosci. 2004;7:446–51. doi: 10.1038/nn1233. [DOI] [PubMed] [Google Scholar]
- 39.Zhang H, Wang F-W, Yao I-L, Hao A-J. Microglia - friend or foe. Front Biosci (Schol Ed) 2011;S3:869–83. doi: 10.2741/193. [DOI] [PubMed] [Google Scholar]
- 40.Tremblay ME, Stevens B, Sierra A, Wake H, Bessis A, Nimmerjahn A. The role of microglia in the healthy brain. J Neurosci. 2011;31:16064–9. doi: 10.1523/JNEUROSCI.4158-11.2011. [DOI] [PMC free article] [PubMed] [Google Scholar]
- 41.Kettenmann H, Hanisch U-K, Noda M, Verkhratsky A. Physiology of microglia. Physiol Rev. 2011;91:461–553. doi: 10.1152/physrev.00011.2010. [DOI] [PubMed] [Google Scholar]
- 42.Hanisch U-K. Microglia as a source and target of cytokines. Glia. 2002;40:140–55. doi: 10.1002/glia.10161. [DOI] [PubMed] [Google Scholar]
- 43.Graeber MB, Li W, Rodriguez ML. Role of microglia in CNS inflammation. FEBS Lett. 2011;585:3798–805. doi: 10.1016/j.febslet.2011.08.033. [DOI] [PubMed] [Google Scholar]
- 44.Dheen ST, Kaur C, Ling EA. Microglial activation and its implications in the brain diseases. Curr Med Chem. 2007;14:1189–97. doi: 10.2174/092986707780597961. [DOI] [PubMed] [Google Scholar]
- 45.Skousen J, Bolick K, Bridge M, Tresco P. IFESS. 2012. A predictive model of the foreign body response to devices implanted chronically in the central nervous system. [Google Scholar]
- 46.McConnell GC. Chronic inflammation surrounding intra-cortical electrodes is correlated with a local neurodegenerative state. Georgia Institute of Technology; 2008. [Google Scholar]
- 47.Zhong Y, Bellamkonda R. Dexamethasone-coated neural probes elicit attenuated inflammatory response and neuronal loss compared to uncoated neural probes. Brain Res. 2007;1148:15–27. doi: 10.1016/j.brainres.2007.02.024. [DOI] [PMC free article] [PubMed] [Google Scholar]
- 48.Ito D, Tanaka K, Suzuki S, Dembo T, Fukuuchi Y. Enhanced expression of Iba1, ionized calcium-binding adapter molecule 1, after transient focal cerebral ischemia in rat bin. Stroke. 2001;32:1208–15. doi: 10.1161/01.str.32.5.1208. [DOI] [PubMed] [Google Scholar]
- 49.Rabinowitz SS, Gordon S. Macrosialin, a macrophage-restricted membrane sialoprotein differentially glycosylated in response to inflammatory stimuli. J Exp Med. 1991;174:827–36. doi: 10.1084/jem.174.4.827. [DOI] [PMC free article] [PubMed] [Google Scholar]
- 50.Simard M, Nedergaard M. The neurobiology of glia in the context of water and ion homeostasis. Neuroscience. 2004;129:877–96. doi: 10.1016/j.neuroscience.2004.09.053. [DOI] [PubMed] [Google Scholar]
- 51.Schmid-Brunclik N, Burgi-Taboada C, Antoniou X, Gassmann M, Ogunshola OO. Astrocyte responses to injury: VEGF simultaneously modulates cell death and proliferation. Am J Physiol Regul, Integr Comp Physiol. 2008;295:R864–73. doi: 10.1152/ajpregu.00536.2007. [DOI] [PubMed] [Google Scholar]
- 52.Schachtrup C, Ryu JK, Helmrick MJ, Vagena E, Galanakis DK, Degen JL, et al. Fibrinogen triggers astrocyte scar formation by promoting the availability of active TGF- after vascular damage. J Neurosci. 2010;30:5843–54. doi: 10.1523/JNEUROSCI.0137-10.2010. [DOI] [PMC free article] [PubMed] [Google Scholar]
- 53.Norenberg MD. Astrocyte responses to CNS injury. J Neuropathol Exp Neurol. 1994;53:213–20. doi: 10.1097/00005072-199405000-00001. [DOI] [PubMed] [Google Scholar]
- 54.Roitback T, Sykova E. Diffusion barriers evoked in the rat cortex by reactive astrogliosis. Glia. 1999;28:40–8. doi: 10.1002/(sici)1098-1136(199910)28:1<40::aid-glia5>3.0.co;2-6. [DOI] [PubMed] [Google Scholar]
- 55.Nijagal A, Le T, Wegorzewska M, Mackenzie TC. A mouse model of in utero transplantation. J Vis Exp. 2011;47:2303. doi: 10.3791/2303. [DOI] [PMC free article] [PubMed] [Google Scholar]
- 56.Kierdorf K, Katzmarski N, Haas CA, Prinz M. Bone marrow cell recruitment to the brain in the absence of irradiation or parabiosis bias. PLoS One. 2013;8:e58544. doi: 10.1371/journal.pone.0058544. [DOI] [PMC free article] [PubMed] [Google Scholar]
- 57.Horn KP, Busch SA, Hawthorne AL, van Rooijen N, Silver J. Another barrier to regeneration in the CNS: activated macrophages induce extensive retraction of dystrophic axons through direct physical interactions. J Neurosci. 2008;28:9330–41. doi: 10.1523/JNEUROSCI.2488-08.2008. [DOI] [PMC free article] [PubMed] [Google Scholar]
- 58.Bosco A, Crish SD, Steele MR, Romero CO, Inman DM, Horner PJ, et al. Early reduction of microglia activation by irradiation in a model of chronic glaucoma. PLoS One. 2012;7:e43602. doi: 10.1371/journal.pone.0043602. [DOI] [PMC free article] [PubMed] [Google Scholar]
- 59.Van Rooijen N, Sanders A. Liposome mediated depletion of macrophages: mechanism of action, preparation of liposomes and applications. J Immunol Methods. 1994;174:83–93. doi: 10.1016/0022-1759(94)90012-4. [DOI] [PubMed] [Google Scholar]
- 60.Ajami B, Bennett JL, Krieger C, Tetzlaff W, Rossi FM. Local self-renewal can sustain CNS microglia maintenance and function throughout adult life. Nat Neurosci. 2007;10:1538–43. doi: 10.1038/nn2014. [DOI] [PubMed] [Google Scholar]
- 61.Skousen J, Merriam S, Srivannavit O, Perlin G, Wise K, Tresco P. Reducing surface area while maintaining implant penetrating profile lowers the brain foreign body response to chronically implanted planar silicon microelectrode arrays. Prog Brain Res. 2011;194C:167–80. doi: 10.1016/B978-0-444-53815-4.00009-1. [DOI] [PubMed] [Google Scholar]
- 62.Abbott NJ, Ronnback L, Hansson E. Astrocyte-endothelial interactions at the blood–brain barrier. Nat Rev Neurosci. 2006;7:41–53. doi: 10.1038/nrn1824. [DOI] [PubMed] [Google Scholar]
- 63.Saijo K, Glass CK. Microglial cell origin and phenotypes in health and disease. Nat Rev Immunol. 2011;11:775–87. doi: 10.1038/nri3086. [DOI] [PubMed] [Google Scholar]
- 64.Sokolowski JD, Mandell JW. Phagocytic clearance in neurodegeneration. Am J Pathol. 2011;178:1416–28. doi: 10.1016/j.ajpath.2010.12.051. [DOI] [PMC free article] [PubMed] [Google Scholar]
- 65.Lee CY, Landreth GE. The role of microglia in amyloid clearance from the AD brain. J Neural Transm. 2010;117:949–60. doi: 10.1007/s00702-010-0433-4. [DOI] [PMC free article] [PubMed] [Google Scholar]
- 66.Busch SA, Horn KP, Silver DJ, Silver J. Overcoming macrophage-mediated axonal dieback following CNS injury. J Neurosci. 2009;29:9967–76. doi: 10.1523/JNEUROSCI.1151-09.2009. [DOI] [PMC free article] [PubMed] [Google Scholar]
- 67.Szarowski DH, Andersen MD, Retterer S, Spence AJ, Isaacson M, Craighead HG, et al. Brain responses to micro-machined silicon devices. Brain Res. 2003;983:23–35. doi: 10.1016/s0006-8993(03)03023-3. [DOI] [PubMed] [Google Scholar]
- 68.He W, Bellamkonda RV. A molecular perspective on understanding and modulating the performance of chronic central nervous system (CNS) recording electrodes. In: Reichert WM, editor. Indwelling neural implants: strategies for contending with the in vivo environment. Boca Raton (FL): CRC Press; 2008. [PubMed] [Google Scholar]
- 69.Geissmann F, Manz MG, Jung S, Sieweke MH, Merad M, Ley K. Development of monocytes, macrophages, and dendritic cells. Science. 2010;327:656–61. doi: 10.1126/science.1178331. [DOI] [PMC free article] [PubMed] [Google Scholar]
- 70.Takeshita Y, Ransohoff RM. Inflammatory cell trafficking across the blood–brain barrier: chemokine regulation and in vitro models. Immunol Rev. 2012;248:228–39. doi: 10.1111/j.1600-065X.2012.01127.x. [DOI] [PMC free article] [PubMed] [Google Scholar]