

Abstract
The anterior limb of the internal capsule (ALIC) is the major white matter tract providing reciprocal connections between the frontal cortex, striatum and thalamus. Mounting evidence suggests that this tract may be affected in schizophrenia, with brain imaging studies reporting reductions in white matter volume and density, changes in fractional anisotropy and reduced asymmetry. However, the molecular correlates of these deficits are currently unknown. The aim of this study was to identify alterations in protein and metabolite levels in the ALIC in schizophrenia. Samples were obtained post-mortem from individuals with schizophrenia (n=15) and non-psychiatric controls (n=13). Immunoreactivity for the myelin-associated protein myelin basic protein (MBP), and the axonal-associated proteins phosphorylated neurofilament and SNAP-25 was measured by enzyme-linked immunoadsorbant assay (ELISA). Metabolite concentrations were quantified by proton nuclear magnetic resonance (1H NMR) spectroscopy. Levels of myelin- or axonal-associated proteins did not differ between groups. Overall differences in metabolite concentrations were observed between the two groups (MANOVA F=2.685, p=0.036), with post-hoc tests revealing lower lactate (19%) and alanine (24%) levels in the schizophrenia group relative to controls. Observed changes in lactate and alanine levels indicate metabolic abnormalities within the ALIC in schizophrenia.
Keywords: myelin, axon, metabolite, internal capsule, lactate
1. Introduction
Alterations in fronto-striato-thalamic circuitry are hypothesised to be integral to the pathophysiology of schizophrenia (Andreasen et al 1994, Robbins et al 1990). Disruption of one or more cortical, striatal, thalamic or white matter components could result in dysfunction of these circuits. Each of these brain regions has been implicated in schizophrenia. For instance, structural imaging studies provide some evidence for thinning of the prefrontal cortex (Kuperberg et al 2003, Narr et al 2005) and similar volume deficits have been noted in the dorsomedial thalamus (Kemether et al 2003, Shimizu et al 2008). Striatal volumes are labile and are often affected by antipsychotic drug administration (Chakos et al 1994, Lang et al 2004). Post-mortem investigations have identified abnormalities at the cellular level in these brain regions, including deficits in neuronal and glial subtypes and decreased synaptic density (reviewed in Harrison 1999, Harrison and Weinberger 2005). Brain imaging studies have also offered evidence for abnormalities of the anterior limb of the internal capsule (ALIC), the white matter tract that connects the prefrontal cortex, striatum and thalamus, in schizophrenia. The volume of this tract is smaller (Lang et al 2006, Zhou et al 2003), its density reduced (Hulshoff Pol et al 2004, McIntosh et al 2005) and its length shorter (Buchsbaum et al 2006), while reported alterations in fractional anisotropy (Kubicki et al 2005, Mitelman et al 2007) suggest an abnormality in the organization of fibres.
The cellular and molecular correlates of white matter deficits reported in schizophrenia are not yet fully resolved. Abnormalities of oligodendrocytes and myelin could represent a potential source of disrupted neural connectivity. However, while there are reports of decreased oligodendrocyte numbers, as well as reduced expression of myelin-related genes and proteins in frontal regions, most previous studies have investigated cortical grey matter. Lower oligodendrocyte density has been reported in frontal white matter in a small sample of elderly subjects with schizophrenia (Hof et al 2003), but myelin protein expression has not yet been quantified in specific white matter tracts. Alterations in the ALIC could also reflect axonal pathology. Although axon density has not been assessed in this brain region decreased fibre density has been reported in the anterior commissure (Highley et al 1999a) and corpus callosum (Highley et al 1999b) in female patients. However, a further study failed to find any difference in the total length of myelinated fibres in frontal white matter (Marner and Pakkenberg 2003). Metabolic abnormalities have also been reported in white matter in schizophrenia. Reduced N-acetyl-aspartate (NAA) levels in patients, identified using proton magnetic resonance spectroscopy (Lim et al 1998), may indicate altered axonal integrity. Spectroscopy can also be performed on post-mortem samples, with greater resolution compared with living patients. This technique is novel, and we know of only one previous investigation of the metabolome in white matter in schizophrenia (Prabakaran et al 2004). This study reported decreased myoinositol, phosphocholine and acetate, along with increased glutamate and lactate concentrations in schizophrenia, possibly reflective of metabolic changes.
The anterior limb of the internal capsule is comprised of two major fibre systems; the anterior thalamic peduncle, which connects the anterior and dorsomedial thalamic nuclei and the prefrontal cortex, and the frontopontine tract, which connects the frontal cortex with the pons (Axer et al 1999, Axer and Keyserlingk 2000). Fronto-striato-thalamic circuitry is organized anatomically and functionally into a number of ‘loops’, which include dorsal and ventral components (Alexander et al 1986, Chudasama and Robbins 2006). The dorsal circuit comprises the dorsolateral prefrontal cortex, the dorsolateral caudate and the parvicellular division of the dorsomedial thalamic nucleus, projecting through the dorsal portion of the ALIC, while the ventral circuit comprises the orbitofrontal cortex, the ventromedial caudate and the magnocellular part of the dorsomedial nucleus, projecting via the ventral portion of the ALIC (Alexander et al 1986, Tekin and Cummings 2002).
The objectives of the present study were to investigate the ALIC as a marker of fronto-striatal-thalamic connectivity in schizophrenia. Fronto-striatal-thalamic pathways have received much attention, through studies of normal function in cognitive activity, and dysfunction in schizophrenia and in neurological disorders. Dysfunction related to the dorsal circuit results in impaired executive functions, such as working memory, while dysfunction of the ventral circuit impairs reversal learning and disrupts behavioural responses (Clark et al 2004, Robbins 2007, Tekin and Cummings 2002). In this study we assessed several measures of structural and functional integrity, including myelin-, axonal- and glial-associated proteins and cellular metabolites, in dorsal and ventral regions of the ALIC to identify alterations in schizophrenia.
2. Materials and Methods
2.1 Subjects
Frozen samples consisting of ventral and dorsal portions of the ALIC were obtained from the Macedonian/New York State Psychiatric Institute Brain Collection. Studies were approved by the Clinical Research Ethics Board of the University of British Columbia and by the Institutional Review Boards of the New York State Psychiatric Institute and the College of Physicians & Surgeons, Columbia University. The sample consisted of post-mortem brain tissue from 28 subjects: 15 individuals with schizophrenia, including two with schizoaffective disorder (DSM-IV criteria), and 13 non-psychiatric controls. All subjects died from acute causes, and no deaths were due to suicide. Detailed case summaries are provided in Table 1. Brain specimens were tested for the presence of psychoactive drugs using capillary gas chromatography, with confirmation by mass spectrometry. Tissue was obtained from the right hemisphere in each case.
Table 1.
Demographic and clinical variables in control (n=13) and schizophrenia (n=15) subjects.
| Control | Schizophrenia | |||
|---|---|---|---|---|
| Mean +/− SD (n) | Range | Mean +/− SD (n) | Range | |
| Age (years) | 51.4 +/− 18.8 (13) | 26–81 | 53.6 +/− 12.1 (15) | 33–77 |
| Sex (M/F) | 10/3 | 9/6 | ||
| Postmortem time (hours) | 16.6 +/− 7.1 (13) | 6–33 | 8.8 +/− 3.2 (15) | 6–15 |
| Duration of storage (weeks) | 196 +/− 77 | 68–256 | 316 +/− 74 (15) | 218–417 |
| pH | 6.16 +/− 0.33 | 5.44–6.77 | 6.35 +/− 0.27 | 5.9–6.9 |
| Cause of death | Motor vehicle accident (5) | Cardiac (7) | ||
| Cardiac (4) | Gastrointestinal (3) | |||
| Homicide (3) | Pulmonary (3) | |||
| Accidental (1) | Accidental (2) |
2.2 Tissue preparation
Coronal slabs of the right hemisphere were cut at autopsy and frozen at −80°C. Samples of the dorsal and ventral portions of the ALIC were sub-dissected at a standardized level without letting the tissue thaw. The samples were weighed and homogenized in 10 volumes of ice-cold buffered saline.
2.3. Enzyme-linked immunoadsorbent assay
Levels of protein markers associated with myelin (myelin basic protein [MBP]), axons (the cytoskeletal protein phosphorylated neurofilament [PNF], and the synaptic protein SNAP-25) and astrocytes (glial fibrillary acidic protein [GFAP]) were analyzed in both dorsal and ventral regions separately. Immunoreactivity for MBP (SMI-94, 1:500, Sternberger Monoclonals), PNF (SMI-34, 1:200, Sternberger Monoclonals), SNAP-25 (SP12, 1:10) and GFAP (SMI-22, 1:200, Sternberger Monoclonals) was determined by ELISA, as previously described (Beasley et al 2005, Flynn et al 2003, Honer et al 1999). Briefly, homogenates were diluted to a starting concentration of 15, 30, 60 and 30 μg protein/ml for MBP, PNF, SNAP-25 and GFAP respectively. Duplicate samples were serially diluted over a 128-fold range and dried onto 96 well ELISA plates. Non-specific binding was blocked, and the plates were incubated with primary antibody overnight at 4°C. Each plate also contained control wells in which tissue culture conditioned media was substituted for the primary antibody. The plates were further incubated with peroxidase-conjugated secondary antibody (1:1000, Jackson Labs) for 1 hour and then with 2,2′-azino-di-3-ethylbenzthiazoline (ABTS, KPL) substrate for 30 minutes. The optical density of each well was determined at 405 nm. Optical density was plotted against protein concentration (Softmax, Molecular Devices) and the linear portion of the curve determined for each sample. The mean linear range for the antibodies used was 64-fold. To compare immunoreactivity between samples the amount of protein required to give an optical density reading of 0.5 was determined. Samples were run twice on different days, with mean values used for analysis. Between-run correlations ranged between 0.91–0.98 and within-run coefficients of variation ranged between 5–7%.
2.4. Immunoblotting
Immunoblotting studies were performed to confirm the specificity of the antibodies used. Brain homogenates were separated on 10% SDS polyacrylamide gels. In addition, lysates from PC12 and HTB-17 cells (American Type Culture Collection), neuronal and astrocyte cell lines respectively, were included on the same gels to provide positive and/or negative controls. Following transfer to PVDF, blots were incubated with monoclonal antibodies against MBP (SMI-94, 1:2500), PNF (SMI-34, 1:2500), SNAP-25 (SP12, 1:10) or GFAP (SMI-22, 1:5000). Bands were detected using ECL (GE Healthcare) and imaged using a Fuji LAS-3000 imager (FujiFilm).
2.5. 1H NMR spectroscopy
Homogenates from the ventral region were centrifuged at 16,000xg for 5 minutes and the pellets discarded. The supernatant was diluted to 500μl with phosphate buffered saline and D2O (to 10%), sonicated, and a constant volume of 2 mM 3-trimethylsilyl propionic acid-D4, sodium salt (TSP) standard was added. Solution state NMR spectroscopy was performed using a 9.4T Bruker Avance 400inv spectrometer with 5mm BBI-Z inverse broadband probe with Z-gradient coil. Spectra were acquired at room temperature (spectral width 4990 = Hz, time domain = 32K points, dummy scans = 2, real scans = 1300) using a standard water pre-saturation pulse sequence, followed by a 15 microsecond 90-degree pulse on 1H. Our goal was to quantify specific metabolites based on previous studies (Omori et al 1997, Prabakaran et al 2004). We were able to identify 11 metabolites in each case based on comparisons with previously published spectra (Govindaraju et al 2000, Omori et al 1997) and confirmed using individual metabolite standards. Peak areas were analyzed using the software Dmfit (Massiot et al 2002). Concentrations of individual metabolites were determined by comparison against the TSP standard peak and calculated as mmol per kg wet weight of tissue used.
2.6. Statistical analyses
Normal distributions were confirmed by Shapiro-Wilks tests and logarithmic or square root transformations applied where necessary. Equal variances between groups were confirmed using Levene’s test. Correlations between protein or metabolite measures and age, post-mortem interval (PMI), pH and duration of storage were examined using Spearman’s Rank analysis. Where significant, confounders were included in the analysis as covariates. Effect size calculations were made using Cohen’s d statistic (Cohen 1998) and effect sizes were categorized as small (0.2–0.4), medium (0.5–0.7) or large (0.8 or greater). Statistical analyses were carried out using JMP 5.1.2 (SAS Institute Inc, Cary, NC).
For the protein data, univariate ANOVA was used to compare mean values between groups in the two regions separately. For the metabolites, we carried out two types of analysis. First, as all metabolites were measured in a single assay, we included all measures in a global multivariate ANOVA. This was followed up with individual post-hoc comparisons and calculation of the effect size differences between groups. Secondly, a chemometric analysis was applied to the metabolic measures, using PLS Toolbox for Matlab (Eigenvector Research Inc). We used partial least squares discriminant analysis (PLS-DA), a type of supervised regression analysis. The PLS-DA maximizes the explained variance in the X data set (the assays of 11 metabolites), as well as the covariance with the Y data set (group identity), creating a model of latent variables describing the maximum separation between the diagnostic groups. We next determined the importance of each of the measures in creating the model by calculating the variable importance in projection (VIP) scores. The model was then used to predict diagnosis of each case based on a 99% confidence limit for class membership. Cross-validation of the model was performed using the “Venetian blinds” method.
3. Results
3.1 Demographic data
Patient and control groups did not differ in mean age, pH or gender distribution. The mean PMI was shorter in schizophrenia samples (t=3.88, p<0.001), and the mean duration of storage was longer (t=4.21, p<0.001). In the ventral region PNF levels correlated with age (rho=0.467, p=0.012) and PMI (rho=0.438, p=0.020). No other protein measures showed significant correlations with age, PMI, pH or duration of storage. Lactate levels were inversely correlated with pH (rho=−0.576, p=0.001) as expected from previous studies (Halim et al 2008). Lactate is a major determinant of brain pH; therefore we did not use pH as a covariate in the metabolite analysis. No other metabolite measures showed significant correlations with age, PMI, pH or duration of storage. Drug histories were available for 13 of the 15 cases. All had been treated in the past with both low and high potency antipsychotics. All brain samples were tested for the presence of drugs and antipsychotic drugs were detected in only two samples.
3.2. Protein levels
No significant differences were observed between the schizophrenia and control groups in any myelin, astrocyte or axonal marker protein in either the dorsal or ventral ALIC (Table 2). Addition of age and PMI as covariates in the analyses of PNF in the ventral region did not affect the results.
Table 2.
Protein and metabolic measures in internal capsule in schizophrenia and control samples. The MBP assay did not provide reliable data in 3 control samples; these were eliminated from the analysis. Myelin, astrocyte and axonal markers represent immunoreactivity at a standardized total protein concentration. Metabolic marker concentration is expressed as mmol per kg wet weight of tissue used. Effect sizes have positive values if the marker was present at a lower level in schizophrenia samples than in control samples.
| Control | Schizophrenia | F value | P value | Effect size | |
|---|---|---|---|---|---|
| Mean +/− SD (n) | Mean +/− SD (n) | ||||
| Myelin markers | |||||
| MBP dorsal | 0.085+/−0.033 (10) | 0.105+/−0.030 (15) | 2.500 | 0.128 | −0.63 |
| MBP-ventral | 0.103+/−0.024 (10) | 0.103+/−0.026 (15) | 0.001 | 0.975 | 0.01 |
| Astrocyte marker | |||||
| GFAP-dorsal | 0.282+/−0.081 (13) | 0.294+/−0.036 (15) | 0.016 | 0.900 | −0.19 |
| GFAP ventral | 0.288+/−0.089 (13) | 0.307+/−0.057 (15) | 0.497 | 0.487 | −0.25 |
| Axonal markers | |||||
| SNAP-25-dorsal | 0.974+/−0.257 (13) | 0.923+/−0.307 (15) | 0.225 | 0.639 | 0.18 |
| SNAP-25-ventral | 1.188+/−0.303 (13) | 1.113+/−0.260 (15) | 0.509 | 0.482 | 0.27 |
| PNF-dorsal | 1.359+/−0.174 (13) | 1.357+/−0.380 (15) | 0.347 | 0.561 | 0.01 |
| PNF-ventral | 1.462+/−0.106 (13) | 1.438+/−0.118 (15) | 0.338 | 0.566 | 0.21 |
| Metabolic markers | |||||
| Myo-inositol (2CH, 4.05 ppm) | 10.11+/−2.26 (13) | 8.66+/−3.67 (15) | 1.534 | 0.227 | 0.48 |
| Glycerophosphorylcholine (choline moiety, N(CH3)3, 3.21 ppm) | 1.19+/−0.43 (13) | 1.18+/−0.47 (15) | 0.021 | 0.887 | 0.02 |
| Phosphorylcholine (N(CH3), 3.21 ppm) | 1.44+/−0.26 (13) | 1.39+/−0.50 (15) | 0.130 | 0.721 | 0.13 |
| Choline (N(CH3)3, 3.19 ppm) | 0.87+/−0.30 (13) | 0.67+/−0.36 (15) | 2.508 | 0.125 | 0.60 |
| Creatine/phosphocreatine (N(CH3), 3.03 ppm) | 8.04+/−1.80 (13) | 7.34+/−2.10 (15) | 0.882 | 0.356 | 0.36 |
| Succinate (2CH2, 2.40 ppm) | 0.90+/−0.34 (13) | 0.85+/−0.29 (15) | 0.080 | 0.779 | 0.16 |
| N-acetylaspartylglutamate (acetyl moiety, 2CH3, 2.04 ppm) | 3.98+/−1.33 (13) | 3.90+/−1.42 (15) | 0.045 | 0.834 | 0.06 |
| N-acetylaspartate (acetyl moiety, 2CH3, 2.01 ppm) | 3.94+/−1.08 (13) | 3.40+/−1.06 (15) | 1.808 | 0.190 | 0.50 |
| Acetate (2CH3, 1.90 ppm) | 4.32+/−1.27 (13) | 3.76+/−1.51 (15) | 1.128 | 0.298 | 0.40 |
| Alanine (3CH3, 1.47 ppm) | 3.50+/−1.09 (13) | 2.67+/−0.81 (15) | 4.995 | 0.034 | 0.86 |
| Lactate (3CH3, 1.31 ppm) | 22.14+/−1.45 (13) | 18.02+/−4.76 (15) | 4.325 | 0.048 | 1.17 |
3.3 Immunoblotting
For each antibody immunoreactive bands were observed at the expected molecular weights (Figure 1). In human brain homogenates an 18kDa band was immunoreactive for MBP, representing the major isoform present in the adult human brain. A lower molecular weight band was also present, which represents a minor isoform. As expected, no immunoreactivity for MBP was detected in PC12 or HTB-17 cells. SMI34 (anti-PNF) recognises the phosphorylated forms of neurofilament heavy, and to a lesser extent neurofilament medium. In the postmortem samples immunoreactive bands were present at 200kDa and 150 kDa respectively. Again, as expected, PC12 and HTB-17 cells were negative for PNF (Giasson and Mushynski 1996). A single band at 25kDa was immunoreactive for SNAP-25, being present in the brain homogenates and in the PC12 neuronal cell line, but not in the HTB-17 astrocyte cells. Multiple GFAP bands were observed in the brain homogenates and in the HTB-17 astrocyte cell line, but not in the neuronal cell line. A major band was present at approximately 50kDa, with a number of fainter bands appearing at lower molecular weights, which may represent alternative isoforms, post-translational modifications or proteolytic fragments, as previously reported (Nicholas et al 2004).
Figure 1.

Immunoblotting studies indicate bands at the expected molecular weights for PNF (SMI-34), GFAP (SMI-22), SNAP-25 (SP12) and MBP (SMI94) in representative samples of human brain homogenate, PC12 and HTB-17 cell lysates.
3.4. Metabolite levels
A representative 1H NMR trace from a control case is shown in Figure 2A. Summaries of metabolite concentrations are listed in Table 2. The multivariate ANOVA indicated a statistically significant difference between groups in the overall composition of metabolites (F=2.685, p=0.036). Post-hoc tests revealed significantly lower lactate and alanine concentrations in the schizophrenia group. Both of these metabolites showed large effect sizes. Levels of lactate and alanine were highly correlated in the schizophrenia samples (rho=0.707, p=0.003), but not in the control group (rho=0.022, p=0.943) (Figure 3).
Figure 2.
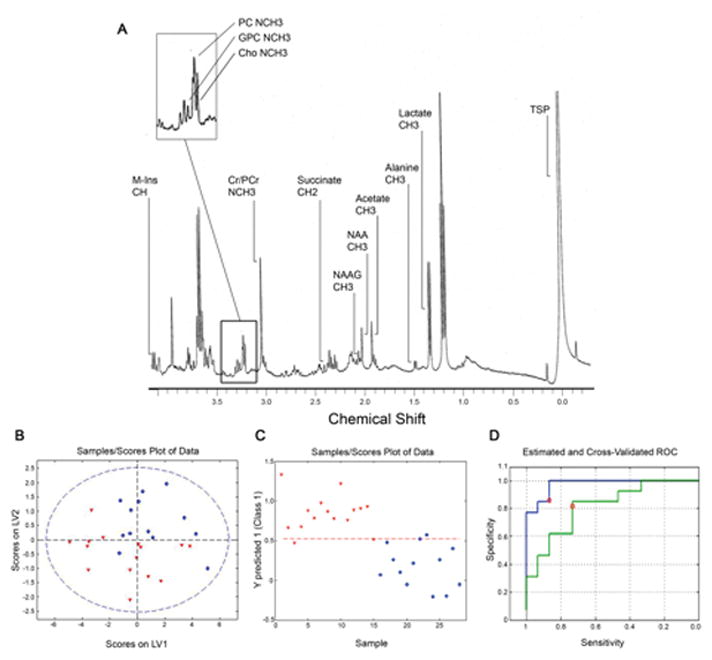
Metabolites in ventral internal capsule. (A) 1H NMR spectrum of ventral internal capsule. M-Ins: myo-inositol, GPC: glycerophosphorylcholine, PC: phosphorylcholine, Cho: choline, Cr/PCr: creatine/phosphocreatine, NAAG: N-acetylaspartylglutamate, NAA: N-acetylaspartate, TSP: 3-trimethylsilyl propionic acid. (B) PLS-DA model showing separation of samples using scores on latent variables LV1 and LV2. The dashed blue circle represents the 99% confidence interval.
(C) Scores for prediction of class (Y predicted score) for each sample. In plots B and C control samples are represented as blue circles and schizophrenia samples as red triangles. (D) Receiver operating characteristic (ROC) plots for the original (blue) and the cross-validated (green) PLS-DA models. The red circles represent the values for specificity and sensitivity based on optimum Bayesian-determined threshold derived by the software (red dashed line on plot C).
Figure 3.

Plots of the relationship between alanine and lactate in the ventral internal capsule in control (blue) and schizophrenia (red) samples. A statistically significant relationship was seen only in the schizophrenia samples. Concentrations are mmol per kg wet weight of tissue.
PLS-DA was used to determine if the metabolite data could be used to predict group membership. The scores plot of the first and second latent variables of the model, which accounted for 68.3% of the data variation, demonstrated that some separation could be achieved between the two groups (Figure 2B). The Y predicted score (class membership) for each sample in the initial model is shown in Figure 2C. The relative influence of each metabolite on the model was examined by comparison of the VIP values. NAAG, choline, phosphocholine, lactate and alanine were found to be important predictors, all of which had VIP values greater than 1.0. The variables with the largest contribution were lactate and alanine, which also had the largest effect sizes for differences between groups. The initial model had a sensitivity of 0.87 and a specificity of 0.92 and the cross-validated model had a sensitivity of 0.73 and a specificity of 0.81 (Figure 2D).
4. Discussion
The central finding of the present study is that metabolite levels in fronto-striatal-thalamic white matter pathways differ in schizophrenia compared with control subjects. This was due to lower levels of lactate and alanine in the schizophrenia group. Our finding of lower lactate is consistent with an investigation of metabolite levels in cerebrospinal fluid of first-episode patients, which found low lactate and elevated glucose (Holmes et al 2006). In these patients the metabolic disturbances were ameliorated following treatment. While two earlier NMR studies of frontal cortex and thalamus reported no statistically significant differences in these metabolites in schizophrenia (Omori et al 1999, Prabakaran et al 2004), small reductions in both lactate and alanine levels were noted in the thalamus (Omori et al 1999). However, our finding of lower lactate in ventral ALIC differs from two previous post-mortem studies that found higher lactate levels in frontal white matter (Prabakaran et al 2004) and cerebellum (Halim et al 2008) in schizophrenia. Glycogen is rapidly converted into lactate post-mortem. Halim and colleagues propose that increased lactate could reflect an elevation in glycogen levels due to antipsychotic treatment. It should be noted that in the previous two studies (Halim et al 2008, Prabakaran et al 2004) the schizophrenia group had a lower mean pH than the controls and were obtained from patients with high lifetime prescribed doses of antipsychotic medication. In contrast, in the present study pH was slightly higher in the schizophrenia group and only two of our samples had detectable levels of antipsychotic drugs.
In addition to low levels of lactate, we also observed decreased alanine levels. Low levels of both lactate and alanine in white matter could indicate an alteration in astrocyte-neuron metabolic coupling. During periods of high neuronal activity lactate is released from astrocytes and is taken up by axons as an energy source for sustaining axon excitability, while alanine moves from neurons to astrocytes as part of the transfer of ammonia generated through the synthesis of glutamate (Tekkok et al 2005, Waagepetersen et al 2000). In white matter, glycolytic activity (which produces lactate) exceeds oxidative tricarboxylic acid cycle activity (Morland et al 2007). Of note, in schizophrenia white matter uptake of flurodeoxyglucose is higher than in control subjects, in contrast to grey matter where uptake is lower in patients (Buchsbaum et al 2007). We propose that high metabolic activity in white matter in schizophrenia could result in lactate depletion. Low levels of both lactate and alanine were previously seen in a rat model of absence seizures when the animals were maintained on a ketogenic diet (Melo et al 2006). These rats also had elevated brain glucose and astrocytic metabolism was increased.
Finally, we used the metabolite data to produce a model to assess whether the postmortem pattern of metabolites could be used to distinguish patients from controls. This strategy has previously been used to discriminate schizophrenia and control groups (Holmes et al 2006, Prabakaran et al 2004). Our model used available metabolite data from all samples and, as expected, good sensitivity and specificity was obtained for the samples used to construct the model. A statistical approach to validating the model also yielded a reasonably robust result, but a new series of samples is required to test the model rigorously.
We were unable to detect group differences in proteins representing myelin, axons or astrocytes in either ventral or dorsal regions of the ALIC. To date there have been few studies of myelin-associated proteins, or the mRNAs that encode them, in white matter in schizophrenia, and findings are inconsistent. In a previous study we found lower MBP protein levels in frontal grey matter in schizophrenic patients who died by suicide (Honer et al 1999), although we observed no deficit in visual association cortex in a second study (Beasley et al 2005), while MBP mRNA levels were also not changed in cingulate grey matter (Dracheva et al 2006). MBP protein levels have not been quantified in white matter in schizophrenia, although altered levels of other myelin-associated proteins/mRNAs have been reported. Lower levels of 2′, 3′-cyclic nucleotide 3′-phosphodiesterase (CNP) were noted in a proteomics study of prefrontal white matter (Prabakaran et al 2004). Furthermore, lower expression of myelin-associated glycoprotein (MAG) and CNP transcripts in anterior cingulate white matter was reported in schizophrenia (McCullumsmith et al 2007), although no difference in MAG or CNP mRNA expression was found in frontal white matter (Mitkus et al 2008). We also report no difference in levels of the astrocyte marker GFAP between groups, consistent with a previous immunocytochemical study in frontal white matter (Falkai et al 1999), and suggestive of a lack of ongoing neurodegeneration in this brain region. No group differences in levels of PNF or SNAP-25 were observed in the present study. Serine residues are heavily phosphorylated on axonal neurofilaments, compared with dendritic and perikaryal neurofilaments, and therefore PNF antibodies have been identified as axonal markers. SNAP-25 is a presynaptic protein that is transported in axons, and is lower in cortical grey matter in schizophrenia (Honer et al 2002). Levels of SNAP-25 in white matter are increased in Alzheimer’s disease, suggesting an impairment of axonal transport (Dessi et al 1997).
In summary, by focussing on the ALIC, we were able to detect differences in the white matter component of the fronto-striatal-thalamic circuitry in schizophrenia. Relationships between the metabolic function of neurons and glial cells may be a fruitful source of investigations to understand the mechanism of illness in schizophrenia.
References
- Alexander GE, DeLong MR, Strick PL. Parallel organization of functionally segregated circuits linking basal ganglia and cortex. Ann Rev Neurosci. 1986;(9):357–381. doi: 10.1146/annurev.ne.09.030186.002041. [DOI] [PubMed] [Google Scholar]
- Andreasen NC, Flashman L, Flaum M, Arndt S, Swayze V, 2nd, O’Leary DS, et al. Regional brain abnormalities in schizophrenia measured with magnetic resonance imaging. JAMA. 1994;(272):1763–1739. [PubMed] [Google Scholar]
- Axer H, Lippitz BE, Keyserlingk DG. Morphological asymmetry in anterior limb of human internal capsule revealed by confocal laser and polarized light microscopy. Psychiatry Res. 1999;(91):141–154. doi: 10.1016/s0925-4927(99)00029-3. [DOI] [PubMed] [Google Scholar]
- Axer H, Keyserlingk DG. Mapping of fiber orientation in human internal capsule by means of polarized light and confocal scanning laser microscopy. J Neurosci Methods. 2000;(94):165–175. doi: 10.1016/s0165-0270(99)00132-6. [DOI] [PubMed] [Google Scholar]
- Beasley CL, Honer WG, Bergmann K, Falkai P, Lütjohann D, Bayer TA. Reductions in cholesterol and synaptic markers in association cortex in mood disorders. Bipolar Disord. 2005;(7):449–455. doi: 10.1111/j.1399-5618.2005.00239.x. [DOI] [PubMed] [Google Scholar]
- Buchsbaum MS, Schoenknecht P, Torosjan Y, Newmark R, Chu KW, Mitelman S, et al. Diffusion tensor imaging of frontal lobe white matter tracts in schizophrenia. Ann Gen Psychiatry. 2006;(5):19. doi: 10.1186/1744-859X-5-19. [DOI] [PMC free article] [PubMed] [Google Scholar]
- Buchsbaum MS, Buchsbaum BR, Hazlett EA, Haznedar MM, Newmark R, Tang CY, Hof PR. Relative glucose metabolic rate higher in white matter in patients with schizophrenia. Am J Psychiatry. 2007;(164):1072–1081. doi: 10.1176/ajp.2007.164.7.1072. [DOI] [PubMed] [Google Scholar]
- Chakos MH, Lieberman JA, Bilder RM, Borenstein M, Lerner G, Bogerts B, et al. Increase in caudate nuclei volumes of first-episode schizophrenic patients taking antipsychotic drugs. Am J Psychiatry. 1994;(151):1430–1436. doi: 10.1176/ajp.151.10.1430. [DOI] [PubMed] [Google Scholar]
- Chudasama Y, Robbins TW. Functions of frontostriatal systems in cognition: comparative neuropsychopharmacological studies in rats, monkeys and humans. Biol Psychiatry. 2006;(73):19–38. doi: 10.1016/j.biopsycho.2006.01.005. [DOI] [PubMed] [Google Scholar]
- Clark L, Cools R, Robbins TW. The neuropsychology of ventral prefrontal cortex: decision-making and reversal learning. Brain Cogn. 2004;(55):41–53. doi: 10.1016/S0278-2626(03)00284-7. [DOI] [PubMed] [Google Scholar]
- Cohen J. Statistical Power Analysis for the Behavioral Sciences. Hillsdale, New Jersey: Lawrence Erlbaum Associates; 1988. [Google Scholar]
- Dessi F, Colle M-A, Hauw J-J, Duyckaerts C. Accumulation of SNAP-25 immunoreactive material in axons of Alzheimer’s disease. NeuroReport. 1997;(8):3685–3689. doi: 10.1097/00001756-199712010-00006. [DOI] [PubMed] [Google Scholar]
- Dracheva S, Davis KL, Chin B, Woo DA, Schmeidler J, Haroutunian V. Myelin-associated mRNA and protein expression deficits in the anterior cingulate cortex and hippocampus in elderly schizophrenia patients. Neurobiol Dis. 2006;(21):531–540. doi: 10.1016/j.nbd.2005.08.012. [DOI] [PubMed] [Google Scholar]
- Falkai P, Honer WG, David S, Bogerts B, Majtenyi C. No evidence for astrogliosis in brains of schizophrenic patients. Neuropathology & Applied Neurobiology. 1999;(25):48–53. doi: 10.1046/j.1365-2990.1999.00162.x. [DOI] [PubMed] [Google Scholar]
- Flynn SW, Lang DJ, Mackay AL, Goghari VM, Vavasour IM, Whittall KP, et al. Abnormalities of myelination in schizophrenia detected in vivo with MRI, and post-mortem with analysis of oligodendrocyte proteins. Molec Psychiatry. 2003;(8):811–820. doi: 10.1038/sj.mp.4001337. [DOI] [PubMed] [Google Scholar]
- Giasson BI, Mushynski WE. Aberrant stress-induced phosphorylation of perikaryal neurofilaments. J Biol Chem. 1996;(271):30404–30409. doi: 10.1074/jbc.271.48.30404. [DOI] [PubMed] [Google Scholar]
- Govindaraju V, Young K, Maudsley AA. Proton NMR chemical shifts and coupling constants for brain metabolites. NMR Biomed. 2000;(13):129–153. doi: 10.1002/1099-1492(200005)13:3<129::aid-nbm619>3.0.co;2-v. [DOI] [PubMed] [Google Scholar]
- Halim ND, Lipska BK, Hyde TM, Deep-Soboslay A, Saylor EM, Herman MM, et al. Increased lactate levels and reduced pH in postmortem brains of schizophrenics: medication confounds. J Neurosci Methods. 2008;(169):208–213. doi: 10.1016/j.jneumeth.2007.11.017. [DOI] [PMC free article] [PubMed] [Google Scholar]
- Harrison PJ. The neuropathology of schizophrenia: a critical review of the data and their interpretation. Brain. 1999;(12):593–624. doi: 10.1093/brain/122.4.593. [DOI] [PubMed] [Google Scholar]
- Harrison PJ, Weinberger DR. Schizophrenia genes, gene expression, and neuropathology: on the matter of their convergence. Mol Psychiatry. 2005;(10):40–68. doi: 10.1038/sj.mp.4001558. [DOI] [PubMed] [Google Scholar]
- Highley JR, Esiri MM, McDonald B, Roberts HC, Walker MA, Crow TJ. The size and fiber composition of the anterior commissure with respect to gender and schizophrenia. Biol Psychiatry. 1999a;(45):1120–1127. doi: 10.1016/s0006-3223(98)00323-0. [DOI] [PubMed] [Google Scholar]
- Highley JR, Esiri MM, McDonald B, Cortina-Borja M, Herron BM, Crow TJ. The size and fibre composition of the corpus callosum with respect to gender and schizophrenia: a post-mortem study. Brain. 1999b;(122):99–110. doi: 10.1093/brain/122.1.99. [DOI] [PubMed] [Google Scholar]
- Hof PR, Haroutunian V, Friedrich VL, Byne W, Buitron C, Perl DP, Davis KL. Loss and altered spatial distribution of oligodendrocytes in the superior frontal gyrus in schizophrenia. Biol Psychiatry. 2003;(53):1075–1085. doi: 10.1016/s0006-3223(03)00237-3. [DOI] [PubMed] [Google Scholar]
- Holmes E, Tsang TM, Huang JT, Leweke FM, Koethe D, Gerth CW, et al. Metabolic profiling of CSF: evidence that early intervention may impact on disease progression and outcome in schizophrenia. PLoS Med. 2006;(3):e327. doi: 10.1371/journal.pmed.0030327. [DOI] [PMC free article] [PubMed] [Google Scholar]
- Honer WG, Falkai P, Chen C, Arango V, Mann JJ, Dwork AJ. Synaptic and plasticity associated proteins in anterior frontal cortex in severe mental illness. Neuroscience. 1999;(91):1247–1255. doi: 10.1016/s0306-4522(98)00679-4. [DOI] [PubMed] [Google Scholar]
- Honer WG, Falkai P, Bayer TA, Xie J, Hu L, Li H-Y, et al. Abnormalities of SNARE mechanism proteins in anterior frontal cortex in severe mental illness. Cerebral Cortex. 2002;(12):349–356. doi: 10.1093/cercor/12.4.349. [DOI] [PubMed] [Google Scholar]
- Hulshoff Pol HE, Schnack HG, Mandl RC, Cahn W, Collins DL, Evans AC, Kahn RS. Focal white matter density changes in schizophrenia: reduced inter-hemispheric connectivity. Neuroimage. 2004;(21):27–35. doi: 10.1016/j.neuroimage.2003.09.026. [DOI] [PubMed] [Google Scholar]
- Kemether EM, Buchsbaum MS, Byne W, Hazlett EA, Haznedar M, Brickman AM, et al. Magnetic resonance imaging of mediodorsal, pulvinar, and centromedian nuclei of the thalamus in patients with schizophrenia. Arch Gen Psychiatry. 2003;(60):983–991. doi: 10.1001/archpsyc.60.9.983. [DOI] [PubMed] [Google Scholar]
- Kubicki M, Park H, Westin CF, Nestor PG, Mulkern RV, Maier SE, et al. DTI and MTR abnormalities in schizophrenia: analysis of white matter integrity. NeuroImage. 2005;(26):1109–1118. doi: 10.1016/j.neuroimage.2005.03.026. [DOI] [PMC free article] [PubMed] [Google Scholar]
- Kuperberg GR, Broome MR, McGuire PK, David AS, Eddy M, Ozawa F, et al. Regionally localized thinning of the cerebral cortex in schizophrenia. Arch Gen Psychiatry. 2003;(60):878–888. doi: 10.1001/archpsyc.60.9.878. [DOI] [PubMed] [Google Scholar]
- Lang DJ, Kopala LC, Vandorpe RA, Rui Q, Smith GN, Goghari VM, et al. Reduced basal ganglia volumes after switching to olanzapine in chronically treated patients with schizophrenia. Am J Psychiatry. 2004;(161):1829–1836. doi: 10.1176/ajp.161.10.1829. [DOI] [PubMed] [Google Scholar]
- Lang DJ, Khorram B, Goghari VM, Kopala LC, Vandorpe RA, Rui Q, et al. Reduced anterior internal capsule and thalamic volumes in first-episode psychosis. Schizophrenia Res. 2006;(87):89–99. doi: 10.1016/j.schres.2006.05.002. [DOI] [PubMed] [Google Scholar]
- Lim KO, Adalsteinsson E, Spielman D, Sullivan EV, Rosenbloom MJ, Pfefferbaum A. Proton magnetic resonance spectroscopic imaging of cortical gray and white matter in schizophrenia. Arch Gen Psychiatry. 1998;(55):346–352. doi: 10.1001/archpsyc.55.4.346. [DOI] [PubMed] [Google Scholar]
- Marner L, Pakkenberg B. Total length of nerve fibers in prefrontal and global white matter of chronic schizophrenics. J Psychiatr Res. 2003;(37):539–547. doi: 10.1016/s0022-3956(03)00069-4. [DOI] [PubMed] [Google Scholar]
- Massiot D, Fayon F, Capron M, King I, Le Calvé S, Alonso B, et al. Modelling one- and two-dimensional solid state NMR spectra. Magnet Resonance Chemistry. 2002;(40):70–76. [Google Scholar]
- McCullumsmith RE, Gupta D, Beneyto M, Kreger E, Haroutunian V, Davis KL, Meador-Woodruff JH. Expression of transcripts for myelination-related genes in the anterior cingulate cortex in schizophrenia. Schizophr Res. 2007;(90):15–27. doi: 10.1016/j.schres.2006.11.017. [DOI] [PMC free article] [PubMed] [Google Scholar]
- McIntosh AM, Job DE, Moorhead TW, Harrison LK, Lawrie SM, Johnstone EC. White matter density in patients with schizophrenia, bipolar disorder and their unaffected relatives. Biol Psychiatry. 2005;(58):254–257. doi: 10.1016/j.biopsych.2005.03.044. [DOI] [PubMed] [Google Scholar]
- Melo TM, Nehlig A, Sonnewald U. Neuronal-glial interactions in rats fed a ketogenic diet. Neurochem Int. 2006;(48):498–507. doi: 10.1016/j.neuint.2005.12.037. [DOI] [PubMed] [Google Scholar]
- Mitelman SA, Torosjan Y, Newmark RE, Schneiderman JS, Chu KW, Brickman AM, et al. Internal capsule, corpus callosum and long associative fibers in good and poor outcome schizophrenia: a diffusion tensor imaging survey. Schizophrenia Res. 2007;(92):211–224. doi: 10.1016/j.schres.2006.12.029. [DOI] [PubMed] [Google Scholar]
- Mitkus SN, Hyde TM, Vakkalanka R, Kolachana B, Weinberger DR, Kleinman JE, Lipska BK. Expression of oligodendrocyte-associated genes in dorsolateral prefrontal cortex of patients with schizophrenia. Schizophr Res. 2008;(98):129–138. doi: 10.1016/j.schres.2007.09.032. [DOI] [PMC free article] [PubMed] [Google Scholar]
- Morland C, Henjum S, Iversen EG, Skrede KK, Hassel B. Evidence for a higher glycolytic than oxidative metabolic activity in white matter of brain. Neurochem Int. 2007;(50):703–709. doi: 10.1016/j.neuint.2007.01.003. [DOI] [PubMed] [Google Scholar]
- Narr KL, Bilder RM, Toga AW, Woods RP, Rex DE, Szeszko PR, et al. Mapping cortical thickness and gray matter concentration in first episode schizophrenia. Cereb Cortex. 2005;(15):708–719. doi: 10.1093/cercor/bhh172. [DOI] [PubMed] [Google Scholar]
- Nicholas AP, Sambandam T, Echols JD, Tourtellotte WW. Increased citrullinated glial fibrillary acidic protein in secondary progressive multiple sclerosis. J Comp Neurol. 2004;(473):128–136. doi: 10.1002/cne.20102. [DOI] [PubMed] [Google Scholar]
- Omori M, Pearce J, Komoroski RA, Griffin ST, Mrak RE, Husain MM, Karson CN. In vitro 1H-magnetic resonance spectroscopy of postmortem brains with schizophrenia. Biol Psychiatry. 1997;(42):359–366. doi: 10.1016/S0006-3223(96)00409-X. [DOI] [PubMed] [Google Scholar]
- Prabakaran S, Swatton JE, Ryan MM, Huffaker SJ, Huang JT-J, Griffin JL, et al. Mitochondrial dysfunction in schizophrenia: evidence for compromised brain metabolism and oxidative stress. Molec Psychiatry. 2004;(9):684–697. doi: 10.1038/sj.mp.4001511. [DOI] [PubMed] [Google Scholar]
- Robbins TW. The case of frontostriatal dysfunction in schizophrenia. Schizophr Bull. 1990;(16):391–402. doi: 10.1093/schbul/16.3.391. [DOI] [PubMed] [Google Scholar]
- Robbins TW. Shifting and stopping: fronto-striatal substrates, neurochemical modulation and clinical implications. Phil Trans R Soc B. 2007;(362):917–932. doi: 10.1098/rstb.2007.2097. [DOI] [PMC free article] [PubMed] [Google Scholar]
- Shimizu M, Fujiwara H, Hirao K, Namiki C, Fukuyama H, Hayashi T, Murai T. Structural abnormalities of the adhesio interthalamica and mediodorsal nuclei of the thalamus in schizophrenia. Schizophr Res. 2008;(101):331–338. doi: 10.1016/j.schres.2007.12.486. [DOI] [PubMed] [Google Scholar]
- Tekin S, Cummings JL. Frontal-subcortical neuronal circuits and clinical neuropsychiatry: an update. J Psychosom Res. 2002;(53):647–654. doi: 10.1016/s0022-3999(02)00428-2. [DOI] [PubMed] [Google Scholar]
- Tekkok SB, Brown AM, Westenbroek R, Pellerin L, Ransom BR. Transfer of glycogen-derived lactate from astrocytes to axons via specific monocarboxylate transporters supports mouse optic nerve activity. J Neurosci Res. 2005;(81):644–652. doi: 10.1002/jnr.20573. [DOI] [PubMed] [Google Scholar]
- Waagepetersen HS, Sonnewald U, Larsson OM, Schousboe A. A possible role of alanine for ammonia transfer between astrocytes and glutamatergic neurons. J Neurochem. 2000;(75):471–479. doi: 10.1046/j.1471-4159.2000.0750471.x. [DOI] [PubMed] [Google Scholar]
- Zhou SY, Suzuki M, Hagino H, Takahashi T, Kawasaki Y, Nohara S, et al. Decreased volume and increased asymmetry of the anterior limb of the internal capsule in patients with schizophrenia. Biol Psychiatry. 2003;(54):427–436. doi: 10.1016/s0006-3223(03)00007-6. [DOI] [PubMed] [Google Scholar]