Abstract
Background
Preoperative diagnosis of malignancy in pancreatic cystic lesions (PCLs) remains challenging. Most non-mucinous cystic lesions (NMCLs) are benign, but mucinous cystic lesions (MCLs) are more likely to be premalignant or malignant.
Aim
The aim of this study was to assess the sensitivity, specificity, and positive and negative likelihood ratios (LRs) of EUS-FNA based cytology in differentiating MCLs from non-mucinous PCLs.
Methods
We conducted a comprehensive search of MEDLINE, SCOPUS, Cochrane, and “CINAHL Plus” databases to identify studies, in which the results of EUS-FNA based cytology of PCLs were compared with those of surgical biopsy or surgical excision histopathology. A DerSimonian-Laird random effect model was used to estimate the pooled sensitivity, specificity, and LRs, and a summary receiver-operating characteristic (SROC) curve was constructed.
Results
We included 376 patients from 11 distinct studies who underwent EUS-FNA based cytology and also had histopathological diagnosis. The pooled sensitivity and specificity in diagnosing MCLs were 0.63 (95% CI, 0.56–0.70) and 0.88 (95% CI, 0.83–0.93), respectively. The positive and negative LRs in diagnosing MCLs were 4.46 (95% CI, 1.21–16.43) and 0.46 (95% CI, 0.25–0.86), respectively. The area under the curve (AUC) was 0.89.
Conclusion
EUS-FNA based cytology has overall low sensitivity but good specificity in differentiating MCLs from NMCLs. Further research is required to improve the overall sensitivity of EUS-FNA based cytology to diagnose MCLs while evaluating PCL.
Keywords: EUS, FNA, cytology, meta-analysis, pancreatic cyst lesions
INTRODUCTION
Pancreatic cystic lesions (PCLs) comprise a variety of pathologically different groups of lesions that usually share many common clinical features [1–4]. About 90% of PCLs are benign processes such as pseudocysts related to acute or chronic pancreatitis [4–6]. Pancreatic cystic neoplasms (PCNs) constitute 10–15% of all PCLs and less than 1% of all pancreatic neoplasms [3,7]. PCLs can be broadly classified into mucinous cystic lesions (MCLs) and non-mucinous cystic lesions (NMCLs). NMCLs include entities such as pseudocysts (PCs), serous cyst adenomas (SCAs), solid pseudopapillary tumors (SPTs), and pancreatic endocrine tumors (PETs). MCLs are classified into benign, borderline, and malignant tumors based on the degree of epithelial dysplasia [8–10]. Though MCLs can be benign, they are more likely to be premalignant or malignant; and early resection can provide excellent prognosis [3,11,12]. In the past decade, endoscopic ultrasound (EUS) has increasing used as a diagnostic tool for PCNs, as it can provide high-resolution images of PCLs and also enable EUS-guided FNA of pancreatic cystic fluid [13]. Despite advances in diagnostic modalities like EUS and cyst fluid analysis by EUS FNA, preoperative diagnosis of cystic lesions remains difficult.
MATERIAL AND METHODS
Search Strategy
We performed a systematic literature review by using the guidelines developed for conducting systematic review [14]. A comprehensive search of the MEDLINE (PubMed and Ovid from 1966 to October 2008), SCOPUS (consisting of Medline and Embase databases), Cochrane Database of Systemic Reviews, and “CINAHL Plus” databases, was conducted using four combinations of search terms: a) pancreatic cyst, endoscopy, FNA; b) EUS AND pancreas AND cyst; c) EUS, FNA, pancreatic cystic neoplasm; and d) pancreatic cystic tumors AND EUS. Our search was restricted to human subjects and English language studies.
Inclusion Criteria
Intervention
EUS-FNA of PCLs
Criterion standards
Final pathologic diagnosis by surgical biopsy or by histological examination of surgically resected specimen.
Population
Patients who had suspected PCLs based on ultrasound, CT scan, MRI, or EUS. Only patients who had PCLs were included in the study. Patients with pancreatic lesions with solid component were excluded from the study.
Study designs
Retrospective or prospective studies that compared the results of EUS-FNA based cytology with surgical biopsy or histology.
Outcomes
Results reported in sufficient details to construct a diagnostic 2 × 2 table (true positive, false positive, true negative, and false negative).
Exclusion Criteria
We excluded case reports and case series; studies in which EUS-FNA was done for solid pancreatic lesions, with or without cystic component; studies that included both cystic and solid pancreatic lesions; studies that included clinical follow up as a criterion standard without knowing the disease status based on surgical pathology; studies that included other FNA approaches, like CT guided FNA or ultrasound guided FNA, in reporting their final results; and studies that did not provide data sufficient to construct a diagnostic 2 × 2 table.
Histological Criteria
Based on WHO tumor classifications, we classified all PCLs as either MCLs or non-mucinous cystic lesions. All cystic lesions arising from intraductal papillary neoplasms also were classified as MCLs.
Data Abstraction
From the selected studies, two independent reviewers (N.T. and S.T.) extracted the following data onto standardized data forms (in Microsoft Excel™):
Study characteristics: design, country, year of publication, setting, sample size, clinical context, and criterion standard
Demographic characteristics: mean age, proportion of male and female, and prevalence of MCLs out of total PCLs
Interventions: manufacture and operating frequencies of endoscope, gauge size, length, manufacturer of EUS-FNA needles, and cyto-pathological staining methods
Outcomes: number of true positive, true negative, false positive, and false negative for MCLs of pancreas
Discrepancies were resolved by discussion and consensus with a third reviewer (S.G.).
Quality Criteria
Current quality assessment guidelines and tools focus on randomization, selection bias of the arms in the study, concealment of allocation, and blinding of outcome to evaluate the quality of the clinical trials with control arm [15]. There is no consensus or criteria to evaluate the quality of the studies without a control arm [15]. Almost all of the studies focusing on the accuracy of EUS-FNA based cytology in PCLs are either retrospective or prospective studies without control arm. Therefore, for this systematic review and meta-analysis we selected studies based on our pre-defined inclusion and exclusion criteria and completeness of data reporting in the studies.
Statistical Analysis
We constructed a 2 × 2 table for each study; for studies in which 0 counts occurred in study data, a continuity correction of 0.5 was added to every value in that study in order to calculate sensitivity and specificity. Based on the 2 × 2 table, we calculated the true positive, false positive, true negative, and false negative values and entered these into the statistical software package Meta-Disc version 1.4 (Meta-Disc, Unit of Clinical Biostatistics team of the Roman y Cajal Hospital, Madrid, Spain) [16]. We calculated the sensitivity, specificity, positive LR, negative LR, and diagnostic odds ratio (DOR: positive LR/negative LR) for each study and then pooled the results as per the DerSimonian-Liard random effects model [17]. Meta-Disc version 1.4 was used to generate Forest plots of sensitivity, specificity, positive LRs, and negative LRs. We performed subgroup analysis and calculated sensitivity, specificity, positive LRs and negative LRs for subgroup of four prospective studies.
Heterogeneity was assessed by using χ2 statistics [18,19]. By using DerSimonian-Liard random effects model, we constructed a summary receiver operating characteristic curve (SROC) [17]. The area under the curve (AUC) was computed by numeric integration of the SROC equation by using the trapezoidal method [20]. A preferred test has an AUC close to 1, and a poor test has an AUC close to 0.5. We used the random effect meta-regression analysis and Moses-Shapiro-Litternberg method [21] to examine study design (prospective v/s retrospective), Single center versus multicenter, sex ratio, sample size, and EUS FNA needle size for the heterogeneity analysis. The results of the meta-regression model were expressed as relative diagnostic odds ratio (RDOR) of the corresponding covariate [21].
RESULTS
SYSTEMATIC REVIEW
Description of studies
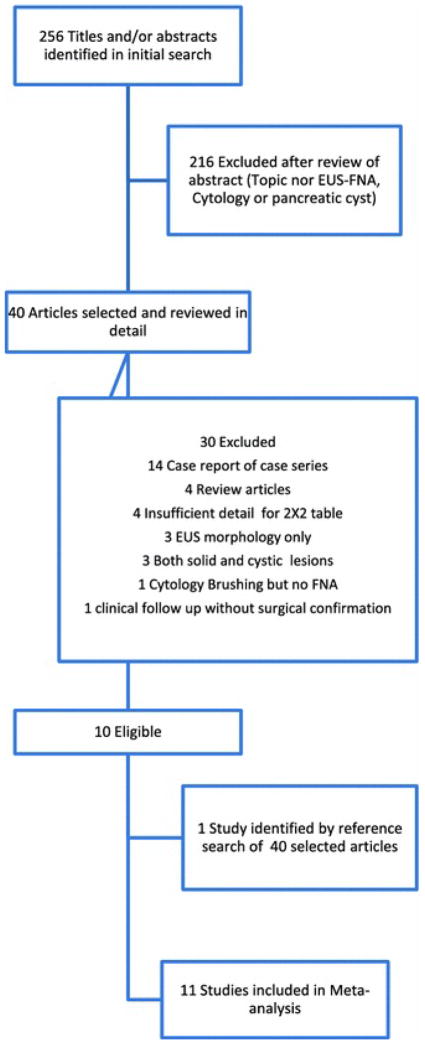
Our study selection process is described in detail in Figure 1. Our initial search yielded 256 study titles and abstracts. Of these, 11 studies [22–32] met the predefined inclusion and exclusion criteria and were selected for meta-analysis. Ten studies were from USA, and 1 was from France [24]. Seven studies were retrospective [22,23,26,28–31] and 4 studies were prospective [24,25,27,32]. Altogether, the studies reported on 937 patients (361 male and 576 female). The mean age was 59 years. Of 937 total patients, EUS-FNA of PCLs had been performed on 788 patients and surgical biopsy or surgical resection had been performed on 446 patients. Of 446 patients with surgery, 70 patients underwent surgical resection based on clinical characteristics and EUS morphology without EUS-FNA and they were excluded from analysis. Similarly, of 788 patients with EUS-FNA, 412 patients did not receive a final diagnosis by surgical biopsy or resection and they were also excluded from analysis. This left 376 patients who received both a satisfactory EUS-FNA for cytological diagnosis and the gold standard comparison by either surgical histology or biopsy. The study characteristics of the included manuscripts are shown in Table 1. Seven [22,24,29–32] out of 11 studies further differentiated mucinous cysts into mucinous cyst adenoma, mucinous adenocarcinoma and intra papillary mucinous neoplasia. Table 2 details the results of EUS-FNA and final histology for each mucinous cyst subtypes (MCAs, IPMNs, and Adenocarcinomas) in the 7 studies.
Figure 1.
Flow diagram of study selection process for the Systematic Review and Meta-analysis
Table 1.
Characteristics of included studies
| Index | Study Detail | Study Design | Total | EUS-FNA | Surgery | Target Population * |
|---|---|---|---|---|---|---|
| 1 | Hernandez22 2002 USA | Retrospective | 43 | 21 | 7 | 4 |
| 2 | Sedlack23 2002 USA | Retrospective | 111 | 18 | 34 | 12 |
| 3 | Frossard24 2003 France | Prospective | 127 | 127 | 67 | 67 |
| 4 | Brugge25 2004 USA | Prospective | 341 | 341 | 112 | 109 |
| 5 | Recine26 2004 USA | Retrospective | 13 | 13 | 13 | 13 |
| 6 | Khalid27 2005 USA | Prospective | 36 | 36 | 31 | 23 |
| 7 | Linder28 2006 USA | Retrospective | 102 | 102 | 71 | 55 |
| 8 | Moparty29 2006 USA | Retrospective | 45 | 30 | 11 | 11 |
| 9 | Attasaranya30 2007 USA | Retrospective | 48 | 48 | 48 | 34 |
| 10 | Belsley31 2007 USA | Retrospective | 28 | 9 | 9 | 7 |
| 11 | Shami32 2007 USA | Prospective | 43 | 43 | 43 | 41 |
| 937 | 788 | 446 | 376 |
Target population: Indicates group of people who satisfied all inclusion criteria: Satisfactory EUS-FNA diagnosis and final diagnosis by surgical biopsy or surgical resection and histology.
Table 2.
Mucinous Cyst Subtypes
| Index | Author | MCA | Adenocarcinoma | IPMN | Total Mucinous | ||||
|---|---|---|---|---|---|---|---|---|---|
| EUS FNA | Histology | EUS FNA | Histology | EUS FNA | Histology | EUS FNA | Histology | ||
| 1 | Hernandez | 0 | 0 | 2 | 2 | 0 | 0 | 2 | 2 |
| 2 | Sedlack | 0 | 4 | 1 | 1 | 0 | 1 | 1 | 6 |
| 3 | Frossard ** | 16 | 17 | 9 | 9 | 15 | 14 | 40 | 40 |
| 4 | Moparty * | 5 | 3 | 2 | 2 | 1 | 3 | 8 | 8 |
| 5 | Attasaranya | 0 | 10 | 3 | 3 | 0 | 0 | 3 | 13 |
| 6 | Belsley * | 2 | 0 | 0 | 0 | 0 | 0 | 2 | 0 |
| 7 | Shami | 7 | 12 | 6 | 6 | 6 | 9 | 19 | 27 |
| 30 | 46 | 23 | 23 | 22 | 27 | 75 | 96 | ||
| % of Correct Diagnosis | 56.52% (26/46) | 100% (23/23) | 77.78% (21/27) | 72.91% (70/96) | |||||
Both Moparty and Belsley had 2 false positive results for MCA by EUS-FNA
Frossard had 1 false positive result for IMPN by EUS-FNA
EUS-FNA Method
Most studies used 22-gauge needles (Wilson-Cook, Medical Inc, Winston-Salem, N.C.) [27,28,30–32], though some also used 19-gauge [25,27,31,32] (Wilson-Cook, Medical Inc, Winston-Salem, NC and Mediglobe, Tempe, AZ), 23-gauge [26] (Pentax 23-guage, 4-cm needle), and 25-gauge [27] needles (EchoTip; Wilson-Cook, Medical Inc, Winston-Salem, NC).
META-ANALYSIS
Diagnostic Accuracy
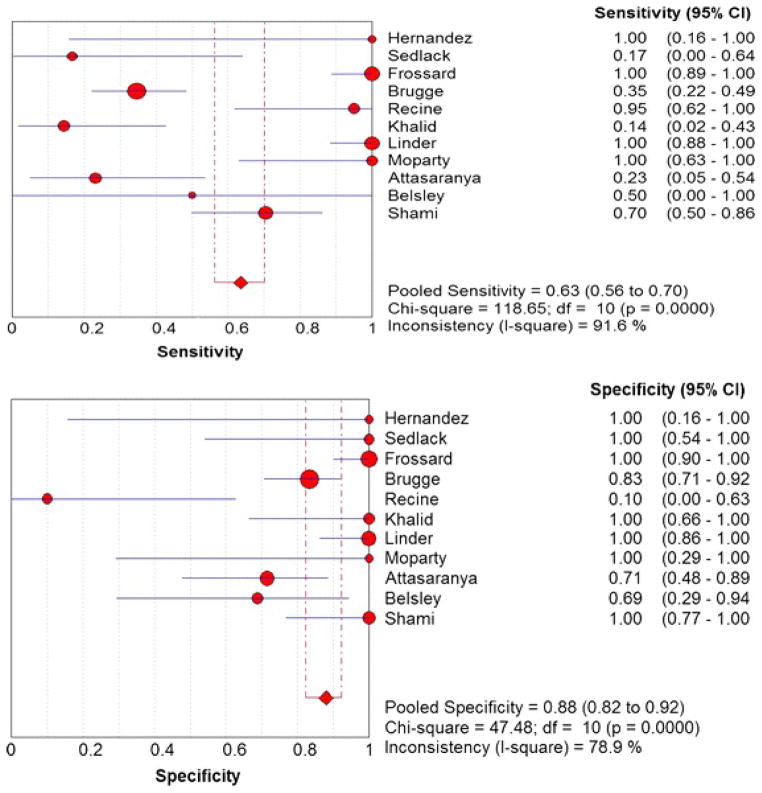
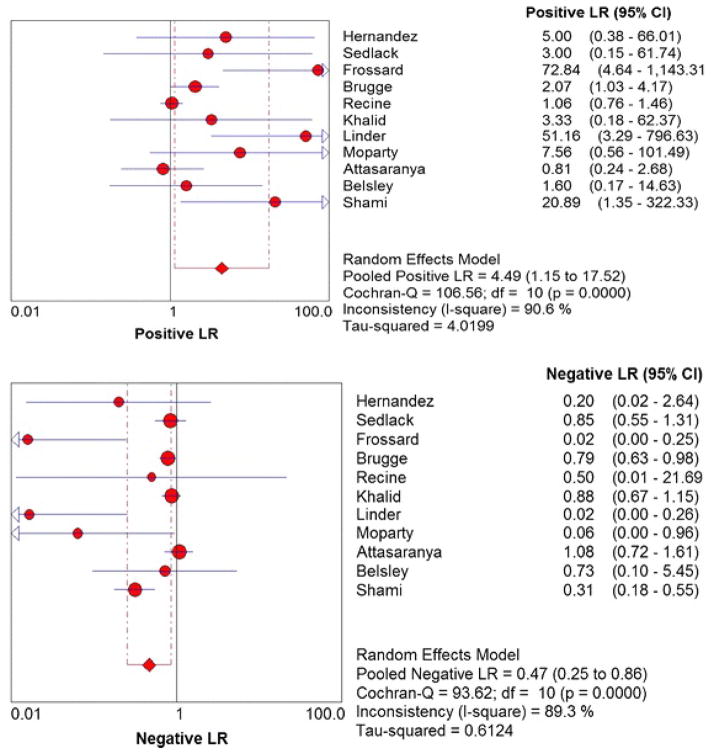
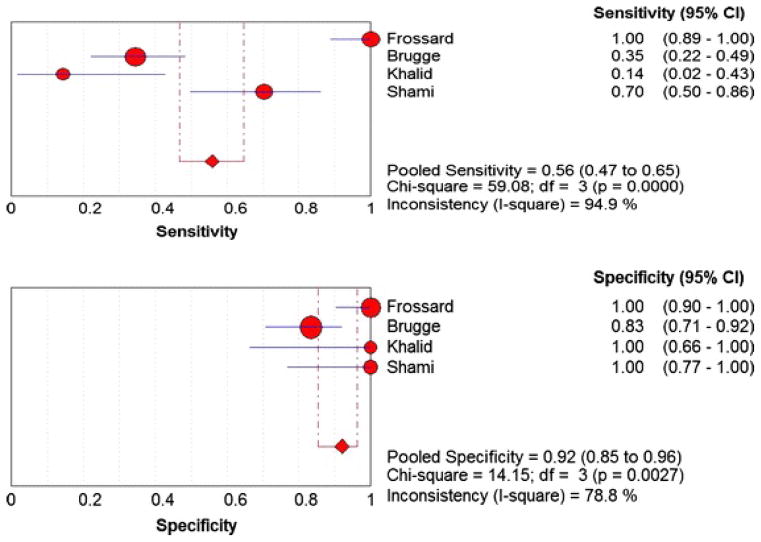
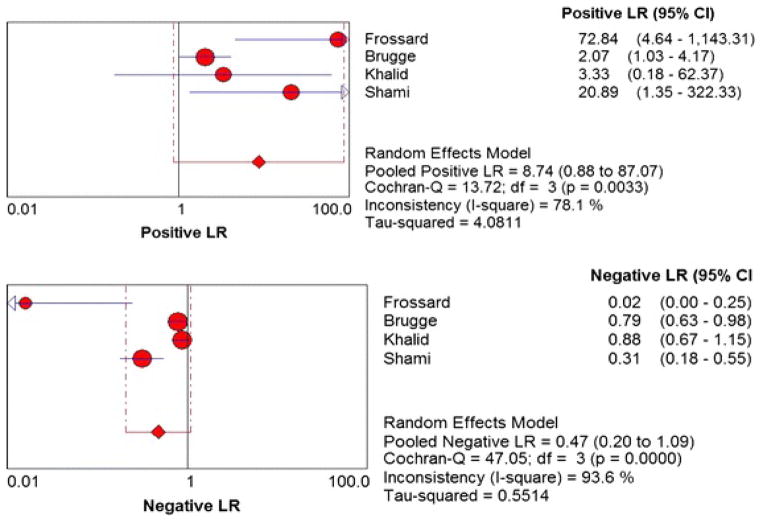
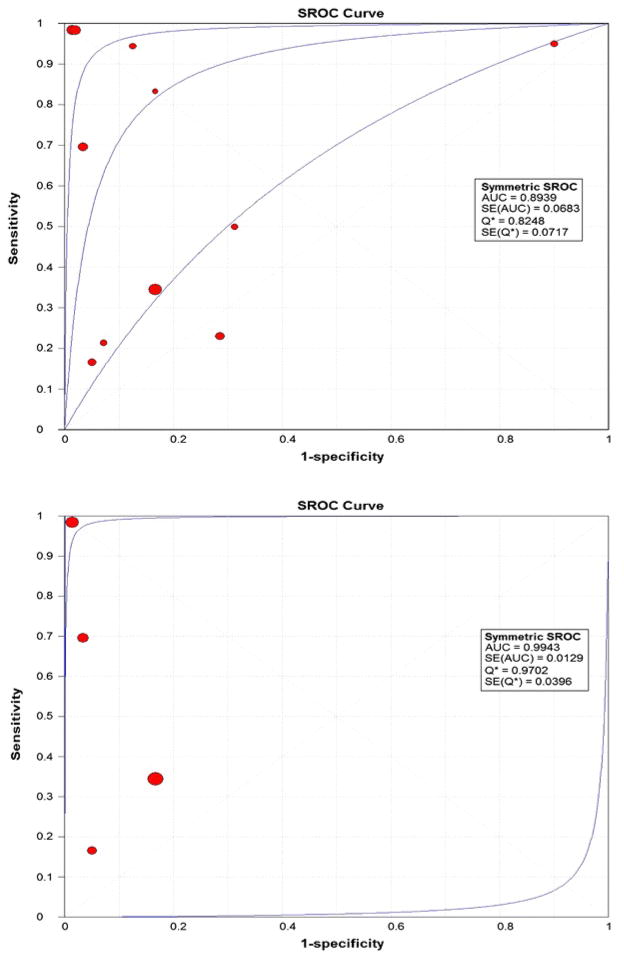
Figure 2 shows the Forest plots of sensitivity and specificity of EUS-FNA based cytology for the diagnosis of mucinous PCLs. Point estimates were plotted with 95% confidence intervals (CIs) for each cohort. The pooled sensitivity of EUS-FNA based cytology in diagnosing MCLs was 0.63 (95% CI, 0.56–0.70) and pooled specificity was 0.88 (95% CI, 0.83–0.93). The positive LR was 4.46 (95% CI, 1.21–16.43) and the negative LR was 0.46 (95% CI, 0.25–0.86) (Figure 3). The P value for χ2 heterogeneity for all the pooled estimates was less than 0.05 suggesting heterogeneity amongst the studies. To explore heterogeneity, we performed a subgroup analysis of 4 prospective studies. In subgroup analysis of 4 prospective studies, the pooled sensitivity of EUS-FNA based cytology was 0.54 (95% CI, 0.45 to 0.62) and the pooled specificity was 0.92 (95% CI, 0.85 to 0.96) (Figure 4). Similarly the pooled positive LR was 8.22 (95% CI, 0.82 to 82.36) and the pooled negative LR was 0.47 (95% CI, 0.20 to 1.12) (Figure 5). The overall accuracy of EUS in a SROC plot for meta-analysis and subgroup analysis is shown in Figure 6. The symmetric curve shows a trade-off between sensitivity and specificity. The AUC was 0.89 for all 11 studies and was 0.99 for 4 prospective studies, indicating high test accuracy.
Figure 2.
Pooled sensitivity and specificity. The size of each round is proportional to the sample size for each study, and the horizontal lines through the rounds indicate a graphical representation of the 95% CI of that study. For the combined analysis, the diamond and vertical dashed bar indicates the pooled sensitivity or specificity, with the left and right ends of the vertical bar indicating the pooled 95% CI.
Figure 3.
Pooled positive and negative likelihood ratios. The size of each round is proportional to the sample size for each study, and the horizontal lines through the rounds indicate a graphical representation of the 95% CI of that study. For the combined analysis, the diamond and vertical dashed bar indicates the pooled positive or negative likelihood ratio, with the left and right ends of the vertical bar indicating the pooled 95% CI.
Figure 4.
Pooled sensitivity and specificity for all prospective studies. The size of each round is proportional to the sample size for each study, and the horizontal lines through the rounds indicate a graphical representation of the 95% CI of that study. For the combined analysis, the diamond and vertical dashed bar indicates the pooled sensitivity or specificity, with the left and right ends of the vertical bar indicating the pooled 95% CI.
Figure 5.
Pooled positive and negative likelihood ratios for all prospective studies. The size of each round is proportional to the sample size for each study, and the horizontal lines through the rounds indicate a graphical representation of the 95% CI of that study. For the combined analysis, the diamond and vertical dashed bar indicates the pooled positive or negative likelihood ratio, with the left and right ends of the vertical bar indicating the pooled 95% CI.
Figure 6.
Summary Receiver Operating Characteristic (SROC) Curve for all 11 studies of meta-analysis and SROC Curve for 4 prospective studies
Among the 7 studies [22–24,29–32] that further differentiated mucinous cyst into MCAs, mucinous adenocarcinomas and IPMNs, EUS-FNAs were able to correctly diagnose 26 of 46 (56.52%) of MCAs, 23 of 23 (100%) of mucinous adenocarcinomas and 70 of 96 (72.91%) of IPMNs (Table 2).
We identified 13 potential sources of heterogeneity: (1) study design(prospective versus retrospective), (2) single center versus multi-center, (3) sample size, (4) sex ratio, (5) cyst location, (6) cyst size, (7) EUS-FNA needle size, (8) average needle pass, (9) amount of the cyst fluid aspirated, (10) presence or absence of the cytopathologist at time of cyst aspiration, (11) average time from aspiration of cyst fluid to preparation of slide, (12) type and total number of histological stains are used, and (13) experience of the cytopathologist. However, the 11 primary studies provided data sufficient to analyze heterogeneity for only 5 of the 13 identified sources: study design, single center versus multi-center, sample size, sex ratio, and EUS-FNA needle size. Meta-regression for study design, single center versus multi-center, sample size, and sex ratio did not show any statistical significant difference. Of 11 studies, 10 reported needle sizes for EUS-FNA. Meta-regression for needle size in these 10 studies did not show statistically significant difference. The outcomes of the regression analysis as RDOR are shown in Table 3.
Table 3.
Meta-regression analysis to determine sources of heterogeneity for all 11 studies and subgroup of all prospective studies
| Covariate | coefficient | p-value | RDOR | 95% CI |
|---|---|---|---|---|
| Meta-analysis | ||||
| Sex (ratio of male vs. female) | −1.23 | 0.81 | 0.29 | (0.0, >1000) |
| Sample size | 0.09 | 0.31 | 1.09 | (0.89, 1.33) |
| Design (prospective vs. retrospective) | 0.24 | 0.94 | 1.27 | (0.0, >1000) |
| Center (multi-center vs. single center) | −8.72 | 0.26 | 0 | (0.0, >1000) |
| Country (America vs. non-America) | −1.73 | 0.75 | 0.18 | (0.0, >1000) |
| Needle size* | −0.95 | 0.49 | 0.39 | (0.02, 8.48) |
| Subgroup (Prospective Studies) Analysis | ||||
| Sex (ratio of male vs. female) | 22.3 | 0.2 | >1000 | (0,>1000) |
| Sample size | −0.06 | 0.18 | 0.94 | (0.75, 1.17) |
| Center (multi-center vs. single center) | −3.91 | 0.17 | 0.02 | (0,>1000) |
| Country (America vs. non-America) | −5.61 | 0.48 | 0 | (0,>1000) |
| Needle size | 1.65 | 0.55 | 5.19 | (0, >1000) |
based on uni-variate meta-regression and reduced data (centers = 10)
DISCUSSION
EUS-FNA has a diagnostic advantage over other FNA methods, including CT-guided FNA and US-guided FNA, that historically have been relatively unsuccessful as pancreatic cysts can be very small and inaccessible [33–35]. This systematic review of EUS-FNA based cytology for patients who have PCLs found that EUS-FNA has good diagnostic accuracy, with an AUC of 0.89. Our meta-analysis showed EUS-FNA based cytology to have a pooled sensitivity of 63% (95% CI, 0.56–0.70) and a pooled specificity of 88% (95% CI, 0.83–0.93). The subgroup analysis of 4 prospective studies showed sensitivity 0.54 (95% CI, 0.45 to 0.62) and specificity 0.92 (95% CI, 0.85 to 0.96). In our study the positive and negative LRs were 4.93 (95% CI, 1.35–18.08) and 0.46 (95% CI, 0.27–0.80) respectively. Further, analysis of different mucinous cyst subtypes revealed EUS-FNA accurately diagnosed mucinous adenocarcinomas (100%) and IPMNs (72.91%) more frequently than it diagnosed MCAs (56.52%). The pooled sensitivity of 63% might be overestimated than the real sensitivity secondary to verification bias [36]. Verification bias occurs when out of all the patients who had diagnostic test only a subgroup of patient undergoes confirmatory test. Verification bias can be avoided by requiring everyone who enrolls in the study, to undergo confirmatory test (i.e. pancreatic cyst biopsy or surgical resection) irrespective of the positive or negative diagnostic test (i.e. EUS-FNA) result but this is not practical and ethical. It is reasonable to assume that patients with positive EUS-FNA based cytology were more likely to undergo confirmatory test than the patients with negative EUS-FNA based cytology raising the sensitivity of the diagnostic test. For the same reason the pooled specificity of 88% might be underestimated than the real specificity. Further calculations for the verification bias were not possible secondary to lack of adequate reporting in the included studies.
Major pitfalls in diagnosis of PCLs by EUS-FNA include a high frequency of insufficient aspirates and difficulty in differentiating pathological mucin from gastrointestinal contaminant secondary to a transgastric or transduodenal approach of EUS-FNA. Most studies have shown that rapid on-site evaluation (ROSE) by the cytopathologist can help to assess adequacy of sample and also improve diagnostic yield of the procedure. A recent study by Hikichi et al showed even when a cytopathologist is not available, rapid on-site evaluation by endosonographer is equally effective and helps to increase the diagnostic yield [37]. The presence of extra-cellular mucin or intracytoplasmic mucin within neoplastic cells aids in the diagnosis of mucinous neoplasms. Pathological mucin is grossly thicker and more viscid, and on air-dried Diff-Quick stained smears or ethanol fixed Papanicolaou stained smears, it appears more abundant than gastrointestinal contaminant does. If only liquid based preparations are mad, then mucus is very difficult to appreciate.
Frossard et al [24] prepared cell blocks and used special mucin stains like hematoxylin-eosin-saffron, periodic acid-Schiff, and Alcian blue, in addition to routine Diff-Quick stained smears. They used the ThinPrep 2000 processor (Cytyc Corporation, Marlborough, MA) to concentrate scant fluids to generate mono-layered cell populations with cleaner backgrounds and had the same pathologist analyze all smears and biopsies. In this study, 67 patients met our inclusion criteria, and for this subset of patients, the EUS-FNA based cytology had sensitivity and specificity of 100%; only 1 patient who had a MCA was diagnosed as having an IPMN. In contrast, Attasaranya et al [30] prepared one air dried, modified Giemsa stained smear, and one alcohol fixed, Papanicolaou stained smear for on-site evaluation. Of the 48 aspirates taken 14 were hypocellular to make an FNA diagnosis. They did not perform any mucin stains on any specimens. In their subset of 34 patients, the EUS-FNA based cytology had sensitivity of 23% and a specificity of 71%. These conflicting results among these studies might suggest that presence of on-site cytopathologist, and a standardize protocol for smear stains combined with the use of special mucin stains and a ThinPrep 2000 processor can help to improve the diagnostic accuracy of EUS-FNA based cytology.
Our systematic review identified that current literature on diagnostic accuracy of EUS-FNA based cytology for PCLs is limited and heterogeneous. There is no randomized clinical trial focusing on this issue. In our meta-analysis, heterogeneity is probably caused by factors that were inadequately reported in the 11 primary studies and, therefore, cannot be explored. These factors include cyst size and location, volume of the aspirated cyst fluid, presence of a cytopathologist in the endoscopy suite during the procedure, time interval from the aspiration of cyst fluid to the preparation of pathological slides, the methods of staining, and experience of cyto-pathologist. Although we were not able to demonstrate needle size as a significant factor for heterogeneity due to lack of adequate data reporting, a recent study by Song et el clearly showed that for solid pancreatic lesions, EUS-FNA with 19 gauge needle had significantly higher diagnostic accuracy compared to 22 gauge needle (93.9 vs. 78.1, p<0.05)37. Also 19 gauge needle required less number of needle passages and aspirated significantly higher amount of cellular material [38].
In addition to cytology, cyst fluid analysis for tumor markers including CEA, CA 19-9, CA 72-4, CA 125, and molecular markers including K-ras mutations and loss of heterogeneity (LOH) was also performed in several studies [25,27,28]. Cooperative pancreatic cyst study reported that a cut off value of 192 for CEA has the greatest AUC (0.79) for differentiation of mucinous versus non-mucinous PCLs [25]. The study also reported that CEA has greater accuracy, in diagnosing MCLs, than EUS morphology or cytology [25]. However different studies reported different cut-off values for CEA analysis including 5, 148, 192, 300, 467, and 800 [25,32,38–41]. Based on 36 cyst fluid samples, Khalid et al reported that occurrence of K-ras mutations as a first hit had sensitivity of 91% and specificity of 86%, whereas presence of allelic loss (measured by LOH) after K-ras mutations had sensitivity of 91% and specificity of 93% respectively [27]. These studies show a promising role of CEA and molecular analysis in differentiating MCL from non-mucinous PCLs. CEA can be a very valuable tumor marker; however more research is needed to define clear cut-off values for CEA. Initial studies on molecular analyses of pancreatic cancer associated mutations of K-ras and other oncogenes/tumor-suppressor genes and expression of novel biomarkers are quite promising but more trials with larger sample sizes are needed in this direction.
In conclusion, based on the currently available English language literature, our meta-analysis reveals that EUS-FNA based cytology has overall low sensitivity but good specificity in differentiating mucinous from non-mucinous PCLs. Rapid on-site evaluation by a cytopathologist or an endosonographer, use of standardized techniques for smear staining, use of special mucin stains and use of the ThinPrep 2000 to provide a mono-layered cell populations with cleaner backgrounds can help to increase diagnostic yield of EUS-FNA based cytology. Well designed randomized trials are needed to further explore the role of EUS-FNA based cytology in differentiating mucinous PLCs from non-mucinous PCLs. Further emphasis on the combined role of EUS morphology, FNA based cytology, and cyst fluid analysis for potential tumor and molecular markers may help to improve the overall accuracy of EUS FNA in the diagnosis of mucinous PCLs.
Acknowledgments
Grant support: This work was supported in part by The University of Texas M. D. Anderson Cancer Center Physician Scientist Program Award (to SG).
We would like to express our sincere thanks to Margaret Newell from the Division of Internal Medicine at the University of Texas M. D. Anderson Cancer Center for help with editing.
Abbreviations
- EUS
endoscopic ultrasound
- FNA
fine needle aspiration
- PCL
pancreatic cyst lesions
- PCN
pancreatic cyst neoplasm
- NMCLs
non-mucinous cystic lesions
- MCL
mucinous cystic lesions
- PC
pseudocyst
- SCA
serous cyst adenoma
- SPT
solid pseudopapillary tumor
- PET
pancreatic endocrine tumor
- IPMN
intraductal papillary mucinous neoplasms
- CEA
carcinoembryonic antigen
- LR
likelihood ratio
- SROC
summary receiver operating characteristic
- DOR
diagnostic odds ratio
- AUC
area under curve
References
- 1.Box JC, Douglas HO. Management of cystic neoplasms of the pancreas. Am Surg. 2000;66(5):495–501. [PubMed] [Google Scholar]
- 2.Fernandez-del Castillo C, Warshaw AL. Cystic tumors of the pancreas. Surg Clin North Am. 1995;75(5):1001–16. doi: 10.1016/s0039-6109(16)46742-3. [DOI] [PubMed] [Google Scholar]
- 3.Warshaw AL, Compton CC, Lewandrowski K, et al. Cystic tumors of the pancreas. New clinical, radiologic, and pathologic observations in 67 patients. Ann Surg. 1990;212(4):432, 43. doi: 10.1097/00000658-199010000-00006. discussion 444–5. [DOI] [PMC free article] [PubMed] [Google Scholar]
- 4.Warshaw AL, Rutledge PL. Cystic tumors mistaken for pancreatic pseudocysts. Ann Surg. 1987;205(4):393–8. doi: 10.1097/00000658-198704000-00009. [DOI] [PMC free article] [PubMed] [Google Scholar]
- 5.Steinberg W, Tenner S. Acute pancreatitis. N Engl J Med. 1994;330(17):1198–210. doi: 10.1056/NEJM199404283301706. [DOI] [PubMed] [Google Scholar]
- 6.Steer ML. Pathogenesis of acute pancreatitis. Digestion. 1997;58 (Suppl 1):46–9. doi: 10.1159/000201525. [DOI] [PubMed] [Google Scholar]
- 7.Balthazar EJ, Chako AC. Computed tomography of pancreatic masses. Am J Gastroenterol. 1990;85(4):343–9. [PubMed] [Google Scholar]
- 8.Zamboni G, Scarpa A, Bogina G, et al. Mucinous cystic tumors of the pancreas: Clinicopathological features, prognosis, and relationship to other mucinous cystic tumors. Am J Surg Pathol. 1999;23(4):410–22. doi: 10.1097/00000478-199904000-00005. [DOI] [PubMed] [Google Scholar]
- 9.Wilentz RE, Albores-Saavedra J, Hruban RH. Mucinous cystic neoplasms of the pancreas. Semin Diagn Pathol. 2000;17(1):31–42. [PubMed] [Google Scholar]
- 10.Kloppel G, Solcia E, Longnecker DS, et al. Histological typing of tumors of the exocrine pancreas: World health organization international histological classification of tumors. 2. New York: Springer-Verlag; 1998. [Google Scholar]
- 11.Sarr MG, Carpenter HA, Prabhakar LP, et al. Clinical and pathologic correlation of 84 mucinous cystic neoplasms of the pancreas: Can one reliably differentiate benign from malignant (or premalignant) neoplasms? Ann Surg. 2000;231(2):205–12. doi: 10.1097/00000658-200002000-00009. [DOI] [PMC free article] [PubMed] [Google Scholar]
- 12.Siech M, Tripp K, Schmidt-Rohlfing B, et al. Cystic tumours of the pancreas: Diagnostic accuracy, pathologic observations and surgical consequences. Langenbecks Arch Surg. 1998;383(1):56–61. doi: 10.1007/s004230050092. [DOI] [PubMed] [Google Scholar]
- 13.Gress F, Gottlieb K, Cummings O, et al. Endoscopic ultrasound characteristics of mucinous cystic neoplasms of the pancreas. Am J Gastroenterol. 2000;95(4):961–5. doi: 10.1111/j.1572-0241.2000.01976.x. [DOI] [PubMed] [Google Scholar]
- 14.Irwig L, Macaskill P, Glasziou P, et al. Meta-analytic methods for diagnostic test accuracy. J Clin Epidemiol. 1995;48(1):119, 30. doi: 10.1016/0895-4356(94)00099-c. discussion 131–2. [DOI] [PubMed] [Google Scholar]
- 15.Stroup DF, Berlin JA, Morton SC, et al. Meta-analysis of observational studies in epidemiology: a proposal for reporting. JAMA. 2000;238:2008–2012. doi: 10.1001/jama.283.15.2008. [DOI] [PubMed] [Google Scholar]
- 16.Zamora J, Abraira V, Muriel A, et al. Meta-DiSc: A software for meta-analysis of test accuracy data. BMC Med Res Methodol. 2006;6:31. doi: 10.1186/1471-2288-6-31. [DOI] [PMC free article] [PubMed] [Google Scholar]
- 17.DerSimonian R, Laird N. Meta-analysis in clinical trials. Control Clin Trials. 1986;7(3):177–88. doi: 10.1016/0197-2456(86)90046-2. [DOI] [PubMed] [Google Scholar]
- 18.Higgins JP, Thompson SG, Deeks JJ, Altman DG. Measuring inconsistency in meta-analyses. BMJ. 2003;327(7414):557–60. doi: 10.1136/bmj.327.7414.557. [DOI] [PMC free article] [PubMed] [Google Scholar]
- 19.Higgins JP, Thompson SG. Quantifying heterogeneity in a meta-analysis. Stat Med. 2002;21(11):1539–58. doi: 10.1002/sim.1186. [DOI] [PubMed] [Google Scholar]
- 20.Hanley JA, McNeil BJ. The meaning and use of the area under a receiver operating characteristic (ROC) curve. Radiology. 1982;143(1):29–36. doi: 10.1148/radiology.143.1.7063747. [DOI] [PubMed] [Google Scholar]
- 21.Lijmer JG, Bossuyt PM, Heisterkamp SH. Exploring sources of heterogeneity in systematic reviews of diagnostic tests. Stat Med. 2002;21(11):1525–37. doi: 10.1002/sim.1185. [DOI] [PubMed] [Google Scholar]
- 22.Hernandez LV, Mishra G, Forsmark C, et al. Role of endoscopic ultrasound (EUS) and EUS-guided fine needle aspiration in the diagnosis and treatment of cystic lesions of the pancreas. Pancreas. 2002;25(3):222–8. doi: 10.1097/00006676-200210000-00002. [DOI] [PubMed] [Google Scholar]
- 23.Sedlack R, Affi A, Vazquez-Sequeiros E, et al. Utility of EUS in the evaluation of cystic pancreatic lesions. Gastrointest Endosc. 2002;56(4):543–7. doi: 10.1067/mge.2002.128106. [DOI] [PubMed] [Google Scholar]
- 24.Frossard JL, Amouyal P, Amouyal G, et al. Performance of endosonography-guided fine needle aspiration and biopsy in the diagnosis of pancreatic cystic lesions. Am J Gastroenterol. 2003;98(7):1516–24. doi: 10.1111/j.1572-0241.2003.07530.x. [DOI] [PubMed] [Google Scholar]
- 25.Brugge WR, Lewandrowski K, Lee-Lewandrowski E, et al. Diagnosis of pancreatic cystic neoplasms: A report of the cooperative pancreatic cyst study. Gastroenterology. 2004;126(5):1330–6. doi: 10.1053/j.gastro.2004.02.013. [DOI] [PubMed] [Google Scholar]
- 26.Recine M, Kaw M, Evans DB, et al. Fine-needle aspiration cytology of mucinous tumors of the pancreas. Cancer. 2004;102(2):92–9. doi: 10.1002/cncr.20052. [DOI] [PubMed] [Google Scholar]
- 27.Khalid A, McGrath KM, Zahid M, et al. The role of pancreatic cyst fluid molecular analysis in predicting cyst pathology. Clin Gastroenterol Hepatol. 2005;3(10):967–73. doi: 10.1016/s1542-3565(05)00409-x. [DOI] [PubMed] [Google Scholar]
- 28.Linder JD, Geenen JE, Catalano MF. Cyst fluid analysis obtained by EUS-guided FNA in the evaluation of discrete cystic neoplasms of the pancreas: A prospective single-center experience. Gastrointest Endosc. 2006;64(5):697–702. doi: 10.1016/j.gie.2006.01.070. [DOI] [PubMed] [Google Scholar]
- 29.Moparty B, Logrono R, Nealon WH, et al. The role of endoscopic ultrasound and endoscopic ultrasound-guided fine-needle aspiration in distinguishing pancreatic cystic lesions. Diagn Cytopathol. 2007;35(1):18–25. doi: 10.1002/dc.20558. [DOI] [PubMed] [Google Scholar]
- 30.Attasaranya S, Pais S, LeBlanc J, et al. Endoscopic ultrasound-guided fine needle aspiration and cyst fluid analysis for pancreatic cysts. JOP. 2007;8(5):553–63. [PubMed] [Google Scholar]
- 31.Belsley NA, Pitman MB, Lauwers GY, et al. Serous cystadenoma of the pancreas: Limitations and pitfalls of endoscopic ultrasound-guided fine-needle aspiration biopsy. Cancer. 2008;114(2):102–10. doi: 10.1002/cncr.23346. [DOI] [PubMed] [Google Scholar]
- 32.Shami VM, Sundaram V, Stelow EB, et al. The level of carcinoembryonic antigen and the presence of mucin as predictors of cystic pancreatic mucinous neoplasia. Pancreas. 2007;34(4):466–9. doi: 10.1097/mpa.0b013e318033fa12. [DOI] [PubMed] [Google Scholar]
- 33.Rhodes I, Humar A, Lum PA, et al. Computed tomographic and cytologic assessment of cystic pancreatic neoplasm: a difficult preoperative diagnosis. Can Assoc Radiol J. 1993;44:359–363. [PubMed] [Google Scholar]
- 34.Curry CA, Eng J, Horton KM, et al. CT of primary cystic pancreatic neoplasms: Can CT be used for patient triage and treatment? AJR Am J Roentgenol. 2000;175(1):99–103. doi: 10.2214/ajr.175.1.1750099. [DOI] [PubMed] [Google Scholar]
- 35.Centeno BA, Warshaw AL, Mayo-Smith W, et al. Cytologic diagnosis of pancreatic cystic lesions. A prospective study of 28 percutaneous aspirates. Acta Cytol. 1997;41(4):972–80. doi: 10.1159/000332775. [DOI] [PubMed] [Google Scholar]
- 36.Begg CB, Greenes RA. Assessment of diagnostic tests when disease verification is subject to selection bias. Biometrics. 1983;39(1):207–15. [PubMed] [Google Scholar]
- 37.Hikichi T, Irisawa A, Bhutani MS, et al. Endoscopic ultrasound-guided fine-needle aspiration of solid pancreatic masses with rapid on-site cytological evaluation by endosonographers without attendance of cytopathologists. J Gastroenterol. 2009;44(4):322–8. doi: 10.1007/s00535-009-0001-6. Epub 2009 Mar 10. [DOI] [PubMed] [Google Scholar]
- 38.Song TJ, Lee SS, Kim H, et al. Endoscopic Ultrasound-Guided Fine Needle Apsiration in Solid Pancreatic Tumors: A Prospective Randomized Comparison of 19-Guage and 22 Guage Aspiration Needles. Gastrointest Endosc. 2009;69(5):AB129. [Google Scholar]
- 39.van der Waaij LA, van Dullemen HM, Porte RJ. Cyst fluid analysis in the differential diagnosis of pancreatic cystic lesions: A pooled analysis. Gastrointest Endosc. 2005;62(3):383–9. doi: 10.1016/s0016-5107(05)01581-6. [DOI] [PubMed] [Google Scholar]
- 40.Ryu JK, Woo SM, Hwang JH, et al. Cyst fluid analysis for the differential diagnosis of pancreatic cysts. Diagn Cytopathol. 2004;31(2):100–5. doi: 10.1002/dc.20085. [DOI] [PubMed] [Google Scholar]
- 41.Khalid A, Zahid M, Finkelstein SD, et al. Pancreatic cyst fluid DNA analysis in evaluating pancreatic cysts: a report of the PANDA study. Gastrointest Endosc. 2009;69(6):1103–5. doi: 10.1016/j.gie.2008.07.033. [DOI] [PubMed] [Google Scholar]


