

Summary
The vast majority of mental illnesses can be conceptualized as developmental disorders of neural interactions within the connectome, or developmental miswiring. The recent maturation of pediatric in vivo brain imaging is bringing within reach the identification of clinically meaningful brain-based biomarkers of developmental disorders. Even more auspicious, is the ability to study the evolving connectome throughout life, beginning in utero, which promises to move the field from topological phenomenology to etiological nosology. Here, we scope advances in pediatric imaging of the brain connectome as the field faces the challenge of unraveling developmental miswiring. We highlight promises while also providing a pragmatic review of the many obstacles ahead that must be overcome to significantly impact public health.
Introduction
Nearly two-thirds of neuropsychiatric disorders manifest in the first two decades of life (Kessler et al., 2005). During this time discrete periods of susceptibility to mental illness occur. For example, different stages of early childhood are characterized by the emergence of disruptive, impulse control, anxiety and autism spectrum disorders, while adolescence and young adulthood are notable for the onset of mood, psychotic, and substance use disorders. As such, the vast majority of mental illnesses are conceptualized as neurodevelopmental disorders, rooted in disturbances of typical brain development. In other fields of medicine, understanding the biological roots of diseases has led to breakthroughs in treatment and prevention. For neuropsychiatry, despite the accumulation of knowledge over decades, this promise is yet to be realized (Kapur et al., 2012). Fortunately, recent methodological and neuroscientific advances suggest that the field is nearing an inflection point in the study of these complex disorders.
Theoretical models of neuropsychiatric illnesses have long implicated “developmental miswiring” – i.e., abnormal development of neural interactions in the connectome. Only recently, however, have pediatric brain imaging methods matured to allow delineating typical and atypical developmental phenomena in the human macroscale connectome in vivo (e.g., Collin and van den Heuvel, 2013; Craddock et al., 2013; Hagmann et al., 2012; Uddin et al., 2010). As a result, long-standing aspirations to attain clinically meaningful brain-based biomarkers of abnormal brain development are coming within reach. Perhaps most exciting is the potential to inform our etiologic understanding of neuropsychiatric illness using diffusion MRI and resting state functional MRI (R-fMRI) technologies that permit the study of the evolving connectome across all stages of development—from fetus to adulthood. These approaches promise to open an unprecedented window into the developing brain, well before the appearance of clinical signs or symptoms, which appear relatively late in the disease process. At the same time, the increasing popularity of longitudinal designs and augmentation of imaging datasets with rich phenotyping (e.g., clinical, cognitive, lifestyle, fitness), more comprehensive laboratory characterizations (e.g., pubertal hormones), and integration with genomics are promising to move the field beyond a topological phenomenology to an etiological nosology.
While promising, pediatric connectomics faces a number of unique obstacles, many of which require rethinking current models and practices, as well as a careful delineation of strategic goals for the field. Here, after distinguishing between a phenomenological and etiologic understanding of the developing connectome and its miswiring (Section 1), we provide a critical overview of the challenges related to connectomics MRI (Section 2). We then highlight a range of experimental and methodological innovations that may help to overcome these challenges, some of which are already being implemented. These encompass considerations about novel approaches aimed at examining increasingly younger populations including fetal MRI (Section 3), as well as new statistical and analytical approaches (Section 4). Given the large proportion of developmental connectomics studies that have employed R-fMRI, the present work focuses heavily on findings revealed by this technique. Nonetheless, the areas discussed are equally relevant for diffusion imaging.
SECTION 1: Developmental Miswiring: Emerging Models
Phenomenology
General Principles
The quantification of changes in brain function and structure over time, commonly referred to as trajectory analysis, is central to the characterization of developmental phenomena, and of how they are impacted by phenotypic differences (e.g., sex) and biological processes (e.g., puberty, gene expression) (Shaw et al., 2010). From the perspective of miswiring, trajectory analysis allows for the description of deviations in development related to pathological disturbances (e.g., disease, stressors); (see Figure 1). In particular, it differentiates between processes altering the timing of developmental phenomena and those altering their nature (i.e., the shape of a trajectory). For example, decelerations in the progression of typical changes are believed to index immaturity or delay, while accelerations may represent precocious development. The volumetric MRI literature has taken the lead in delineating neurodevelopmental timing abnormalities among neuropsychiatric conditions. For example, in ADHD, longitudinal volumetric and cortical thickness studies have consistently shown a pattern of delayed (i.e., immature) cortical development (e.g., Shaw et al., 2007). The connectomics literature is only beginning to take on the challenge of understanding normative developmental trajectories and the factors that interfere with those trajectories.
Figure 1. Miswired Developmental Trajectories.
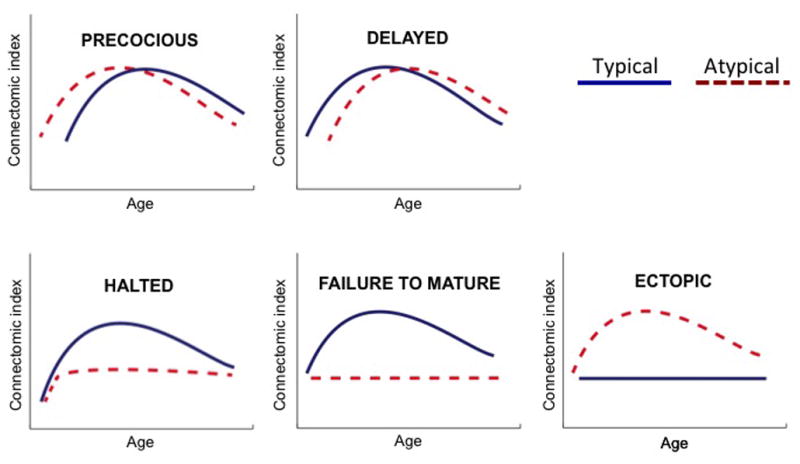
Different categories of abnormal developmental trajectories can be identified. Abnormalities in timing may reflect precocious (A) or delayed (immature; B) development with respect to typical development. Other scenarios may involve halted development (C; when development stops after initially following typical trajectories), failure to mature (D; when the maturation trajectory does not follow/attain the normative curve) or ectopic development (E; when developmental changes occur in atypical but not in typical development). Blue and red dashed lines: typical and atypical development, respectively.
Beside abnormalities in timing, scenarios in which the shape of a trajectory is changed may signal more profound developmental disturbances. Such alterations can entail the formation of ectopic (i.e., abnormally located) connectivity, a failure to form critical connections, or a halting of development (Figure 1). For any deviation in the timing or shape of a developmental trajectory, trajectory analyses extending to later development or adulthood can also provide insight into whether neurodevelopment will eventually “catch-up” or “normalize,” and if this change will be reflected in behavior. Related to normalization is “compensation” - when disturbances in one circuit can be functionally masked by compensatory changes in the development of another circuit.
Importantly, the implications of any abnormality in the developmental trajectory of an individual’s connectome can only be understood in terms of its relationship to behavior, in both the short- and the long-term. In this regard, analyses of developmental trajectories can be used to: 1) detect developmental disturbances which may signal risk or the onset of illness, 2) identify sensitive period(s) for intervention, 3) identify modifiable targets for intervention, 4) monitor the impact of environmental exposures and interventions on development, and 5) detect heterogeneity in current diagnostic categories to permit diagnoses that are more firmly rooted in the underlying neurobiology.
Given the high dimensionality of the connectome, it seems quite likely that multiple types of miswiring co-occur simultaneously in any given disorder. For example, initial evidence for Tourette’s disorder (Church et al., 2009) and autism (Di Martino et al., 2011) have suggested mixed developmental patterns, including both immature and ectopic connectivity. These are preliminary results that require confirmation from large longitudinal studies (see Section 2). While the number of connectomic studies focusing on a range of neurodevelopmental disorders has increased exponentially in the past 10 years (Castellanos et al., 2013; Dennis and Thompson, 2014; Fox and Greicius, 2010; Uddin et al., 2010), only a handful have explicitly investigated age-related effects (i.e., age by diagnostic group interactions; see Figure 2).
Figure 2. Age-Related Connectomics Studies in Selected Neurodevelopmental Disorders.
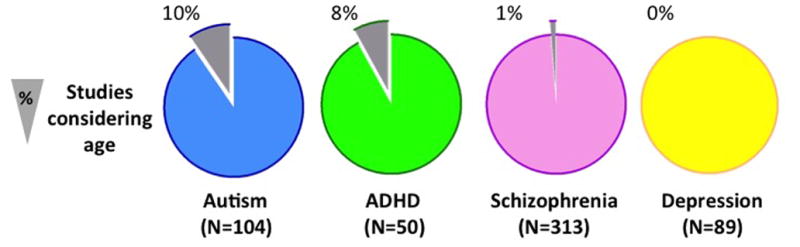
Among the most studied disorders in clinical connectomics (Craddock et al, 2013), we selected four examples of either early or later clinical onset in youth (Autism [blue]; ADHD [green]); schizophrenia [pink]; depression [yellow]). For each disorder, we counted the total number of connectomic empirical studies that included task-fMRI, R-fMRI and/or diffusion-based MRI. Amongst them, we then counted the studies examining age-related effects (excluding aging). As the pie charts show, few studies have addressed developmental effects. The largest proportion was in autism (10% of autism papers) and ADHD (8% of ADHD papers) followed by a negligible number in schizophrenia (1%) with no such studies in depression. Notably, none of the age-related studies identified used a longitudinal design. Our searches were conducted in July 2014 with PubMed combining the key words “connectivity” and the name of each of the above disorders.
Connectome-Specific Principles
A prerequisite to the study of developmental miswiring is the characterization of typical brain development. Still in its infancy, research on typically developing connectomics has already identified several fundamental organizing principles underlying the developing connectome (Collin and van den Heuvel, 2013; Hagmann et al., 2012; Menon, 2013; Power et al., 2010; Vogel et al., 2010). At the most general level, evidence suggests that the foundations of major structural pathways and functional systems within the connectome are in place prior to birth, and already possess key topological properties (e.g., small-worldness, community structure, hubness, rich-clubness). However, a burgeoning literature is drawing attention to a variety of age-related refinements in network architecture that are posited to optimize the integration of multimodal information and the segregation of local, specialized processing.
An important caveat is that the connectomics literature to date likely provides an underestimate of the magnitude and complexities of developmental phenomena. Although there are exceptions (e.g., Gao et al., 2014a), the vast majority of studies have not included the most active periods of brain development. These encompass the fetal period and the first two years of life, in which initial studies have already found more dramatic age-related changes (e.g., velocity, magnitude) than subsequently. Puberty is also known to substantially affect brain structure and function but is frequently overlooked in the connectomics literature. Additionally, as highlighted by recent efforts (Betzel et al., 2014; Hagmann et al., 2010), the complex relationship between functional and structural connectivity during development is only beginning to be explored. Below, we provide an abbreviated list of key phenomena in typical development, whose derailment may lead to neurodevelopmental miswiring.
From short- to long-range connectivity. Short-range connectivity predominates in infancy (Fransson et al., 2007; Gao et al., 2011), and gradually decreases during childhood and adolescence as long-range network connectivity becomes predominant in young adulthood (Dosenbach et al., 2010; Fair et al., 2009; Fair et al., 2007; Hagmann et al., 2010; Kelly et al., 2009; Supekar et al., 2009). Thus, it appears that brain maturation entails a shift from a local to a distributed network architecture. As discussed in Section 2, failure to account for head motion in the analysis of distance-based changes can exaggerate this developmental phenomenon. Indeed, the changes in short and long-range connectivity appear to be most prominent in the first two years of life (e.g., Gao et al., 2011; Yap et al., 2011), with more modest changes occurring later in development (Fair et al., 2012b; Satterthwaite et al., 2012).
Community structure changes. Graph theory is the study of large-scale systems or networks (see Figure 3) defined as collections of nodes (i.e., brain areas) joined in pairs by lines or edges (i.e., connections). Community detection is an important focus of graph-theoretical analyses of the developing connectome, allowing the identification of subsets of nodes (brain areas) in the connectome graph that are more densely connected internally than with the remainder of the graph; these are taken to reflect networks (Power et al., 2011). Questions related to network segregation (i.e., how many communities/networks are in a brain?), integration (i.e., how are communities/networks connected?), and influence (i.e., which nodes or edges are more relevant for connecting networks?) are being increasingly investigated in both typical and atypical neurodevelopment (Sporns, 2013). Thus far, this line of work has suggested that while fundamental community structure properties are present across the lifespan, their composition changes during early development. The degree of integration and segregation between networks also appears to change with respect to age. Specifically, in infancy (Fransson et al., 2011), and potentially prenatally (Thomason et al., 2014), communities tend to include anatomically proximal regions; with age, more distributed networks emerge (Fair et al., 2007). Once again, we emphasize that findings may be obscured if one does not properly account for head motion (e.g., artifactually decreased network segregation; Satterthwaite et al., 2012).
Maximizing the Cost-Efficiency of Information Transfer. The ability to assess the efficiency of information flow within the connectome is another appealing feature of graph-theoretical approaches. Efficiency can be assessed both globally (i.e., inverse of the average shortest path length in the connectome graph) and locally (i.e., inverse of the average shortest path connecting all neighbors of a vertex). Consistent with the notion that the brain’s foundational architecture is present early in life, recent studies have found that the global efficiency of the connectome is relatively constant across the lifespan. In contrast, local efficiency has been found to increase across childhood (Cao et al., 2014; Dennis et al., 2013a; Supekar et al., 2009; Wu et al., 2013). In considering network features responsible for maximizing topographical efficiency, researchers have emphasized hierarchical aspects of the connectome’s community structure, in particular the role of connectivity hubs (i.e., the most “connected” nodes in the connectome graph; Bullmore and Sporns, 2012). While structural hubs are highly determined in early development, functional hubs appear to undergo some reorganization during the course of development. In the infant brain, hubs are located in primary sensory and motor cortex, whereas by young adulthood hub primacy shifts to posterior cingulate, insula and other heteromodal cortex (Fransson et al., 2011). Intriguingly, recent work has noted that hubs tend to connect to one another to form “rich clubs.” Rich club graph organization describes a system where highly connected nodes tend to connect more strongly with each other than would be expected by chance. This type of organization of the connectome serves to further optimize the integration of information across the connectome and thus network efficiency (van den Heuvel and Sporns, 2011). Initial investigations using structural (Dennis et al., 2013b) and functional (Ball et al., 2014; Grayson et al., 2014) connectivity have found that rich club coefficients increase from childhood to adulthood, as some level of topographical reorganization also occurs (Grayson et al., 2014).
From subcortico-cortical to cortico-cortical connectivity. Occurring in parallel with the network reorganization described above are developmental changes in subcortical circuitry (Fair et al., 2010; Greene et al., 2014; Supekar et al., 2009). Specifically, subcortico-cortical connections tend to be strong in childhood, particularly with other phylogenetically primitive areas (e.g., limbic and paralimbic cortex). With age, subcortico-cortical connectivity decreases as cortico-cortical connectivity strengthens, particularly within association cortex (Supekar et al., 2009).
Interhemispheric Connectivity. The integration of information between the cerebral hemispheres is another developmentally sensitive feature of the connectome. Not surprisingly, interhemispheric interaction has long been a focus of developmental models for learning and cognition, as well as genetic and neurodevelopmental disorders (Paul et al., 2007). Histologic, diffusion and morphometric studies have consistently highlighted developmental changes in the micro and macrostructure of the corpus callosum, which is the primary conduit of interhemispheric information transfer. Notably, interhemispheric structural connectivity exhibit marked sex differences during development (Ingalhalikar et al., 2014). Complementing this body of literature, a recent resting state fMRI (R-fMRI) study revealed that age-related variations in homotopic connectivity (i.e., connections between geometrically corresponding interhemispheric brain areas) are regionally specific. That is, homotopy appears to increase within sensory processing and motor control areas, but to decrease in higher-order cognitive regions (Zuo et al., 2010). These changes in interaction are thought to coincide with developmental increases in hemispheric specialization – a process by which each hemisphere becomes uniquely optimized to support a specific subset of functions (e.g., language in the left hemisphere). Of note, while models of interhemispheric interaction tend to focus primarily on the corpus callosum, subcallosal commissures and subcortical structures are also known to facilitate communication (Uddin et al., 2008) and should also be considered in models of developmental miswiring.
Figure 3. Connectome graph.

This sketch depicts a graph whereby nodes (solid black circles) are connected by edges (solid lines); a highly connected node is illustrated as solid blue circle. Community detection algorithms identify subsets of nodes that are more densely (colored clouds) connected internally than with the remainder of the graph - i.e., modules. Figure modified from Fair et al., 2012; PNAS.
Etiology
While phenomenology emphasizes detailed, systematic characterization of typical and atypical developmental processes, etiology focuses on the identification of causative agents that lead to connectome miswiring. Etiologies of miswiring can be endogenous (i.e., nature) or exogenous (i.e., environment). Successful delineation of the etiology of connectomic miswiring is essential to efforts focused on prevention and can lead to novel targets for therapeutic interventions. Below, we outline key events and factors thought to have an etiological role in neurodevelopmental disorders.
Genetics. The sequencing of the human genome (McPherson et al., 2001) and, more recently, the availability of relatively rapid and inexpensive sequencing have created a number of opportunities for identifying genetic determinants of developmental miswiring. Importantly, most psychiatric disorders are the result of multiple, complex interactions between genes as well as between genes and the environment. This means that it is likely to be rare that any single developmental process or disorder is controlled by a single gene or genetic event. The heterogeneity of neuropsychiatric disorders serves to further complicate the challenge at hand, and necessitates phenotypic characterizations beyond simple categorical labels (see the Research Domain Criteria Project for an example). Fortunately, the models for interrogating genetic underpinnings of behavioral and neurobiological phenomena are advancing. Candidate gene studies, which tend to be limited in scope (due to requirements for a priori knowledge) and difficult to replicate, have given way to hypothesis-free strategies using exome and whole genome scanning. These approaches have proven to be more successful in identifying risk alleles (e.g., copy number variants) for specific events and/or conditions – most of which turn out to be rare (<1%), with large effects rather than more common variants of small effect (El-Fishawy and State, 2010). Initial efforts attempting to link risk variants to connectome phenotypes are emerging. For example, recent work examined a common autism risk variant in the Met Receptor Tyrosine Kinase (MET). Differential patterns of functional and structural connectivity in the default network as well as task activation were found as a function of MET genotype (risk, non-risk, intermediate) (Rudie et al., 2012). Intriguingly, for all imaging measures, the effects of this risk allele appeared to be greater in individuals with ASD than typical comparisons. Central to the success of this study, and future efforts with risk variants, is the generation of very large, well-phenotyped samples, from which participants representing different genotypes can be selected for comprehensive imaging. Of note, since epigenetics (heritable and non-heritable changes in gene function that occur without altering the sequence) may also play a role in phenotype development, both epigenetic and genetic strategies may be necessary to fully appreciate the genetic substrate or contribution to imaging findings.
Prenatal. Susceptibility for connectome miswiring may, in part, be conferred in utero. A recent review suggests that while the first trimester is characterized by neuron production, migration and early synaptogenesis, the mid- to late-second trimester marks the genesis of the macroscale connectome (Collin et al., 2014). It is during this time that thalamo-cortical, cortico-cortical, callosal-cortical and cortico-spinal connections begin to form (Ghosh and Shatz, 1993). This period is marked by vulnerability to injury from numerous sources (e.g., oxygen deprivation, chemical exposure, infection, stress; Gluckman and Hanson, 2004). Interference with cell maturation, function, or survival may account for untoward shifts in programming of connections in the brain. Consistent with this notion, lasting neurological consequences of physical and mental adversity during pregnancy are now well-documented into the second and third decades of life. For example, maternal cortisol levels predict offspring amygdala volume (e.g., Buss et al., 2012), and maternal alcohol use relates to offspring white matter abnormalities (Wozniak and Muetzel, 2011). Additionally, a recent connectomics study of neonates with a history of in utero growth restriction (an outcome of placental insufficiency) demonstrated decreases in global and local efficiency, which predicted deficits in subsequent infant neurobehavioral progress (Batalle et al., 2012). Thus, early disturbances can have substantial, lasting impact. As will be discussed later, emerging fetal imaging methodologies will provide an unprecedented window into in utero brain organization and the factors that impact it.
Perinatal. Over the past two decades, the prevalence of preterm births has increased in response to an array of factors, including in vitro fertilization, increasing parental age of conception, and earlier detection of fetal distress. Preterm neonates requiring intensive care following birth have increased risks for later life cognitive and learning impairments (3–5 times higher than the general population; Karmel et al., 2010) and signs of neurological damage (e.g., diffuse white matter injury, reduced grey matter volume, intraventricular hemorrhage, periventricular leukomalacia). Initial connectomics studies in preterm infants have highlighted disruptions in thalamocortical connections implicated in cortical organization (Groppo et al., 2014; Smyser et al., 2012). Work focused on the visual system has highlighted the vulnerability of the developing brain in the period after 30 weeks gestational age (Groppo et al., 2014). Moving forward, a key challenge for the field will be to differentiate primary and secondary causes in the complex sequelae that follow preterm delivery.
-
Early life stress/trauma. Animal and human research, including volumetric imaging studies, have demonstrated that organisms are particularly vulnerable to stressful experiences early in life (e.g., Graham et al., 2013). Although few studies have examined the impact of early life stress or trauma on the connectome, emerging work suggests that long-term alterations in the circuitry of the amygdala constitute one enduring effect of early life stress. For example, Gee et al. (2013) used a face emotion perception fMRI task to demonstrate a precocious pattern of task-related amygdala connectivity with medial prefrontal cortex in previously institutionalized, maternally deprived children relative to typical comparisons. This effect was mediated by higher cortisol levels and associated with amelioration of separation anxiety symptoms, suggesting adaptive circuit changes in response to early stressors (Gee et al., 2013). Together these results dovetail with extensive work in animal models demonstrating that adverse experiences in early development accelerate the engagement of amygdala-prefrontal circuitry. The R-fMRI literature has also highlighted enduring changes in amygdala-prefrontal circuitry in response to trauma/early life stress (Burghy et al., 2012; Herringa et al., 2013). However, the direction of the effects observed differs from that obtained with task fMRI, likely reflecting contextual influences, and/or methodological differences between studies.
Connectomic studies are beginning to differentiate vulnerabilities selective to specific forms of stress and trauma. For example, in a study of females with chronic posttraumatic stress disorder precipitated by early life trauma, posterior cingulate cortex/precuneus functional connectivity with the right amygdala and hippocampus/parahippocampal gyrus was decreased (Bluhm et al., 2009). In a study that focused on inhibitory control in individuals without current psychiatric diagnoses, patterns of connectivity among regions supporting motor inhibition were related to the reported severity of early-life maltreatment (Elton et al., 2014). Intriguingly, this relationship differed between males and females. This led the authors to speculate that sex-related differences in later-life consequences of childhood maltreatment (e.g., greater depression/anxiety in females vs. aggression, impulsivity and drug abuse in males) may be related to the differential impact of early-life maltreatment on the connectome. Future work examining the impact of stress and trauma throughout the lifespan will be crucial to the delineation of sensitive periods and differential outcomes. Consideration of various factors contributing to resilience (e.g., genetics, epigenetics) will be crucial for explaining inter-individual variations.
-
Puberty. Although commonly described in terms of physical changes and reproductive maturation, puberty also demarcates a unique stage of brain maturation. Surges in sex hormones (e.g., estrogen, testosterone, and gonadotropin releasing hormone) affect brain organization (Sisk and Zehr, 2005) and enhance neural sexual dimorphism (Blakemore et al., 2010). One prominent theory, termed the organizational-activational hypothesis, posits that while sex-steroids shape brain circuitry during the prenatal period, it is not until puberty that the brain “pathways” they shape are activated. During this time, surges in sex hormones are believed to activate these pathways and amplify sexual dimorphism.
Consistent with this notion, sex differences in connectome structure are detectable during the first two years of life (Gao et al., 2014b) and persist through childhood and adolescence (Satterthwaite et al., 2014b). Additionally, the imaging literature to date has confirmed that changes observed during adolescence are more fine-grained specialization, as the gross network morphology nears adult levels prior to the onset of puberty (Caviness et al., 1996). For example, in gray matter, synaptic pruning and cortical thinning are observed in prefrontal cortex (Gogtay et al., 2004; Huttenlocher and Dabholkar, 1997; Petanjek et al., 2011) and subcortical regions (Raznahan et al., 2014). At the same time, white matter structural indices of directional diffusion increase throughout major association and projection tracts (Dennis et al., 2013b; Lebel et al., 2008; Simmonds et al., 2014). These refinements in brain structure are thought to maximize integration of information processing within the connectome during puberty.
From the perspective of functional connectomics, gross functional network community structure and interaction properties (e.g., hub hierarchy) are thought to be in place prior to adolescence (Hwang et al., 2013). Once again, adolescence appears to be characterized by critical refinements in support of the integration of information processing and coordination between regions. From a systems neuroscience perspective, the balance of prefrontal and limbic influences shifts. While prefrontal cortex continues to undergo pruning and cortical thinning throughout adolescence, its engagement in cognitive control nears adult levels early in adolescence (Ordaz et al., 2013). In contrast, the striatal systems supporting reward processing undergo more substantial maturation throughout this period, which is characterized by greater motivational processing and ventral striatal activation relative to adults (Galvan et al., 2006; Geier et al., 2010; Padmanabhan et al., 2011; Padmanabhan and Luna, 2013; Raznahan et al., 2014; Sowell et al., 1999; Spear, 2000; Wahlstrom et al., 2010).
Recent imaging studies have emphasized the value of including physical and/or hormonal assessments during puberty (Bramen et al., 2011; Satterthwaite et al., 2014b). From a clinical neuroscience perspective, such assessments are particularly valuable, as variations in pubertal processes are thought to underlie inter-individual and sex differences in vulnerabilities to psychopathology (e.g., schizophrenia, mood disorders, eating disorders, suicide, and substance abuse; Paus et al., 2008). As such, greater attention to the impact of pubertal processes on connectome development is critical for both phenomenological and etiologic understandings of miswiring in the connectome. Complementary measurements with other modalities such as electroencephalography should also be considered (Uhlhaas et al., 2009).
-
Substance abuse. An incipient literature is beginning to address the effects of drugs of abuse on connectomics in the context of development. A central challenge in this pursuit is the determination of whether variations in the connectome associated with substance use are the result of exposure to drugs or are trait markers of behavioral tendencies towards substance use. In this regard, prenatal exposure studies are the least equivocal. For example, initial work has examined the impact of prenatal cocaine exposure on default network properties in adolescence, finding greater within-network connectivity at rest and decreased deactivation during a working memory task with emotional distractors (Li et al., 2011). Studies examining the impact of prenatal alcohol exposure also suggest long-term effects on the connectome. Initial work has demonstrated delays in the progression of white matter development in children and adolescents with Fetal Alcohol Spectrum Disorders, which appear to be linked to behavioral and cognitive deficits (Treit et al., 2013).
Determining the impact of substance exposures later in development is challenging. An illustrative example comes the cannabis literature. Initial functional connectomics studies of chronic cannabis use in adolescence have already furnished a number of findings (Behan et al., 2014; Orr et al., 2013), which are particularly intriguing given recent secular trends in the legal status of cannabis in many western societies. However, the reliance of these efforts on retrospective designs precludes determinations of whether abnormalities in brain structure and function were pre-existing deficits or sequelae of early substance use (for review see: Jacobus and Tapert, 2014). Large-scale prospective population-based approaches with deep-phenotyping, such as the Generation R Study (Jaddoe et al., 2012), will have the opportunity to address this issue in years to come. For example, the IMAGEN study has demonstrated discriminant as well as predictive identification of future binge drinking among adolescents (Whelan et al., 2014). Another fruitful strategy is to enroll at risk youth stratified by family history of substance use prior to exposure (e.g., Squeglia et al., 2014).
Given the many possible etiologies of developmental miswiring, the task of obtaining all the necessary variables to delineate causal relationships is considerable. Complicating this challenge is the growing list of new potential etiologies for miswiring (e.g., immune dysregulation and metabolic abnormalities; Gabbay et al., 2009; Gabbay et al., 2010) that few imaging datasets have taken into account, to date. These points are not made to be discouraging, but rather to emphasize the importance of comprehensive, careful phenotyping and knowledge of emerging clinical literatures.
SECTION 2: Challenges and Solutions
Having presented the phenomena and potential factors related to miswiring, we now turn to challenges in study design, data collection and preprocessing relevant to developmental miswiring. For each topic, challenges and potential solutions are presented.
Technical Traps in Image Acquisition and Processing
Movement
It could be argued that, for imaging studies of middle childhood, in-scanner head motion is the most problematic source of artifact. This is largely due to the hyperkinetic tendencies of children, which can introduce systematic biases; similar challenges arise in neurodevelopmental disorders characterized by hyperkinesia (e.g., ADHD, Tourette’s or bipolar disorders). While this phenomenon has long been known, only recently has the field become acutely aware that traditional approaches to movement correction are insufficient. Specifically, in a series of R-fMRI studies from three independent investigators, head “micro-movements” as small as 0.2mm were shown to systematically impact observed patterns of functional connectivity (Power et al., 2012; Satterthwaite et al., 2012; Van Dijk et al., 2012).
These small amounts of head displacement have become particularly alarming in the R-fMRI childhood development literature because they are usually associated with decreases in long-range connectivity and increases in short-range connectivity.1 This particular pattern is identical to the pattern associated with brain maturation. In response to this challenge, two studies have re-examined developmental changes in functional connectome measures. They have found that that while head motion did inflate previous reports of distance- and age- dependent connectivity differences related to age, the developmental phenomena remained after correcting for motion (Fair et al., 2012b; Satterthwaite et al., 2012). They also noted that the effects of motion artifact on patterns of brain development are heterogeneous (Satterthwaite et al., 2013). For example, while motion inflates estimates of distance-dependent changes in connectivity with age, it obscures evidence of age-related increases in functional network segregation (Fair et al., 2007; Stevens et al., 2009).
Since the initial papers detailed the effects of “micro-movements” on R-fMRI data, investigators have introduced a variety of post-processing procedures to mitigate motion artifact. These include censoring corrupted volumes “scrubbing” (Power et al., 2012, 2013), spike regression (Satterthwaite et al., 2013), inclusion of higher-dimensional motion parameters (Satterthwaite et al., 2013; Yan et al., 2013), single-subject ICA denoising (ICA-FIX) (Griffanti et al., 2014; Salimi-Khorshidi et al., 2014), wavelet despiking (Patel et al., 2014), and group-level corrections (Satterthwaite et al., 2013; Van Dijk et al., 2012; Yan et al., 2013). While all of these techniques have been shown to mitigate the influence of motion-related artifacts on R-fMRI connectivity, two primary concerns remain. First artifact removal may be incomplete, and second neurobiologically relevant signals may also be removed. For example, two recent studies (Yan et al., 2013; Zeng et al., 2014) suggest that the phenotypic propensity to exhibit in-scanner motion is associated with distinct profiles of connectivity, even in the absence of actual in-scanner motion. Such work highlights the challenges of separating signal from noise in the absence of ground truth. It is worth noting that while post-processing corrections are necessary to salvage the large number of existing datasets, recent advances in MRI acquisition (e.g., multi-echo pulse sequences and prospective motion-correction strategies) should reduce the impact of motion artifact henceforth (Kundu et al., 2013).
Finally, it is important to highlight that while R-fMRI has received the most systematic attention to date, task-based functional MRI as well as structural imaging modalities (e.g., morphometric, diffusion tractography) are also affected by micro-movements (Siegel et al., 2014; Yendiki et al., 2013). Systematic examinations of the effects of micro-movements on task-related fMRI and structural imaging measures are overdue.
Registration
Image registration (a.k.a. spatial normalization) transforms brain images into a common stereotaxic space with the goal of improving the correspondence of brain regions across individuals; this in turn aligns their connectome graphs. Although significant effort has been directed to optimizing different registration algorithms, some degree of misregistration will remain. This becomes more problematic in pediatric studies due to systematic age-related changes in the contrast between white and grey matter, as well as changes in the size and location of anatomical landmarks (Sanchez et al., 2012). This is particularly true for children younger than six (Altaye et al., 2008; Muzik et al., 2000) - the age at which the volume of the developing brain reaches 95% of that observed in adults (Caviness et al., 1996). As such, usage of commonly distributed adult templates in pediatric studies represents a potentially significant source of error in brain developmental studies.
To overcome these challenges, several groups have created pediatric templates. Most of these templates, however, are based on relatively broad age ranges; 32 age-specific templates from ages 4–24 years, created with 6-month increments, represent the lone exception (reviewed in Sanchez et al., 2012). Additional strategies need to be employed to incorporate the use of age-specific templates in studies comprising different age groups. For example, one multistage registration algorithm first normalizes individual images to unbiased age-specific templates constructed to improve registration quality at different age-bands, then, in a subsequent registration, transforms them to a unified template (Fonov et al., 2011). An alternative or complementary approach is to estimate region-specific misalignments, and then compensate for this error by smoothing the data. In this regard, one distinct advantage of graph theoretic approaches is that graph invariants (e.g., degree distribution, modularity, efficiency) can be compared across individual-level connectomes without the need for registration, as long as the number of graph nodes and edges are controlled for.
Atlases
Defining the size and location of the brain units to be used as nodes in connectome graphs is a crucial step. Depending on the analysis at hand, nodes can be defined using image voxels (Zuo et al., 2012), anatomical parcellation (Desikan et al., 2006; Tzourio-Mazoyer et al., 2002), animal model or postmortem cyto- and myeloarchitectonic parcellations (Eickhoff et al., 2005; Lancaster et al., 2000; Miranda-Dominguez et al., 2014), regions-of-interest derived from meta-analyses of task activation studies (Dosenbach et al., 2007), or parcels derived from data-driven approaches subdividing the brain into homogenous areas based upon functional or structural connectivity (Beckmann et al., 2009; Bellec et al., 2010; Craddock et al., 2012). Regardless of node definition, care must be taken when comparing connectomes between or across early age groups, as nodes (even voxels) may correspond to substantially different brain units across developmental stages. For example, commonly used meta-analytic and anatomical atlases are derived from adults; their representational accuracy for young brains has yet to be fully investigated. Based on what is known about development-related variation in the brain’s sulcal patterns, functional regions, and microstructure, how well such atlases fit younger brains will likely vary with age. Localization issues could be resolved using data-driven approaches to define age-specific brain parcellations. Stability analyses (e.g., using bootstrap analyses of stable clusters (BASC); Bellec et al., 2010) can evaluate the impact of development on region location and size. Connectomes based on age-specific nodes will not be comparable across ages unless a graph alignment can be performed (with the exception of their graph invariants, as indicated in the prior section). Recent calls for individual-specific parcellations would face the same challenges in graph alignment (Blumensath et al., 2013).
Nuisance Physiologic Signals
Since the origins of fMRI, the potential for physiologic signals to introduce artifactual findings into analyses have been a central focus (Birn, 2012). Cardiac and respiratory signals have received particular attention, though they are not regularly controlled in analyses. From a developmental perspective, cardiac and respiratory signals may be particularly problematic, as normative rates differ by age. For example, a typical heart rate is between 100–160 beats per minute in an infant < 1, 70–120 in children 6–12 years-old and 50–100 in individuals >12; this is accompanied by profound age-related differences in heart rate variability. For respiration, a typical rate is 30–60 breaths per minute for infants < 1, 18–30 for children 6–12, and 12–16 in individuals > 12. While direct measurement and correction for these signals is ideal, logistical challenges tend to arise during data collection, particularly in younger children. Fortunately, the field is moving towards the development of data-driven corrections (e.g., CORSICA (Perlbarg et al., 2007), PESTICA (Lowe et al., 2008), ICA-FIX (Griffanti et al., 2014; Salimi-Khorshidi et al., 2014)), which should mitigate concerns about the confounding influence of physiologic signals across development. However, we know of no systematic studies on this topic.
Experimental Pitfalls
Study Design
Pediatric connectomics delineating developmental trajectories and detecting biomarkers have employed an array of designs, which can be grouped into two broad categories: cross-sectional and longitudinal. Both have advantages and limitations, as itemized in Table 1. In general, cross-sectional designs are faster, less costly, and often include a broader range of measures, as they do not carry the burden of repeated assessments over time. However, data simulations have compellingly illustrated that cross-sectional designs are insufficient to accurately render developmental trajectories (Kraemer et al., 2000). Kraemer and colleagues argue that investigators should never interpret “differences between time-group means” from cross-sectional data as increases or decreases, nor as changes over time. Instead, cross-sectional data should be reserved for inference about differences between age-groups and used to generate hypotheses about developmental trajectories. This restriction of cross-sectional research is due in part to the inability to equate age-groups on all potentially relevant factors (e.g., IQ, socioeconomic variables). For all of these reasons, longitudinal designs, following the same individuals across time, are undeniably superior in the inferences permitted.
Table 1.
Types of study designs*
| Study Type | Uses and advantages | Limitations |
|---|---|---|
| Cross-sectional | ||
| Case-control | Relatively inexpensive; descriptive; can define prevalence; can identify associations | Cannot support causal inferences; almost never appropriate for inferring developmental trajectories |
| Twins | Principal method to quantify proportion of phenotypic variance accounted for by genetic, shared, and unique environmental factors | Recruitment challenge; heritability is property of sample/cohort; developmental risks of twinship |
| Multigenerational extended pedigrees | Alternative approach to quantify genetic and environmental influences; within-family comparisons obviate racial/ethnic stratification | Age and cohort effects are confounded |
| Trios | Workhorse design for attempting to identify genetic common-variants; “virtual” controls composed of non- transmitted genetic markers | Common-variants largely excluded for most genetic syndromes |
| Affected siblings | Alternate design to identify genetic factors | Common-variants largely excluded for most genetic syndromes |
| Unaffected siblings | Identifies genetic endophenotypes based on 50% shared genes among full siblings; avoids potential confounders of treatment and illness | Cannot definitively differentiate genetic from shared environmental effects |
| Unaffected offspring of high risk parents | Variant of endophenotype approach; avoids confounds of illness and treatment | Requires larger samples |
| Rare variants | Can identify genetic variations with major effects even in a single small family | Needs extremely large samples or consanguinity; consanguinity is effective for recessive genes; biological significance of rare variants is often unclear |
| Cross-sectional embedded in longitudinal | Leverages previously collected, prospective data to minimize recruitment and retrospective bias; used to obtain imaging or genetic analyses in previously defined samples | Post-hoc nature of study limits baseline data to those which were originally collected; selective attrition a risk |
| Longitudinal | ||
| Retrospective longitudinal Single cohort longitudinal | Accelerates data collection Permits delineation of trajectories; permits inferences of causality; provides disorder incidence | Retrospective recall often biased Expensive; can require lengthy intervals; validity threatened by systematic attrition; cohort effects can limit generalizability |
| Unstructured multi-cohort prospective | Most common form of blended cross- sectional/longitudinal study; allows for shorter follow-up interval and opportunistic recruitment; allows variation across and within individuals to be quantified | Lack of uniformity in sampling decreases accuracy of developmental trajectories |
| Structured multi-cohort prospective | Permits testing for and accounting for age or cohort effects; allows for the most accurate estimation of trajectories | Since each individual is only sampled for a brief period, relative to entire study period, cohort or age effects can accumulate gradually, and be difficult to discern |
Extracted from (Kraemer et al., 2000; Levin, 2006a, b, c; Thompson et al., 2011)
As the field works to implement longitudinal studies, it is important to consider key potential pitfalls (Thompson et al., 2011). For example, population cohort effects can compromise the interpretability of results. A cohort is defined as “the total population of individuals entering a specified environment at the same point in time” (Thompson et al., 2011; p. 895). Pragmatically, cohorts are commonly referenced to birth year, and individuals born within a five-year period are generally considered to be in the same cohort. Changes in nutrition, policy, or the law, among numerous other factors, can differentiate results from distinct cohorts. Again using marijuana as an example, the move towards decriminalization or outright legalization of the substance in certain states in the US will likely produce cohort effects. Cohorts prior to legalization will be limited to those willing to chance illicit activity; new cohorts will include less risky individuals as well, thereby changing the profile of marijuana users within a cohort. Alternatively, cohorts can be defined by factors such as developmental milestones, or the age of illness onset. Regardless of the rigor applied to define cohorts, one cannot assume that all individuals within a defined cohort will exhibit parallel trajectories. Factors such as environmental exposures (e.g., catastrophic events, trauma, familial and academic stressors) and genetic predispositions can easily produce non-parallel trajectories within a cohort. These potential confounds can be overlooked by simple averaging, and thus require more careful consideration of potential within-cohort variation during both the design and analytic phases of a study.
When balancing the various pragmatic factors (e.g., study duration, funding) and potential confounds, an alternative is to employ a blended cross-sectional/longitudinal design, referred to as a structured, multicohort design (Thompson et al., 2011). In this design the developmental period of interest (e.g., ages 6–17) is sampled using a series of evenly spaced cohorts that overlap in age and are followed for relatively brief periods (e.g., a series of cohorts that differ in birth year by 12 months are simultaneously followed for 3 consecutive years). The blended cross-sectional/longitudinal design addresses shortcomings inherent in either individual method; it is therefore increasingly recommended. One means of accelerating the pace of longitudinal study construction is to identify existing cross-sectional cohorts of interest and add longitudinal follow-ups. Researchers can add follow-up time-points to existing cross-sectional imaging studies (e.g., NKI-Rockland Sample - Nooner et al., 2012; the Philadelphia Neurodevelopmental Cohort - Satterthwaite et al., 2014a) or imaging-based follow-ups to established cohorts that are well-characterized but did not initially include brain imaging (e.g., a 33-year ADHD follow-up sample; Proal et al., 2011) or the UK Biobank Initiative (Petersen et al., 2013).
One final consideration that applies to both cross-sectional and longitudinal efforts is the need to prepare the field for brain genomics. The recent Human Connectome Project initiative (Van Essen et al., 2012) has brought twin study designs to central focus in the imaging community. Undoubtedly, twin studies are useful tools for exploration of the contributions of genes and environment to normal and pathologic development. In the structural imaging literature, they have established the high heritability of gray matter cortical thickness and surface area. Likewise, an initial twin study has suggested the heritability of network efficiency (Fornito et al., 2011). However, twin studies are not the only tool available for delineating genetic contributions to the connectome, and are not without limitations. Pedigree studies have been employed to establish the heritability of default network connectivity (Glahn et al., 2010). As highlighted earlier in our section on genetics, studies have begun to explore the potential utility of designs focusing on the identification of connectomic phenotypes for rare genetic variants; these variants may be among the most promising of design advances in the field of genetics (Chow et al., 2012). For any of these designs, we note that brain-genetics relationships can vary with age, because genes are differentially expressed in different tissues and at different developmental ages (Tebbenkamp et al., 2014). These factors introduce confounds that make interpretation difficult.
Sampling Strategy
Similar to other areas of neuroscience, a key challenge to the successful delineation of etiologies of connectome miswiring is the generation of representative data. With few exceptions (e.g., Philadelphia Neurodevelopmental Cohort; Satterthwaite et al., 2014a), the vast majority of brain imaging studies to date has relied on opportunistic sampling strategies to build datasets. Such approaches are fraught with potential biases that compromise the representativeness of the data collected and thus the ability to replicate or generalize findings to the community. As connectomics moves into the era of Big Data, voices in the emerging field of population neuroscience (Falk et al., 2013) are emphasizing that although large sample size is important (see Table 1 for list of large-scale pediatrics connectomics data resources), it is not enough; samples must be representative. Fortunately, the fields of demography, epidemiology and survey research can guide the imaging community in selecting sampling strategies that can reduce bias, increase statistical power and improve causal inference. Particular focus must be placed on identifying social and environmental variables that can moderate brain-behavior relationships. One strategy that may be particularly valuable at the present time is the identification of existing epidemiologic cohorts from which imaging subsamples could be rapidly selected.
SECTION 3: New windows into the developing brain
Below, we highlight key advances in imaging that are rapidly defining the next generation of pediatric imaging studies, with a particular focus on the connectome. If successful, these advances will enable us to trace typical and pathologic developmental processes from the fetus to adulthood.
Natural Sleep Imaging
Collecting MRI data during natural sleep represents a significant advance for early postnatal examinations of the developing brain (e.g., newborns, infants, toddlers, preschoolers). Sleep MRI bypasses requirements for compliance and remaining still in the scanner, which are practically insurmountable for children under age five. A growing literature is demonstrating the feasibility of imaging infants and young children during natural sleep without the need for medical sedation, avoiding unnecessary risks to participants.
Initial sleep fMRI efforts focused primarily on patterns of activation produced by passive auditory and receptive language paradigms (e.g., Redcay et al., 2007). However, the emergence of intrinsic functional connectivity approaches has increased the scope of examination to include the broader connectome. Initial studies in infants and toddlers have revealed structural and functional connectivity patterns similar to those observed in awake, older children (e.g., Fransson et al., 2009; Gao et al., 2013). The success of these efforts has raised hopes that natural sleep fMRI could be instrumental in tracking maturation of the developing connectome, as well as in detecting and characterizing early miswiring. Not surprisingly, sleep fMRI is rapidly finding its way into clinical studies focused on populations at risk or with early onsets of illness (e.g., low birth weight populations, intellectual and developmental delays, language disorders, autism).
Yet a number of challenges and open questions remain. In particular, similarities between the awake and sleeping connectomes cannot be assumed to infer equivalence. In adult sleep staging studies, despite overall similarities, state-related differences between wakefulness and non-REM sleep are consistently observed (e.g., Boly et al., 2012; Horovitz et al., 2009; Larson-Prior et al., 2011; Spoormaker et al., 2012). These findings parallel the sleep-related cortical ‘breakdown’ described in the EEG literature: as sleep deepens, cortical intrinsic functional connectivity decreases (Massimini et al., 2005). The strongest differences are observed between extremes (i.e., wakefulness vs. sleep) rather than among sleep stages. To date, studies of natural sleep in young children have not quantified the impact of sleep vs. wakefulness on the functional connectome. As such, it is unclear how well sleeping and awake resting fMRI data can be used to bridge the divide between samples that span early life, childhood, and adulthood (when wakeful study is more practical). This is particularly relevant in the context of longitudinal studies. Future efforts aimed at systematically mapping the stability between sleep and wakefulness for functional connectome measures will help in study design and interpretation.
Fetal MRI
Fetal MRI in utero offers a novel means to capture broad properties of the developing connectome. Studies are just beginning, but initial results indicate that MRI methods for evaluating connectivity in utero are robust, despite significant challenges (e.g., extreme movement, small volume, encasement in maternal compartment).
Pioneering fetal DTI and R-fMRI studies performed in utero have begun to demarcate stages of macro-scale brain connectivity development at the beginning of human life. The first in utero tractography study of fetal white matter showed white matter tracts following a hierarchical developmental pattern, with highest fractional anisotropy in the splenium, followed by the genu, and then the internal capsule (Kasprian et al., 2008). Complementary R-fMRI studies of typically developing fetuses scanned in utero demonstrate that older gestational ages are characterized by stronger long-range and homotopic connectivity (Thomason et al., 2014; Thomason et al., 2013). They also have verified the presence of proto-visual, motor, and default mode networks in the last gestational trimester (Schopf et al., 2012).
Progress in human fetal in utero DTI and R-fMRI research has had to overcome severe technical hurdles (e.g., Jiang et al., 2009; Seshamani et al., 2014) but can still suffer extreme data loss due to motion. Substantial methodological advances will be necessary to determine the best methods for acquisition and processing of in utero fetal data. These will include improvements in the correction of maternal and physiological sources of noise, enhancements in image resolution, development of age-specific fetal atlases, and robust motion correction. Additionally, a current limitation of fetal DTI and R-fMRI is that the field still lacks a definitive understanding regarding the physiological basis of the signals being measured. Although nascent, in utero fetal MRI represents an auspicious frontier for breakthroughs regarding the origins of disease and development of the human nervous system.
Translational Studies
A complete understanding of developmental miswiring in the functional connectome will continue to evade us until we move toward direct experimental manipulations capable of providing a mechanistic account of how miswiring can arise. Arguably, only animal models permit direct structural, pharmacological, molecular, and genetic experimental manipulations that will furnish comprehensive mechanistic insights into miswiring, while controlling for environmental factors (e.g., early experience and diet). Importantly, from the perspective of enabling longitudinal studies, the time scales of animal lifespans provide experimentally tractable timeframes within which to address developmental questions. Confidence in the likely success of a translational approach is bolstered by strong demonstrations of homology of the structural and functional connectomes across mammalian species. For example, homologues of the default network, which is thought to support spontaneous cognition in humans, have been identified in several non-human primate species, including the macaque monkey (Margulies et al., 2009; Vincent et al., 2007), chimpanzee (Barks et al., 2013), as well as in rodents (Lu et al., 2012). Cross-species homologies, particularly in the macaque monkey, extend beyond the default network to most of the networks commonly observed in humans (Hutchison and Everling, 2012).
Another important advantage of animal models is that they permit simultaneous invasive electrophysiological recordings, which are a prerequisite for understanding the neurophysiological basis of functional connectivity. While invasive recordings are possible in humans implanted with intracranial electrodes for the purposes of seizure monitoring, such studies are limited to areas in which seizure onset zones are suspected; additionally, by definition, the brains being examined are atypical. Animal models permit experimental invasive recordings not possible in humans. In macaques, Leopold and colleagues have shown robust relationships between fluctuations in the amplitude of intracranially recorded neuronal fluctuations in both high (e.g., gamma) and low frequency bands and the intrinsic fMRI signal fluctuations that underlie the functional connectome (e.g., Shmuel and Leopold, 2008). In rodents, an elegant line of research (e.g., Keilholz, 2014) has investigated the relationship between both static and dynamic measures of functional connectivity and concurrently recorded electrophysiological measures of neuronal activity. These efforts demonstrate how simultaneous recording techniques can permit the differentiation between aspects of the functional connectome that reflect changes in infraslow neuronal activity and those that reflect changes in higher frequency (e.g., gamma) activity. These distinct frequencies have been associated with global and local neuronal processing, respectively; longitudinal translational studies delineating these phenomena may therefore reveal the specific neuronal processes underlying integration and segregation in the connectome, and how these processes can go awry.
One major pitfall of fMRI studies in animal models is that the animals must either be anesthetized, introducing a major confounding influence (Li et al., 2014), or intensively trained to tolerate the magnet environment. Accordingly, the development and application of techniques that will facilitate the interrogation of the functional connectome in awake, behaving animals, is urgently needed.
SECTION 4: Analytic Models and Considerations
Changing Statistical Frameworks
Most studies of miswiring in the developing connectome have focused on the identification of connections between areas or functional systems (e.g., “task-positive” and default networks) that differ between children with and without a given diagnosis. Such approaches are preferred due to their reliance on widely available and easy to interpret univariate analyses. However, as highlighted in a recent review (Craddock et al., 2013) such approaches are not well suited for broader examinations of the connectome because they require careful correction for multiple comparisons. Additionally, univariate methods cannot measure interactions between systems. Such interactions may be particularly relevant in the developing connectome, where functional brain systems mature in concert with one another. Disturbances in the development of one functional system can impact the development of others. Schizophrenia research provides a useful example: recent models suggest that frontoparietal dysfunction may in part result from low-level abnormalities in the visual system (Butler et al., 2001). Thus, failure to examine systems interactions among systems (with multivariate approaches) can lead to spurious conclusions about deficits in individual systems.
Multivariate statistical approaches offer a potential solution to the limitations of univariate statistics, as they evaluate the relationship between the entire connectome and its associated phenotypic variables (e.g., age, diagnosis). While independent component analysis (ICA) is the most commonly used multivariate methodology in the connectomics literature, a growing number of alternative approaches are emerging (e.g., cluster analysis, support vector regression, multivariate distance-based matrix regression, canonical correlation analysis). Multivariate approaches are not without cost, however, as they inherently obscure information about the involvement of individual connections or functional systems, thereby necessitating follow-up with univariate analyses.
Next Steps for Graph Theoretical Analyses
Beyond the application of graph theory to the characterization of the human connectome, recent studies have highlighted its potential utility in dissecting heterogeneity among samples. This involves creating graphs in which nodes are used to represent study participants (rather than brain regions), and edges (connections) are used to represent the similarity of participants’ behavioral and/or imaging profiles (rather than functional or structural connectivity). In this sense, the graph represents the links between individuals based on similarities in their behavior and/or brain profile. Application of community detection approaches enables the identification of homogenous subgroups within a larger heterogeneous sample. Community detection overcomes challenges of attempting to match individuals on multiple dimensions simultaneously, and holds great promise for the identification of previously unappreciated subgroups, which can transcend traditional diagnostic labels. For example, Fair and colleagues used this approach to characterize heterogeneity in ADHD samples based on neuropsychological profiles and functional brain imaging (Fair et al., 2012a; Gates et al., 2014). Both of these works identified multiple subpopulations, not only in the clinical group, but also in typically developing samples. These efforts suggest that understanding heterogeneity in behavior and/or brain phenotypes among populations is critical to characterizing the multiple mechanisms that may underpin heterogeneous neuropsychiatric disorders. One other notable example is that of Yang and colleagues, who carried out community detection on R-fMRI-based graphs of drug-naïve, first-episode early-onset schizophrenia (EOS) patients and demographically matched controls based on their intrinsic brain networks (one graph per network). Community detection successfully differentiated individuals with EOS from controls, based on their default network graph, and EOS patients with predominantly negative symptoms from those without, based on their fronto-temporal network graph (Yang et al., 2014). Moving forward, subject community detection approaches are likely to provide the field with powerful tools for data-driven classification of individuals based upon complex heterogeneous profiles such as neuropsychiatric diagnoses.
Brain Maturation Indices
The concept of a “brain development index” was introduced to summarize the complex patterns of brain development present in imaging data and generate developmental trajectories. In this approach, high-dimensional imaging data are used to predict a subject’s age using regularized regression (e.g., support vector regression) or regularized regression (e.g., lasso or elastic net). Because of the flexibility of these models, it is critical that the data be cross-validated using separate training and testing sets. Dosenbach et al. (2010) used this approach to predict neurodevelopment on a single-subject level using the complex pattern of intrinsic brain functional connectivity (Dosenbach et al., 2010). Notably, the strengthening of within-network connections and weakening of between-network connections were among the most highly predictive of group membership. This finding has been replicated in independent datasets even after controlling for motion artifact (Fair et al., 2012b). Subsequently, this approach has been applied to multi-modal developmental data emphasizing its utility as a data-integration technique (Brown et al., 2012; Erus et al., 2014). For example, Erus et al. demonstrated that individuals with an advanced brain development index (constructed using T1 structural and DTI images) showed faster reaction times on a battery of cognitive tests, whereas those whose predicted “brain age” was substantially less than their actual age showed evidence of cognitive slowing (Brown et al., 2012; Erus et al., 2014). These studies have raised the possibility that deviations from a normative multivariate pattern of brain development could be associated with developmental neuropsychiatric syndromes. While this approach shows substantial promise of clinical utility, thus far most indices are constructed using chronological age as the single surrogate of maturation. Other functional indices of maturity are likely to emerge. In addition, specifying deviations in brain trajectories in complex multivariate patterns will be needed. If deviations from normative trajectories of brain development indices are present in many disparate disorders (as seems likely), necessary and sufficient brain features related to such deviations must be identified across, between, and within diagnostic groups.
Regional Indices
Regional metrics are gaining increasing popularity in the connectomics literature likely reflecting their amenability to full-brain, voxelwise exploratory analysis and apparent sensitivity to pathologic processes in the brain (for review see Zuo and Xing, 2014). Regional amplitude (ALFF; Zang et al., 2007) and homogeneity (ReHo; Zang et al., 2004) of the low-frequency fluctuations in spontaneous brain activity are among the most popular (but see Wink et al., 2008 for a discussion of elegant wavelet-based alternatives). Since their conception, these two indices have been revised to yield more robust and reliable measures. In the case of ALFF, fractional ALFF (fALFF; Zou et al., 2008) has emerged to minimize the contributions of artifactual signals (e.g., head motion); ReHo, which is based on volumes, has been refined to its cortical surface counterpart which has been shown to minimize partial volume effects (Zuo et al., 2013). Recent work has applied these regional metrics to index developmental and aging phenomena in the connectome, as well as to index inter-individual variation in behavior and cognition (Mennes et al., 2011). One caveat is that, while potentially valuable for biomarker development, the neurobiological meaning of these regional measures is yet to be determined (see an initial effort in Jiang et al., 2014).
Temporal Dynamics
Traditional perspectives of the connectome have viewed functional connectivity as being static, or constant over time; this is exemplified by depictions of the “functional connectome” with a single 3D graph. In contrast, a dynamic view, which emphasizes the presence of time-varying patterns in functional connectivity is rapidly emerging (Hutchison et al., 2013). Initial work suggests that the intrinsic brain alternates among a small number of well-defined “connectivity states” over time. While the developmental connectomics literature has yet to explore potential age-related changes in temporal dynamic properties (e.g., number of connectivity states, specific connectivity state patterns, transition behaviors), such exploration is imperative. Examination of temporal dynamics will have to be mindful of the potential contributions of motion, and motion correction strategies, as they both have the potential to artifactually alter findings.
Conclusion
The goal of the present perspective was to scope current efforts in developmental connectomics and provide insights into the work ahead for the field as it takes on the challenge of unraveling the miswired connectome. Recognizing that this is a dynamic period in developmental neuroscience, we attempted to balance promises and aspirations with a pragmatic review of the many obstacles and potential solutions. In considering the breadth of the issues raised, borrowing and sharing ideas and solutions from other disciplines may prove to be the single-most important means of accelerating the pursuit of a simple goal: to attain a better understanding of how the brain works in health and disease so that we can develop better diagnostics, prevention and treatments.
Table 2.
Selected large-scale pediatric imaging datasets
| Resource | Design | Target Sample | Age-Range (years) | Imaging type | Available for Sharing |
|---|---|---|---|---|---|
| 1000 Functional Connectome Project/International Data Sharing Initiative (FCP/INDI) | |||||
| ADHD-200: it aggregated 776 previously collected imaging and phenotypic data (491 TDC, and 285 ADHD) across 8 sites. Data released in February 2011. | CS | ADHD, TDC | 7–12 | R-fMRI, DTI | http://fcon_1000.projects.nitrc.org/ |
| Autism Brain Imaging Data Exchange (ABIDE): it aggregated 1112 previously collected imaging and phenotypic information (573 TDC, 539 autism) across 17 sites. Data released in August 2012. | CS | Autism, TDC | 7–55 | R-fMRI, aMRI, DTI | |
| Consortium for Reliability and Reproducibility (CORR): it aggregated previously collected test-retest imaging data from multiple sites, some of which included pediatric samples. Data released in June 2014. | Short and/or long TRT | TDC | 6–88 | R-fMRI, aMRI, DTI | |
| Power 2012: single site dataset employed in Power et al. 2012. | CS | TDC | 8–23 | R-fMRI, aMRI | |
| Enhanced Nathan Kline Institute-Rockland Sample (NKI-RS): ongoing effort aimed at creating a large-scale (N ~ 1000) community ascertained sample across the lifespan. A wide array of physiological and psychological, and genetic data accompany MRI data. Data are shared on a quarterly basis. A three-year longitudinal structured-cohort study for the subgroup of participants aged 6–17 has been recently added. Data collection started in 2013. | CS; Longit. | Representative community | CS: 6–85; Longit. 6–17 followed ~ yearly | R-fMRI, aMRI, DTI | |
|
| |||||
| Child and Adolescent Neurodevelopment Initiative (CANDI): retrospectively aggregated ~ 260 neuroimaging datasets from individuals with different child psychiatric disorders and controls (70 TDC, 31 ADHD, 130 BD, 32 COS). Data released in May 2010. | CS | TDC, ADHD, BD, COS | 3–21 | aMRI | http://www.nitrc.org/projects/candi_share |
|
| |||||
| ENIGMA (Enhancing NeuroImaging Genetics through Meta-Analysis) | |||||
| ENIGMA ADHD: aimed to carry out meta-analysis of existing imaging data collected in multiple sites of children and adults with ADHD and controls. The first data freeze was set at February 2014 and includes 1729 cases and 1544 controls from 23 international groups. Analyses by the working group are ongoing. | CS | TDC, ADHD | Children, adults | aMRI | NA |
| ENIGMA 22qDS: aimed to carry out meta-analysis of existing imaging data collected in multiple sites of children and adults with 22q deletion syndrome (22qDS). It is expected to aggregate ~500 datasets | CS | TDC, 22qDS | Children, adults | aMRI, DTI | NA |
|
| |||||
| Generation R: Large prospective, prenatal-cohort study of ~10,000 children that began in 2002 in Rotterdam, The Netherlands. MRI collection began in 2009, and is currently ongoing; as of 2013, ~800 children completed MRI. | Longit. | Community | 6–18 | R-fMRI, aMRI, DTI | NA |
|
| |||||
| IMAGEN: A dataset of 2,071 teens (14-years) recruited through schools across four European sites; includes gene, neuroimaging, neuropsychological, behavioral and clinical measures. A follow-up assessment was completed at age 16 years for 74% of the sample. | Longit. | Community | 14 (longit. at 16) | R-fMRI, aMRI, | NA |
|
| |||||
| National Database for Autism Research (NDAR): research data repository across NIH-funded studies and sites working on autism. It also offers a platform for federation of other research repositories (imaging and beyond). | Largely CS | Autism, TDC; other (e.g., ADHD) | birth to adulthood | aMRI, DTI, MRS, T-and R-fMRI | http://ndar.nih.gov/ |
|
| |||||
| NIH MRI Study of Normal Brain Development: aimed at mapping pediatric brain development in two age-based cohorts (N ~430 aged 6–18 years & ~100 aged 0–4 years) collected uniformly across 6 sites. Data collection started in November 2001 and ended in August 2007. | mixed CS & Longit. | TDC | 6–18; 0–4 | aMRI, DTI, MRS | http://pediatricmri.nih.gov/nihpd/info/ |
|
| |||||
| Pediatric Imaging Neurocognition and Genetics (PING): multi-site project collecting neurodevelopmental histories, information about developing mental and emotional functions, multimodal brain imaging data, and genotypes for N>1000 subjects | CS | TDC | 3–20 | R-fMRI, aMRI, DTI | http://pingstudy.ucsd.edu/ |
|
| |||||
| The Philadelphia Neurodevelopmental Cohort (PNC): includes a population-based sample of over 9500 individuals from the greater Philadelphia area who received medical care through the CHOP network; 1445 of them completed imaging over the period between 2009 and 2012. Participants, not ascertained through psychiatric services, were genotyped and completed a broad battery of neuropsychological measures. Data released in 2013. | CS | Community | 8–21 | R-fMRI, aMRI, ASL, DTI, T-fMRI | http://www.ncbi.nlm.nih.gov/projects/gap/cgi-bin/study.cgi?study_id=phs000607.v1.p1 |
Legend: ADHD: Attention Deficit Hyperactivity Disorder; aMRI: Anatomical Magnetic Resonance Imaging; ASL: Arterial Spin Labeling; BD: Bipolar Disorder; COS: Childhood Onset Schizophrenia; CS: cross-sectional; DTI: Diffusion Tensor Imaging; Longit.: Longitudinal; MRI: Magnetic Resonance Imaging; MRS: Magnetic Resonance Spectroscopy; NA: Not applicable; NIH: National Institutes of Health; NKI: Nathan Kline Institute; R-fMRI: Resting-state Functional MRI; TDC: Typically Developing Controls; T-fMRI: Task-based Functional MRI; TRT: Test Retest
Acknowledgments
The authors wish to thank Dr. Nicholas Van Dam, Ms. Hallie Brown and Ms. Emma Stanislawski for editorial suggestions on earlier versions of this manuscript, Mr. Krishna Somandepalli, Mr. Dillon Sharp and Ms. Monica Gordillo for assistance in figure preparation. This work was in part supported by NIH (R21MH102660-01 to Dr. Di Martino; U01MH099059 to Dr. Milham; K23MH09813 to Dr. Satterthwaite; R01MH096773 and R00MH091238 to Dr. Fair; R01MH080243, R21HD074850 and MH067924 to Dr. Luna; R03MH104334 to Dr. Kelly); the National Key Technologies R&D Program of China (2012BAI36B01), the National Natural Science Foundation of China (81171409, 81220108014), and the Key Research Program and the Hundred Talents Program of the Chinese Academy of Sciences (KSZD-EW-TZ-002) awarded to Dr. Zuo; the support of the Leon Levy Foundation to Dr. Kelly; and gifts from Phyllis Green and Randolph Cowen to Dr. Castellanos and Dr. Milham and from Joseph P. Healey to Dr. Milham.
Footnotes
Of note, this specific pattern is dependent upon the inclusion of global signal regression in image preprocessing. When excluded, the opposite pattern is observed, with motion artifacts producing increases in long-range connectivity and decreases in short (Satterthwaite et al., 2013).
Publisher's Disclaimer: This is a PDF file of an unedited manuscript that has been accepted for publication. As a service to our customers we are providing this early version of the manuscript. The manuscript will undergo copyediting, typesetting, and review of the resulting proof before it is published in its final citable form. Please note that during the production process errors may be discovered which could affect the content, and all legal disclaimers that apply to the journal pertain.
References
- Altaye M, Holland SK, Wilke M, Gaser C. Infant brain probability templates for MRI segmentation and normalization. Neuroimage. 2008;43:721–730. doi: 10.1016/j.neuroimage.2008.07.060. [DOI] [PMC free article] [PubMed] [Google Scholar]
- Ball G, Aljabar P, Zebari S, Tusor N, Arichi T, Merchant N, Robinson EC, Ogundipe E, Rueckert D, Edwards AD, Counsell SJ. Rich-club organization of the newborn human brain. Proc Natl Acad Sci U S A. 2014;111:7456–7461. doi: 10.1073/pnas.1324118111. [DOI] [PMC free article] [PubMed] [Google Scholar]
- Barks SK, Parr LA, Rilling JK. The Default Mode Network in Chimpanzees (Pan troglodytes) is Similar to That of Humans. Cereb Cortex. 2013 doi: 10.1093/cercor/bht253. [DOI] [PMC free article] [PubMed] [Google Scholar]
- Batalle D, Eixarch E, Figueras F, Munoz-Moreno E, Bargallo N, Illa M, Acosta-Rojas R, Amat-Roldan I, Gratacos E. Altered small-world topology of structural brain networks in infants with intrauterine growth restriction and its association with later neurodevelopmental outcome. Neuroimage. 2012;60:1352–1366. doi: 10.1016/j.neuroimage.2012.01.059. [DOI] [PubMed] [Google Scholar]
- Beckmann M, Johansen-Berg H, Rushworth MF. Connectivity-based parcellation of human cingulate cortex and its relation to functional specialization. J Neurosci. 2009;29:1175–1190. doi: 10.1523/JNEUROSCI.3328-08.2009. [DOI] [PMC free article] [PubMed] [Google Scholar]
- Behan B, Connolly CG, Datwani S, Doucet M, Ivanovic J, Morioka R, Stone A, Watts R, Smyth B, Garavan H. Response inhibition and elevated parietal-cerebellar correlations in chronic adolescent cannabis users. Neuropharmacology. 2014;84:131–137. doi: 10.1016/j.neuropharm.2013.05.027. [DOI] [PubMed] [Google Scholar]
- Bellec P, Rosa-Neto P, Lyttelton OC, Benali H, Evans AC. Multi-level bootstrap analysis of stable clusters in resting-state fMRI. Neuroimage. 2010;51:1126–1139. doi: 10.1016/j.neuroimage.2010.02.082. [DOI] [PubMed] [Google Scholar]
- Betzel RF, Byrge L, He Y, Goni J, Zuo XN, Sporns O. Changes in structural and functional connectivity among resting-state networks across the human lifespan. Neuroimage. 2014 doi: 10.1016/j.neuroimage.2014.07.067. [DOI] [PubMed] [Google Scholar]
- Birn RM. The role of physiological noise in resting-state functional connectivity. Neuroimage. 2012;62:864–870. doi: 10.1016/j.neuroimage.2012.01.016. [DOI] [PubMed] [Google Scholar]
- Blakemore SJ, Burnett S, Dahl RE. The role of puberty in the developing adolescent brain. Hum Brain Mapp. 2010;31:926–933. doi: 10.1002/hbm.21052. [DOI] [PMC free article] [PubMed] [Google Scholar]
- Bluhm RL, Williamson PC, Osuch EA, Frewen PA, Stevens TK, Boksman K, Neufeld RW, Theberge J, Lanius RA. Alterations in default network connectivity in posttraumatic stress disorder related to early-life trauma. J Psychiatry Neurosci. 2009;34:187–194. [PMC free article] [PubMed] [Google Scholar]
- Blumensath T, Jbabdi S, Glasser MF, Van Essen DC, Ugurbil K, Behrens TE, Smith SM. Spatially constrained hierarchical parcellation of the brain with resting-state fMRI. Neuroimage. 2013;76:313–324. doi: 10.1016/j.neuroimage.2013.03.024. [DOI] [PMC free article] [PubMed] [Google Scholar]
- Boly M, Perlbarg V, Marrelec G, Schabus M, Laureys S, Doyon J, Pelegrini-Issac M, Maquet P, Benali H. Hierarchical clustering of brain activity during human nonrapid eye movement sleep. Proc Natl Acad Sci U S A. 2012;109:5856–5861. doi: 10.1073/pnas.1111133109. [DOI] [PMC free article] [PubMed] [Google Scholar]
- Bramen JE, Hranilovich JA, Dahl RE, Forbes EE, Chen J, Toga AW, Dinov ID, Worthman CM, Sowell ER. Puberty influences medial temporal lobe and cortical gray matter maturation differently in boys than girls matched for sexual maturity. Cereb Cortex. 2011;21:636–646. doi: 10.1093/cercor/bhq137. [DOI] [PMC free article] [PubMed] [Google Scholar]
- Brown TT, Kuperman JM, Chung Y, Erhart M, McCabe C, Hagler DJ, Jr, Venkatraman VK, Akshoomoff N, Amaral DG, Bloss CS, et al. Neuroanatomical assessment of biological maturity. Current biology: CB. 2012;22:1693–1698. doi: 10.1016/j.cub.2012.07.002. [DOI] [PMC free article] [PubMed] [Google Scholar]
- Bullmore E, Sporns O. The economy of brain network organization. Nature Reviews Neuroscience. 2012;13:336–349. doi: 10.1038/nrn3214. [DOI] [PubMed] [Google Scholar]
- Burghy CA, Stodola DE, Ruttle PL, Molloy EK, Armstrong JM, Oler JA, Fox ME, Hayes AS, Kalin NH, Essex MJ, et al. Developmental pathways to amygdala-prefrontal function and internalizing symptoms in adolescence. Nat Neurosci. 2012;15:1736–1741. doi: 10.1038/nn.3257. [DOI] [PMC free article] [PubMed] [Google Scholar]
- Buss C, Davis EP, Shahbaba B, Pruessner JC, Head K, Sandman CA. Maternal cortisol over the course of pregnancy and subsequent child amygdala and hippocampus volumes and affective problems. Proc Natl Acad Sci U S A. 2012;109:E1312–1319. doi: 10.1073/pnas.1201295109. [DOI] [PMC free article] [PubMed] [Google Scholar]
- Butler PD, Schechter I, Zemon V, Schwartz SG, Greenstein VC, Gordon J, Schroeder CE, Javitt DC. Dysfunction of early-stage visual processing in schizophrenia. AJP. 2001;158:1126–1133. doi: 10.1176/appi.ajp.158.7.1126. [DOI] [PubMed] [Google Scholar]
- Cao M, Wang JH, Dai ZJ, Cao XY, Jiang LL, Fan FM, Song XW, Xia MR, Shu N, Dong Q, et al. Topological organization of the human brain functional connectome across the lifespan. Developmental cognitive neuroscience. 2014;7:76–93. doi: 10.1016/j.dcn.2013.11.004. [DOI] [PMC free article] [PubMed] [Google Scholar]
- Castellanos FX, Di Martino A, Craddock RC, Mehta AD, Milham MP. Clinical applications of the functional connectome. Neuroimage. 2013;80:527–540. doi: 10.1016/j.neuroimage.2013.04.083. [DOI] [PMC free article] [PubMed] [Google Scholar]
- Caviness VS, Jr, Kennedy DN, Richelme C, Rademacher J, Filipek PA. The human brain age 7–11 years: a volumetric analysis based on magnetic resonance images. Cereb Cortex. 1996;6:726–736. doi: 10.1093/cercor/6.5.726. [DOI] [PubMed] [Google Scholar]
- Chow ML, Pramparo T, Winn ME, Barnes CC, Li HR, Weiss L, Fan JB, Murray S, April C, Belinson H, et al. Age-dependent brain gene expression and copy number anomalies in autism suggest distinct pathological processes at young versus mature ages. PLoS genetics. 2012;8:e1002592. doi: 10.1371/journal.pgen.1002592. [DOI] [PMC free article] [PubMed] [Google Scholar]
- Church JA, Fair DA, Dosenbach NU, Cohen AL, Miezin FM, Petersen SE, Schlaggar BL. Control networks in paediatric Tourette syndrome show immature and anomalous patterns of functional connectivity. Brain. 2009;132:225–238. doi: 10.1093/brain/awn223. [DOI] [PMC free article] [PubMed] [Google Scholar]
- Collin G, Kahn RS, de Reus MA, Cahn W, van den Heuvel MP. Impaired rich club connectivity in unaffected siblings of schizophrenia patients. Schizophr Bull. 2014;40:438–448. doi: 10.1093/schbul/sbt162. [DOI] [PMC free article] [PubMed] [Google Scholar]
- Collin G, van den Heuvel MP. The ontogeny of the human connectome: development and dynamic changes of brain connectivity across the life span. Neuroscientist. 2013;19:616–628. doi: 10.1177/1073858413503712. [DOI] [PubMed] [Google Scholar]
- Craddock RC, James GA, Holtzheimer PE, III, Hu XP, Mayberg HS. A whole brain fMRI atlas generated via spatially constrained spectral clustering. Hum Brain Mapp. 2012;33:1914–1928. doi: 10.1002/hbm.21333. [DOI] [PMC free article] [PubMed] [Google Scholar]
- Craddock RC, Jbabdi S, Yan CG, Vogelstein JT, Castellanos FX, Di Martino A, Kelly C, Heberlein K, Colcombe S, Milham MP. Imaging human connectomes at the macroscale. Nat Med. 2013;10:524–539. doi: 10.1038/nmeth.2482. [DOI] [PMC free article] [PubMed] [Google Scholar]
- Dennis EL, Jahanshad N, McMahon KL, de Zubicaray GI, Martin NG, Hickie IB, Toga AW, Wright MJ, Thompson PM. Development of brain structural connectivity between ages 12 and 30: a 4-Tesla diffusion imaging study in 439 adolescents and adults. Neuroimage. 2013a;64:671–684. doi: 10.1016/j.neuroimage.2012.09.004. [DOI] [PMC free article] [PubMed] [Google Scholar]
- Dennis EL, Jahanshad N, Toga AW, McMahon KL, de Zubicaray GI, Hickie I, Wright MJ, Thompson PM. Development of the “Rich Club” in Brain Connectivity Networks from 438 Adolescents & Adults Aged 12 to 30. Proceedings/IEEE International Symposium on Biomedical Imaging: from nano to macro IEEE International Symposium on Biomedical Imaging; 2013b. pp. 624–627. [DOI] [PMC free article] [PubMed] [Google Scholar]
- Dennis EL, Thompson PM. Reprint of: Mapping connectivity in the developing brain. Int J Dev Neurosci. 2014;32:41–57. doi: 10.1016/j.ijdevneu.2013.11.005. [DOI] [PMC free article] [PubMed] [Google Scholar]
- Desikan RS, Segonne F, Fischl B, Quinn BT, Dickerson BC, Blacker D, Buckner RL, Dale AM, Maguire RP, Hyman BT, et al. An automated labeling system for subdividing the human cerebral cortex on MRI scans into gyral based regions of interest. Neuroimage. 2006;31:968–980. doi: 10.1016/j.neuroimage.2006.01.021. [DOI] [PubMed] [Google Scholar]
- Di Martino A, Kelly C, Grzadzinski R, Zuo XN, Mennes M, Mairena MA, Lord C, Castellanos FX, Milham MP. Aberrant striatal functional connectivity in children with autism. BP. 2011;69:847–856. doi: 10.1016/j.biopsych.2010.10.029. [DOI] [PMC free article] [PubMed] [Google Scholar]
- Dosenbach NU, Fair DA, Miezin FM, Cohen AL, Wenger KK, Dosenbach RA, Fox MD, Snyder AZ, Vincent JL, Raichle ME, et al. Distinct brain networks for adaptive and stable task control in humans. Proc Natl Acad Sci USA. 2007;104:11073–11078. doi: 10.1073/pnas.0704320104. [DOI] [PMC free article] [PubMed] [Google Scholar]
- Dosenbach NU, Nardos B, Cohen AL, Fair DA, Power JD, Church JA, Nelson SM, Wig GS, Vogel AC, Lessov-Schlaggar CN, et al. Prediction of individual brain maturity using fMRI. Science. 2010;329:1358–1361. doi: 10.1126/science.1194144. [DOI] [PMC free article] [PubMed] [Google Scholar]
- Eickhoff SB, Stephan KE, Mohlberg H, Grefkes C, Fink GR, Amunts K, Zilles K. A new SPM toolbox for combining probabilistic cytoarchitectonic maps and functional imaging data. Neuroimage. 2005;25:1325–1335. doi: 10.1016/j.neuroimage.2004.12.034. [DOI] [PubMed] [Google Scholar]
- El-Fishawy P, State MW. The genetics of autism: key issues, recent findings, and clinical implications. Psychiatr Clin North Am. 2010;33:83–105. doi: 10.1016/j.psc.2009.12.002. [DOI] [PMC free article] [PubMed] [Google Scholar]
- Elton A, Tripathi SP, Mletzko T, Young J, Cisler JM, James GA, Kilts CD. Childhood maltreatment is associated with a sex-dependent functional reorganization of a brain inhibitory control network. Hum Brain Mapp. 2014;35:1654–1667. doi: 10.1002/hbm.22280. [DOI] [PMC free article] [PubMed] [Google Scholar]
- Erus G, Battapady H, Satterthwaite TD, Hakonarson H, Gur RE, Davatzikos C, Gur RC. Imaging Patterns of Brain Development and their Relationship to Cognition. Cereb Cortex. 2014 doi: 10.1093/cercor/bht425. [DOI] [PMC free article] [PubMed] [Google Scholar]
- Fair DA, Bathula D, Mills KL, Dias TG, Blythe MS, Zhang D, Snyder AZ, Raichle ME, Stevens AA, Nigg JT, Nagel BJ. Maturing thalamocortical functional connectivity across development. Front Syst Neurosci. 2010;4:10. doi: 10.3389/fnsys.2010.00010. [DOI] [PMC free article] [PubMed] [Google Scholar]
- Fair DA, Bathula D, Nikolas MA, Nigg JT. Distinct neuropsychological subgroups in typically developing youth inform heterogeneity in children with ADHD. Proc Natl Acad Sci USA. 2012a;109:6769–6774. doi: 10.1073/pnas.1115365109. [DOI] [PMC free article] [PubMed] [Google Scholar]
- Fair DA, Cohen AL, Power JD, Dosenbach NU, Church JA, Miezin FM, Schlaggar BL, Petersen SE. Functional brain networks develop from a “local to distributed” organization. PLoS Comput Biol. 2009;5:e1000381. doi: 10.1371/journal.pcbi.1000381. [DOI] [PMC free article] [PubMed] [Google Scholar]
- Fair DA, Dosenbach NU, Church JA, Cohen AL, Brahmbhatt S, Miezin FM, Barch DM, Raichle ME, Petersen SE, Schlaggar BL. Development of distinct control networks through segregation and integration. Proc Natl Acad Sci USA. 2007;104:13507–13512. doi: 10.1073/pnas.0705843104. [DOI] [PMC free article] [PubMed] [Google Scholar]
- Fair DA, Nigg JT, Iyer S, Bathula D, Mills KL, Dosenbach NU, Schlaggar BL, Mennes M, Gutman D, Bangaru S, et al. Distinct neural signatures detected for ADHD subtypes after controlling for micro-movements in resting state functional connectivity MRI data. Front SystNeurosci. 2012b;6:80. doi: 10.3389/fnsys.2012.00080. [DOI] [PMC free article] [PubMed] [Google Scholar]
- Falk EB, Hyde LW, Mitchell C, Faul J, Gonzalez R, Heitzeg MM, Keating DP, Langa KM, Martz ME, Maslowsky J, et al. What is a representative brain? Neuroscience meets population science. Proc Natl Acad Sci U S A. 2013;110:17615–17622. doi: 10.1073/pnas.1310134110. [DOI] [PMC free article] [PubMed] [Google Scholar]
- Fonov V, Evans AC, Botteron K, Almli CR, McKinstry RC, Collins DL Brain Development Cooperative G. Unbiased average age-appropriate atlases for pediatric studies. Neuroimage. 2011;54:313–327. doi: 10.1016/j.neuroimage.2010.07.033. [DOI] [PMC free article] [PubMed] [Google Scholar]
- Fornito A, Zalesky A, Bassett DS, Meunier D, Ellison-Wright I, Yucel M, Wood SJ, Shaw K, O’Connor J, Nertney D, et al. Genetic influences on cost-efficient organization of human cortical functional networks. J Neurosci. 2011;31:3261–3270. doi: 10.1523/JNEUROSCI.4858-10.2011. [DOI] [PMC free article] [PubMed] [Google Scholar]
- Fox MD, Greicius M. Clinical applications of resting state functional connectivity. Front SystNeurosci. 2010;4:19. doi: 10.3389/fnsys.2010.00019. [DOI] [PMC free article] [PubMed] [Google Scholar]
- Fransson P, Aden U, Blennow M, Lagercrantz H. The functional architecture of the infant brain as revealed by resting-state fMRI. Cereb Cortex. 2011;21:145–154. doi: 10.1093/cercor/bhq071. [DOI] [PubMed] [Google Scholar]
- Fransson P, Skiold B, Engstrom M, Hallberg B, Mosskin M, Aden U, Lagercrantz H, Blennow M. Spontaneous brain activity in the newborn brain during natural sleep--an fMRI study in infants born at full term. Pediatr Res. 2009;66:301–305. doi: 10.1203/PDR.0b013e3181b1bd84. [DOI] [PubMed] [Google Scholar]
- Fransson P, Skiold B, Horsch S, Nordell A, Blennow M, Lagercrantz H, Aden U. Resting-state networks in the infant brain. Proc Natl Acad Sci USA. 2007;104:15531–15536. doi: 10.1073/pnas.0704380104. [DOI] [PMC free article] [PubMed] [Google Scholar]
- Gabbay V, Klein RG, Alonso CM, Babb JS, Nishawala M, De Jesus G, Hirsch GS, Hottinger-Blanc PM, Gonzalez CJ. Immune system dysregulation in adolescent major depressive disorder. J Affect Disord. 2009;115:177–182. doi: 10.1016/j.jad.2008.07.022. [DOI] [PMC free article] [PubMed] [Google Scholar]
- Gabbay V, Liebes L, Katz Y, Liu S, Mendoza S, Babb JS, Klein RG, Gonen O. The kynurenine pathway in adolescent depression: preliminary findings from a proton MR spectroscopy study. Prog Neuropsychopharmacol Biol Psychiatry. 2010;34:37–44. doi: 10.1016/j.pnpbp.2009.09.015. [DOI] [PMC free article] [PubMed] [Google Scholar]
- Galvan A, Hare TA, Parra CE, Penn J, Voss H, Glover G, Casey BJ. Earlier development of the accumbens relative to orbitofrontal cortex might underlie risk-taking behavior in adolescents. J Neurosci. 2006;26:6885–6892. doi: 10.1523/JNEUROSCI.1062-06.2006. [DOI] [PMC free article] [PubMed] [Google Scholar]
- Gao W, Alcauter S, Elton A, Hernandez-Castillo CR, Smith JK, Ramirez J, Lin W. Functional Network Development During the First Year: Relative Sequence and Socioeconomic Correlations. Cereb Cortex. 2014a doi: 10.1093/cercor/bhu088. [DOI] [PMC free article] [PubMed] [Google Scholar]
- Gao W, Alcauter S, Smith JK, Gilmore JH, Lin W. Development of human brain cortical network architecture during infancy. Brain structure & function. 2014b doi: 10.1007/s00429-014-0710-3. [DOI] [PMC free article] [PubMed] [Google Scholar]
- Gao W, Gilmore JH, Giovanello KS, Smith JK, Shen D, Zhu H, Lin W. Temporal and spatial evolution of brain network topology during the first two years of life. PLoS ONE. 2011;6:e25278. doi: 10.1371/journal.pone.0025278. [DOI] [PMC free article] [PubMed] [Google Scholar]
- Gao W, Gilmore JH, Shen D, Smith JK, Zhu H, Lin W. The Synchronization within and Interaction between the Default and Dorsal Attention Networks in Early Infancy. Cereb Cortex. 2013;23:594–603. doi: 10.1093/cercor/bhs043. [DOI] [PMC free article] [PubMed] [Google Scholar]
- Gates KM, Molenaar PC, Iyer SP, Nigg JT, Fair DA. Organizing heterogeneous samples using community detection of GIMME-derived resting state functional networks. PLoS ONE. 2014;9:e91322. doi: 10.1371/journal.pone.0091322. [DOI] [PMC free article] [PubMed] [Google Scholar]
- Gee DG, Gabard-Durnam LJ, Flannery J, Goff B, Humphreys KL, Telzer EH, Hare TA, Bookheimer SY, Tottenham N. Early developmental emergence of human amygdala-prefrontal connectivity after maternal deprivation. Proc Natl Acad Sci USA. 2013;110:15638–15643. doi: 10.1073/pnas.1307893110. [DOI] [PMC free article] [PubMed] [Google Scholar]
- Geier CF, Terwilliger R, Teslovich T, Velanova K, Luna B. Immaturities in reward processing and its influence on inhibitory control in adolescence. Cereb Cortex. 2010;20:1613–1629. doi: 10.1093/cercor/bhp225. [DOI] [PMC free article] [PubMed] [Google Scholar]
- Ghosh A, Shatz CJ. A role for subplate neurons in the patterning of connections from thalamus to neocortex. Development. 1993;117:1031–1047. doi: 10.1242/dev.117.3.1031. [DOI] [PubMed] [Google Scholar]
- Glahn DC, Almasy L, Barguil M, Hare E, Peralta JM, Kent JW, Jr, Dassori A, Contreras J, Pacheco A, Lanzagorta N, et al. Neurocognitive endophenotypes for bipolar disorder identified in multiplex multigenerational families. AGP. 2010;67:168–177. doi: 10.1001/archgenpsychiatry.2009.184. [DOI] [PMC free article] [PubMed] [Google Scholar]
- Gluckman PD, Hanson MA. Living with the past: evolution, development, and patterns of disease. Science. 2004;305:1733–1736. doi: 10.1126/science.1095292. [DOI] [PubMed] [Google Scholar]
- Gogtay N, Sporn A, Clasen LS, Nugent TF, III, Greenstein D, Nicolson R, Giedd JN, Lenane M, Gochman P, Evans A, Rapoport JL. Comparison of progressive cortical gray matter loss in childhood-onset schizophrenia with that in childhood-onset atypical psychoses. AGP. 2004;61:17–22. doi: 10.1001/archpsyc.61.1.17. [DOI] [PubMed] [Google Scholar]
- Graham AM, Fisher PA, Pfeifer JH. What sleeping babies hear: a functional MRI study of interparental conflict and infants’ emotion processing. Psychol Sci. 2013;24:782–789. doi: 10.1177/0956797612458803. [DOI] [PMC free article] [PubMed] [Google Scholar]
- Grayson DS, Ray S, Carpenter S, Iyer S, Dias TG, Stevens C, Nigg JT, Fair DA. Structural and functional rich club organization of the brain in children and adults. PLoS ONE. 2014;9:e88297. doi: 10.1371/journal.pone.0088297. [DOI] [PMC free article] [PubMed] [Google Scholar]
- Greene DJ, Laumann TO, Dubis JW, Ihnen SK, Neta M, Power JD, Pruett JR, Jr, Black KJ, Schlaggar BL. Developmental changes in the organization of functional connections between the basal ganglia and cerebral cortex. J Neurosci. 2014;34:5842–5854. doi: 10.1523/JNEUROSCI.3069-13.2014. [DOI] [PMC free article] [PubMed] [Google Scholar]
- Griffanti L, Salimi-Khorshidi G, Beckmann CF, Auerbach EJ, Douaud G, Sexton CE, Zsoldos E, Ebmeier KP, Filippini N, Mackay CE, et al. ICA-based artefact removal and accelerated fMRI acquisition for improved resting state network imaging. Neuroimage. 2014;95:232–247. doi: 10.1016/j.neuroimage.2014.03.034. [DOI] [PMC free article] [PubMed] [Google Scholar]
- Groppo M, Ricci D, Bassi L, Merchant N, Doria V, Arichi T, Allsop JM, Ramenghi L, Fox MJ, Cowan FM, et al. Development of the optic radiations and visual function after premature birth. Cortex. 2014;56:30–37. doi: 10.1016/j.cortex.2012.02.008. [DOI] [PubMed] [Google Scholar]
- Hagmann P, Grant PE, Fair DA. MR connectomics: a conceptual framework for studying the developing brain. Frontiers in systems neuroscience. 2012;6:43. doi: 10.3389/fnsys.2012.00043. [DOI] [PMC free article] [PubMed] [Google Scholar]
- Hagmann P, Sporns O, Madan N, Cammoun L, Pienaar R, Wedeen VJ, Meuli R, Thiran JP, Grant PE. White matter maturation reshapes structural connectivity in the late developing human brain. Proc Natl Acad Sci USA. 2010;107:19067–19072. doi: 10.1073/pnas.1009073107. [DOI] [PMC free article] [PubMed] [Google Scholar]
- Herringa RJ, Birn RM, Ruttle PL, Burghy CA, Stodola DE, Davidson RJ, Essex MJ. Childhood maltreatment is associated with altered fear circuitry and increased internalizing symptoms by late adolescence. Proc Natl Acad Sci U S A. 2013;110:19119–19124. doi: 10.1073/pnas.1310766110. [DOI] [PMC free article] [PubMed] [Google Scholar]
- Horovitz SG, Braun AR, Carr WS, Picchioni D, Balkin TJ, Fukunaga M, Duyn JH. Decoupling of the brain’s default mode network during deep sleep. Proc Natl Acad Sci U S A. 2009;106:11376–11381. doi: 10.1073/pnas.0901435106. [DOI] [PMC free article] [PubMed] [Google Scholar]
- Hutchison RM, Everling S. Monkey in the middle: why non-human primates are needed to bridge the gap in resting-state investigations. Front Neuroanat. 2012;6:29. doi: 10.3389/fnana.2012.00029. [DOI] [PMC free article] [PubMed] [Google Scholar]
- Hutchison RM, Womelsdorf T, Allen EA, Bandettini PA, Calhoun VD, Corbetta M, Della PS, Duyn J, Glover G, Gonzalez-Castillo J, et al. Dynamic functional connectivity: Promises, issues, and interpretations. Neuroimage. 2013 doi: 10.1016/j.neuroimage.2013.05.079. [DOI] [PMC free article] [PubMed] [Google Scholar]
- Huttenlocher PR, Dabholkar AS. Regional differences in synaptogenesis in human cerebral cortex. J Comp Neurol. 1997;387:167–178. doi: 10.1002/(sici)1096-9861(19971020)387:2<167::aid-cne1>3.0.co;2-z. [DOI] [PubMed] [Google Scholar]
- Hwang K, Hallquist MN, Luna B. The development of hub architecture in the human functional brain network. Cereb Cortex. 2013;23:2380–2393. doi: 10.1093/cercor/bhs227. [DOI] [PMC free article] [PubMed] [Google Scholar]
- Ingalhalikar M, Smith A, Parker D, Satterthwaite TD, Elliott MA, Ruparel K, Hakonarson H, Gur RE, Gur RC, Verma R. Reply to Joel and Tarrasch: On misreading and shooting the messenger. Proc Natl Acad Sci U S A. 2014;111:E638. doi: 10.1073/pnas.1323601111. [DOI] [PMC free article] [PubMed] [Google Scholar]
- Jacobus J, Tapert SF. Effects of cannabis on the adolescent brain. Current pharmaceutical design. 2014;20:2186–2193. doi: 10.2174/13816128113199990426. [DOI] [PMC free article] [PubMed] [Google Scholar]
- Jaddoe VW, van Duijn CM, Franco OH, van der Heijden AJ, van Iizendoorn MH, de Jongste JC, van der Lugt A, Mackenbach JP, Moll HA, Raat H, et al. The Generation R Study: design and cohort update 2012. European journal of epidemiology. 2012;27:739–756. doi: 10.1007/s10654-012-9735-1. [DOI] [PubMed] [Google Scholar]
- Jiang L, Xu T, He Y, Hou XH, Wang J, Cao XY, Wei GX, Yang Z, He Y, Zuo XN. Toward neurobiological characterization of functional homogeneity in the human cortex: regional variation, morphological association and functional covariance network organization. Brain structure & function. 2014 doi: 10.1007/s00429-014-0795-8. [DOI] [PubMed] [Google Scholar]
- Jiang S, Xue H, Counsell S, Anjari M, Allsop J, Rutherford M, Rueckert D, Hajnal JV. Diffusion tensor imaging (DTI) of the brain in moving subjects: application to in-utero fetal and ex-utero studies. Magnetic resonance in medicine: official journal of the Society of Magnetic Resonance in Medicine/Society of Magnetic Resonance in Medicine. 2009;62:645–655. doi: 10.1002/mrm.22032. [DOI] [PubMed] [Google Scholar]
- Kapur S, Phillips AG, Insel TR. Why has it taken so long for biological psychiatry to develop clinical tests and what to do about it? Mol Psychiatry. 2012;17:1174–1179. doi: 10.1038/mp.2012.105. [DOI] [PubMed] [Google Scholar]
- Karmel BZ, Gardner JM, Meade LS, Cohen IL, London E, Flory MJ, Lennon EM, Miroshnichenko I, Rabinowitz S, Parab S, et al. Early medical and behavioral characteristics of NICU infants later classified with ASD. Pediatrics. 2010;126:457–467. doi: 10.1542/peds.2009-2680. [DOI] [PMC free article] [PubMed] [Google Scholar]
- Kasprian G, Brugger PC, Weber M, Krssak M, Krampl E, Herold C, Prayer D. In utero tractography of fetal white matter development. Neuroimage. 2008;43:213–224. doi: 10.1016/j.neuroimage.2008.07.026. [DOI] [PubMed] [Google Scholar]
- Keilholz SD. Review Article: The Neural Basis of Time-Varying Resting State Functional Connectivity. Brain connectivity. 2014 doi: 10.1089/brain.2014.0250. [DOI] [PMC free article] [PubMed] [Google Scholar]
- Kelly AMC, Di Martino A, Uddin LQ, Shehzad Z, Gee DG, Reiss PT, Margulies DS, Castellanos FX, Milham MP. Development of anterior cingulate functional connectivity from late childhood to early adulthood. Cereb Cortex. 2009;19:640–657. doi: 10.1093/cercor/bhn117. [DOI] [PubMed] [Google Scholar]
- Kessler RC, Berglund P, Demler O, Jin R, Merikangas KR, Walters EE. Lifetime prevalence and age-of-onset distributions of DSM-IV disorders in the National Comorbidity Survey Replication. AGP. 2005;62:593–602. doi: 10.1001/archpsyc.62.6.593. [DOI] [PubMed] [Google Scholar]
- Kraemer HC, Yesavage JA, Taylor JL, Kupfer D. How can we learn about developmental processes from cross-sectional studies, or can we? AJP. 2000;157:163–171. doi: 10.1176/appi.ajp.157.2.163. [DOI] [PubMed] [Google Scholar]
- Kundu P, Brenowitz ND, Voon V, Worbe Y, Vertes PE, Inati SJ, Saad ZS, Bandettini PA, Bullmore ET. Integrated strategy for improving functional connectivity mapping using multiecho fMRI. Proc Natl Acad Sci USA. 2013;110:16187–16192. doi: 10.1073/pnas.1301725110. [DOI] [PMC free article] [PubMed] [Google Scholar]
- Lancaster JL, Woldorff MG, Parsons LM, Liotti M, Freitas CS, Rainey L, Kochunov PV, Nickerson D, Mikiten SA, Fox PT. Automated Talairach atlas labels for functional brain mapping. Hum Brain Mapp. 2000;10:120–131. doi: 10.1002/1097-0193(200007)10:3<120::AID-HBM30>3.0.CO;2-8. [DOI] [PMC free article] [PubMed] [Google Scholar]
- Larson-Prior LJ, Power JD, Vincent JL, Nolan TS, Coalson RS, Zempel J, Snyder AZ, Schlaggar BL, Raichle ME, Petersen SE. Modulation of the brain’s functional network architecture in the transition from wake to sleep. Prog Brain Res. 2011;193:277–294. doi: 10.1016/B978-0-444-53839-0.00018-1. [DOI] [PMC free article] [PubMed] [Google Scholar]
- Lebel C, Rasmussen C, Wyper K, Walker L, Andrew G, Yager J, Beaulieu C. Brain diffusion abnormalities in children with fetal alcohol spectrum disorder. Alcohol Clin Exp Res. 2008;32:1732–1740. doi: 10.1111/j.1530-0277.2008.00750.x. [DOI] [PubMed] [Google Scholar]
- Li J, Ishiwari K, Conway MW, Francois J, Huxter J, Lowry JP, Schwarz AJ, Tricklebank M, Gilmour G. Dissociable effects of antipsychotics on ketamine-induced changes in regional oxygenation and inter-regional coherence of low frequency oxygen fluctuations in the rat. Neuropsychopharmacology. 2014;39:1635–1644. doi: 10.1038/npp.2014.10. [DOI] [PMC free article] [PubMed] [Google Scholar]
- Li Z, Santhanam P, Coles CD, Lynch ME, Hamann S, Peltier S, Hu X. Increased “default mode” activity in adolescents prenatally exposed to cocaine. Hum Brain Mapp. 2011;32:759–770. doi: 10.1002/hbm.21059. [DOI] [PMC free article] [PubMed] [Google Scholar]
- Lowe MJ, Beall EB, Sakaie KE, Koenig KA, Stone L, Marrie RA, Phillips MD. Resting state sensorimotor functional connectivity in multiple sclerosis inversely correlates with transcallosal motor pathway transverse diffusivity. Hum Brain Mapp. 2008 doi: 10.1002/hbm.20576. [DOI] [PMC free article] [PubMed] [Google Scholar]
- Lu H, Zou Q, Gu H, Raichle ME, Stein EA, Yang Y. Rat brains also have a default mode network. Proc Natl Acad Sci U S A. 2012;109:3979–3984. doi: 10.1073/pnas.1200506109. [DOI] [PMC free article] [PubMed] [Google Scholar]
- Margulies DS, Vincent JL, Kelly C, Lohmann G, Uddin LQ, Biswal BB, Villringer A, Castellanos FX, Milham MP, Petrides M. Precuneus shares intrinsic functional architecture in humans and monkeys. Proc Natl Acad Sci USA. 2009;106:20069–20074. doi: 10.1073/pnas.0905314106. [DOI] [PMC free article] [PubMed] [Google Scholar]
- Massimini M, Ferrarelli F, Huber R, Esser SK, Singh H, Tononi G. Breakdown of cortical effective connectivity during sleep. Science. 2005;309:2228–2232. doi: 10.1126/science.1117256. [DOI] [PubMed] [Google Scholar]
- McPherson JD, Marra M, Hillier L, Waterston RH, Chinwalla A, Wallis J, Sekhon M, Wylie K, Mardis ER, Wilson RK, et al. A physical map of the human genome. Nature. 2001;409:934–941. doi: 10.1038/35057157. [DOI] [PubMed] [Google Scholar]
- Mennes M, Zuo XN, Kelly C, Di Martino A, Zang YF, Biswal B, Castellanos FX, Milham MP. Linking inter-individual differences in neural activation and behavior to intrinsic brain dynamics. Neuroimage. 2011;54:2950–2959. doi: 10.1016/j.neuroimage.2010.10.046. [DOI] [PMC free article] [PubMed] [Google Scholar]
- Menon V. Developmental pathways to functional brain networks: emerging principles. Trends Cogn Sci. 2013;17:627–640. doi: 10.1016/j.tics.2013.09.015. [DOI] [PubMed] [Google Scholar]
- Miranda-Dominguez O, Mills BD, Grayson D, Woodall A, Grant KA, Kroenke CD, Fair DA. Bridging the gap between the human and macaque connectome: a quantitative comparison of global interspecies structure-function relationships and network topology. J Neurosci. 2014;34:5552–5563. doi: 10.1523/JNEUROSCI.4229-13.2014. [DOI] [PMC free article] [PubMed] [Google Scholar]
- Muzik O, Chugani DC, Juhasz C, Shen C, Chugani HT. Statistical parametric mapping: assessment of application in children. Neuroimage. 2000;12:538–549. doi: 10.1006/nimg.2000.0651. [DOI] [PubMed] [Google Scholar]
- Nooner KB, Colcombe SJ, Tobe RH, Mennes M, Benedict MM, Moreno AL, Panek LJ, Brown S, Zavitz ST, Li Q, et al. The NKI-Rockland Sample: A model for accelerating the pace of discovery science in psychiatry. Front Neurosci. 2012;6:152. doi: 10.3389/fnins.2012.00152. [DOI] [PMC free article] [PubMed] [Google Scholar]
- Ordaz SJ, Foran W, Velanova K, Luna B. Longitudinal growth curves of brain function underlying inhibitory control through adolescence. J Neurosci. 2013;33:18109–18124. doi: 10.1523/JNEUROSCI.1741-13.2013. [DOI] [PMC free article] [PubMed] [Google Scholar]
- Orr C, Morioka R, Behan B, Datwani S, Doucet M, Ivanovic J, Kelly C, Weierstall K, Watts R, Smyth B, Garavan H. Altered resting-state connectivity in adolescent cannabis users. Am J Drug Alcohol Abuse. 2013;39:372–381. doi: 10.3109/00952990.2013.848213. [DOI] [PubMed] [Google Scholar]
- Padmanabhan A, Geier CF, Ordaz SJ, Teslovich T, Luna B. Developmental changes in brain function underlying the influence of reward processing on inhibitory control. DevCogn Neurosci. 2011;1:517–529. doi: 10.1016/j.dcn.2011.06.004. [DOI] [PMC free article] [PubMed] [Google Scholar]
- Padmanabhan A, Luna B. Developmental imaging genetics: Linking dopamine function to adolescent behavior. Brain Cogn. 2013 doi: 10.1016/j.bandc.2013.09.011. [DOI] [PMC free article] [PubMed] [Google Scholar]
- Patel AX, Kundu P, Rubinov M, Jones PS, Vertes PE, Ersche KD, Suckling J, Bullmore ET. A wavelet method for modeling and despiking motion artifacts from resting-state fMRI time series. Neuroimage. 2014;95:287–304. doi: 10.1016/j.neuroimage.2014.03.012. [DOI] [PMC free article] [PubMed] [Google Scholar]
- Paul LK, Brown WS, Adolphs R, Tyszka JM, Richards LJ, Mukherjee P, Sherr EH. Agenesis of the corpus callosum: genetic, developmental and functional aspects of connectivity. Nature Reviews Neuroscience. 2007;8:287–299. doi: 10.1038/nrn2107. [DOI] [PubMed] [Google Scholar]
- Paus T, Keshavan M, Giedd JN. Why do many psychiatric disorders emerge during adolescence? Nat Rev Neurosci. 2008;9:947–957. doi: 10.1038/nrn2513. [DOI] [PMC free article] [PubMed] [Google Scholar]
- Perlbarg V, Bellec P, Anton JL, Pelegrini-Issac M, Doyon J, Benali H. CORSICA: correction of structured noise in fMRI by automatic identification of ICA components. Magn Reson Imaging. 2007;25:35–46. doi: 10.1016/j.mri.2006.09.042. [DOI] [PubMed] [Google Scholar]
- Petanjek Z, Judas M, Simic G, Rasin MR, Uylings HB, Rakic P, Kostovic I. Extraordinary neoteny of synaptic spines in the human prefrontal cortex. Proc Natl Acad Sci U S A. 2011;108:13281–13286. doi: 10.1073/pnas.1105108108. [DOI] [PMC free article] [PubMed] [Google Scholar]
- Petersen SE, Matthews PM, Bamberg F, Bluemke DA, Francis JM, Friedrich MG, Leeson P, Nagel E, Plein S, Rademakers FE, et al. Imaging in population science: cardiovascular magnetic resonance in 100,000 participants of UK Biobank - rationale, challenges and approaches. Journal of cardiovascular magnetic resonance: official journal of the Society for Cardiovascular Magnetic Resonance. 2013;15:46. doi: 10.1186/1532-429X-15-46. [DOI] [PMC free article] [PubMed] [Google Scholar]
- Power JD, Barnes KA, Snyder AZ, Schlaggar BL, Petersen SE. Spurious but systematic correlations in functional connectivity MRI networks arise from subject motion. Neuroimage. 2012;59:2142–2154. doi: 10.1016/j.neuroimage.2011.10.018. [DOI] [PMC free article] [PubMed] [Google Scholar]
- Power JD, Barnes KA, Snyder AZ, Schlaggar BL, Petersen SE. Steps toward optimizing motion artifact removal in functional connectivity MRI; a reply to Carp. Neuroimage. 2013;76:439–441. doi: 10.1016/j.neuroimage.2012.03.017. [DOI] [PMC free article] [PubMed] [Google Scholar]
- Power JD, Cohen AL, Nelson SM, Wig GS, Barnes KA, Church JA, Vogel AC, Laumann TO, Miezin FM, Schlaggar BL, Petersen SE. Functional network organization of the human brain. Neuron. 2011;72:665–678. doi: 10.1016/j.neuron.2011.09.006. [DOI] [PMC free article] [PubMed] [Google Scholar]
- Power JD, Fair DA, Schlaggar BL, Petersen SE. The development of human functional brain networks. Neuron. 2010;67:735–748. doi: 10.1016/j.neuron.2010.08.017. [DOI] [PMC free article] [PubMed] [Google Scholar]
- Proal E, Reiss PT, Klein RG, Mannuzza S, Gotimer K, Ramos-Olazagasti MA, Lerch JP, He Y, Zijdenbos A, Kelly C, et al. Brain gray matter deficits at 33-year follow-up in adults with attention-deficit/hyperactivity disorder established in childhood. AGP. 2011;68:1122–1134. doi: 10.1001/archgenpsychiatry.2011.117. [DOI] [PMC free article] [PubMed] [Google Scholar]
- Raznahan A, Shaw PW, Lerch JP, Clasen LS, Greenstein D, Berman R, Pipitone J, Chakravarty MM, Giedd JN. Longitudinal four-dimensional mapping of subcortical anatomy in human development. Proc Natl Acad Sci U S A. 2014;111:1592–1597. doi: 10.1073/pnas.1316911111. [DOI] [PMC free article] [PubMed] [Google Scholar]
- Redcay E, Kennedy DP, Courchesne E. fMRI during natural sleep as a method to study brain function during early childhood. Neuroimage. 2007;38:696–707. doi: 10.1016/j.neuroimage.2007.08.005. [DOI] [PubMed] [Google Scholar]
- Rudie JD, Hernandez LM, Brown JA, Beck-Pancer D, Colich NL, Gorrindo P, Thompson PM, Geschwind DH, Bookheimer SY, Levitt P, Dapretto M. Autism-associated promoter variant in MET impacts functional and structural brain networks. Neuron. 2012;75:904–915. doi: 10.1016/j.neuron.2012.07.010. [DOI] [PMC free article] [PubMed] [Google Scholar]
- Salimi-Khorshidi G, Douaud G, Beckmann CF, Glasser MF, Griffanti L, Smith SM. Automatic denoising of functional MRI data: combining independent component analysis and hierarchical fusion of classifiers. Neuroimage. 2014;90:449–468. doi: 10.1016/j.neuroimage.2013.11.046. [DOI] [PMC free article] [PubMed] [Google Scholar]
- Sanchez CE, Richards JE, Almli CR. Age-specific MRI templates for pediatric neuroimaging. Dev Neuropsychol. 2012;37:379–399. doi: 10.1080/87565641.2012.688900. [DOI] [PMC free article] [PubMed] [Google Scholar]
- Satterthwaite TD, Elliott MA, Gerraty RT, Ruparel K, Loughead J, Calkins ME, Eickhoff SB, Hakonarson H, Gur RC, Gur RE, Wolf DH. An improved framework for confound regression and filtering for control of motion artifact in the preprocessing of resting-state functional connectivity data. Neuroimage. 2013;64:240–256. doi: 10.1016/j.neuroimage.2012.08.052. [DOI] [PMC free article] [PubMed] [Google Scholar]
- Satterthwaite TD, Elliott MA, Ruparel K, Loughead J, Prabhakaran K, Calkins ME, Hopson R, Jackson C, Keefe J, Riley M, et al. Neuroimaging of the Philadelphia neurodevelopmental cohort. Neuroimage. 2014a;86:544–553. doi: 10.1016/j.neuroimage.2013.07.064. [DOI] [PMC free article] [PubMed] [Google Scholar]
- Satterthwaite TD, Wolf DH, Loughead J, Ruparel K, Elliott MA, Hakonarson H, Gur RC, Gur RE. Impact of in-scanner head motion on multiple measures of functional connectivity: Relevance for studies of neurodevelopment in youth. Neuroimage. 2012;60:623–632. doi: 10.1016/j.neuroimage.2011.12.063. [DOI] [PMC free article] [PubMed] [Google Scholar]
- Satterthwaite TD, Wolf DH, Roalf DR, Ruparel K, Erus G, Vandekar S, Gennatas ED, Elliott MA, Smith A, Hakonarson H, et al. Linked Sex Differences in Cognition and Functional Connectivity in Youth. Cereb Cortex. 2014b doi: 10.1093/cercor/bhu036. [DOI] [PMC free article] [PubMed] [Google Scholar]
- Schopf V, Kasprian G, Brugger PC, Prayer D. Watching the fetal brain at ‘rest’. Int J Dev Neurosci. 2012;30:11–17. doi: 10.1016/j.ijdevneu.2011.10.006. [DOI] [PubMed] [Google Scholar]
- Seshamani S, Cheng X, Fogtmann M, Thomason ME, Studholme C. A method for handling intensity inhomogenieties in fMRI sequences of moving anatomy of the early developing brain. Medical image analysis. 2014;18:285–300. doi: 10.1016/j.media.2013.10.011. [DOI] [PMC free article] [PubMed] [Google Scholar]
- Shaw P, Eckstrand K, Sharp W, Blumenthal J, Lerch J, Greenstein D, Clasen L, Evans A, Giedd J, Rapoport JL. Attention-deficit/hyperactivity disorder is characterized by a delay in cortical maturation. Proc Natl Acad Sci USA. 2007;104:19649–19654. doi: 10.1073/pnas.0707741104. [DOI] [PMC free article] [PubMed] [Google Scholar]
- Shaw P, Gogtay N, Rapoport J. Childhood psychiatric disorders as anomalies in neurodevelopmental trajectories. Hum Brain Mapp. 2010;31:917–925. doi: 10.1002/hbm.21028. [DOI] [PMC free article] [PubMed] [Google Scholar]
- Shmuel A, Leopold DA. Neuronal correlates of spontaneous fluctuations in fMRI signals in monkey visual cortex: Implications for functional connectivity at rest. Hum Brain Mapp. 2008;29:751–761. doi: 10.1002/hbm.20580. [DOI] [PMC free article] [PubMed] [Google Scholar]
- Siegel JS, Power JD, Dubis JW, Vogel AC, Church JA, Schlaggar BL, Petersen SE. Statistical improvements in functional magnetic resonance imaging analyses produced by censoring high-motion data points. Hum Brain Mapp. 2014;35:1981–1996. doi: 10.1002/hbm.22307. [DOI] [PMC free article] [PubMed] [Google Scholar]
- Simmonds DJ, Hallquist MN, Asato M, Luna B. Developmental stages and sex differences of white matter and behavioral development through adolescence: a longitudinal diffusion tensor imaging (DTI) study. Neuroimage. 2014;92:356–368. doi: 10.1016/j.neuroimage.2013.12.044. [DOI] [PMC free article] [PubMed] [Google Scholar]
- Sisk CL, Zehr JL. Pubertal hormones organize the adolescent brain and behavior. Front Neuroendocrinol. 2005;26:163–174. doi: 10.1016/j.yfrne.2005.10.003. [DOI] [PubMed] [Google Scholar]
- Smyser CD, Kidokoro H, Inder TE. Magnetic resonance imaging of the brain at term equivalent age in extremely premature neonates: to scan or not to scan? J Paediatr Child Health. 2012;48:794–800. doi: 10.1111/j.1440-1754.2012.02535.x. [DOI] [PMC free article] [PubMed] [Google Scholar]
- Sowell ER, Thompson PM, Holmes CJ, Jernigan TL, Toga AW. In vivo evidence for post-adolescent brain maturation in frontal and striatal regions. Nat Neurosci. 1999;2:859–861. doi: 10.1038/13154. [DOI] [PubMed] [Google Scholar]
- Spear LP. The adolescent brain and age-related behavioral manifestations. Neurosci Biobehav Rev. 2000;24:417–463. doi: 10.1016/s0149-7634(00)00014-2. [DOI] [PubMed] [Google Scholar]
- Spoormaker VI, Gleiser PM, Czisch M. Frontoparietal Connectivity and Hierarchical Structure of the Brain’s Functional Network during Sleep. Front Neurol. 2012;3:80. doi: 10.3389/fneur.2012.00080. [DOI] [PMC free article] [PubMed] [Google Scholar]
- Sporns O. Structure and function of complex brain networks. Dialogues Clin Neurosci. 2013;15:247–262. doi: 10.31887/DCNS.2013.15.3/osporns. [DOI] [PMC free article] [PubMed] [Google Scholar]
- Squeglia LM, Jacobus J, Brumback T, Meloy MJ, Tapert SF. White matter integrity in alcohol-naive youth with a family history of alcohol use disorders. Psychol Med. 2014:1–12. doi: 10.1017/S0033291714000609. [DOI] [PMC free article] [PubMed] [Google Scholar]
- Stevens MC, Pearlson GD, Calhoun VD. Changes in the interaction of resting-state neural networks from adolescence to adulthood. Hum Brain Mapp. 2009;30:2356–2366. doi: 10.1002/hbm.20673. [DOI] [PMC free article] [PubMed] [Google Scholar]
- Supekar K, Musen M, Menon V. Development of large-scale functional brain networks in children. PLoS Biol. 2009;7:e1000157. doi: 10.1371/journal.pbio.1000157. [DOI] [PMC free article] [PubMed] [Google Scholar]
- Tebbenkamp AT, Willsey AJ, State MW, Sestan N. The developmental transcriptome of the human brain: implications for neurodevelopmental disorders. Curr Opin Neurol. 2014;27:149–156. doi: 10.1097/WCO.0000000000000069. [DOI] [PMC free article] [PubMed] [Google Scholar]
- Thomason ME, Brown JA, Dassanayake MT, Shastri R, Marusak HA, Hernandez-Andrade E, Yeo L, Mody S, Berman S, Hassan SS, Romero R. Intrinsic functional brain architecture derived from graph theoretical analysis in the human fetus. PLoS ONE. 2014;9:e94423. doi: 10.1371/journal.pone.0094423. [DOI] [PMC free article] [PubMed] [Google Scholar]
- Thomason ME, Dassanayake MT, Shen S, Katkuri Y, Alexis M, Anderson AL, Yeo L, Mody S, Hernandez-Andrade E, Hassan SS, et al. Cross-hemispheric functional connectivity in the human fetal brain. Science translational medicine. 2013;5:173ra124. doi: 10.1126/scitranslmed.3004978. [DOI] [PMC free article] [PubMed] [Google Scholar]
- Thompson WK, Hallmayer J, O’Hara R. Design considerations for characterizing psychiatric trajectories across the lifespan: application to effects of APOE-epsilon4 on cerebral cortical thickness in Alzheimer’s disease. Am J Psychiatry. 2011;168:894–903. doi: 10.1176/appi.ajp.2011.10111690. [DOI] [PMC free article] [PubMed] [Google Scholar]
- Treit S, Lebel C, Baugh L, Rasmussen C, Andrew G, Beaulieu C. Longitudinal MRI reveals altered trajectory of brain development during childhood and adolescence in fetal alcohol spectrum disorders. J Neurosci. 2013;33:10098–10109. doi: 10.1523/JNEUROSCI.5004-12.2013. [DOI] [PMC free article] [PubMed] [Google Scholar]
- Tzourio-Mazoyer N, Landeau B, Papathanassiou D, Crivello F, Etard O, Delcroix N, Mazoyer B, Joliot M. Automated anatomical labeling of activations in SPM using a macroscopic anatomical parcellation of the MNI MRI single-subject brain. Neuroimage. 2002;15:273–289. doi: 10.1006/nimg.2001.0978. [DOI] [PubMed] [Google Scholar]
- Uddin LQ, Mooshagian E, Zaidel E, Scheres A, Margulies DS, Kelly AMC, Shehzad Z, Adelstein JS, Castellanos FX, Biswal BB, Milham MP. Residual functional connectivity in the split-brain revealed with resting-state fMRI. Neuro Report. 2008;19:703–709. doi: 10.1097/WNR.0b013e3282fb8203. [DOI] [PMC free article] [PubMed] [Google Scholar]
- Uddin LQ, Supekar K, Menon V. Typical and atypical development of functional human brain networks: insights from resting-state FMRI. Front Syst Neurosci. 2010;4:21. doi: 10.3389/fnsys.2010.00021. [DOI] [PMC free article] [PubMed] [Google Scholar]
- Uhlhaas PJ, Roux F, Singer W, Haenschel C, Sireteanu R, Rodriguez E. The development of neural synchrony reflects late maturation and restructuring of functional networks in humans. Proc Natl Acad Sci U S A. 2009;106:9866–9871. doi: 10.1073/pnas.0900390106. [DOI] [PMC free article] [PubMed] [Google Scholar]
- van den Heuvel MP, Sporns O. Rich-club organization of the human connectome. J Neurosci. 2011;31:15775–15786. doi: 10.1523/JNEUROSCI.3539-11.2011. [DOI] [PMC free article] [PubMed] [Google Scholar]
- Van Dijk KR, Sabuncu MR, Buckner RL. The influence of head motion on intrinsic functional connectivity MRI. Neuroimage. 2012;59:431–438. doi: 10.1016/j.neuroimage.2011.07.044. [DOI] [PMC free article] [PubMed] [Google Scholar]
- Van Essen DC, Ugurbil K, Auerbach E, Barch D, Behrens TE, Bucholz R, Chang A, Chen L, Corbetta M, Curtiss SW, et al. The Human Connectome Project: A data acquisition perspective. Neuroimage. 2012;62:2222–2231. doi: 10.1016/j.neuroimage.2012.02.018. [DOI] [PMC free article] [PubMed] [Google Scholar]
- Vincent JL, Patel GH, Fox MD, Snyder AZ, Baker JT, Van Essen DC, Zempel JM, Snyder LH, Corbetta M, Raichle ME. Intrinsic functional architecture in the anaesthetized monkey brain. Nature. 2007;447:83–86. doi: 10.1038/nature05758. [DOI] [PubMed] [Google Scholar]
- Vogel AC, Power JD, Petersen SE, Schlaggar BL. Development of the brain’s functional network architecture. Neuropsychol Rev. 2010;20:362–375. doi: 10.1007/s11065-010-9145-7. [DOI] [PMC free article] [PubMed] [Google Scholar]
- Wahlstrom D, Collins P, White T, Luciana M. Developmental changes in dopamine neurotransmission in adolescence: behavioral implications and issues in assessment. Brain Cogn. 2010;72:146–159. doi: 10.1016/j.bandc.2009.10.013. [DOI] [PMC free article] [PubMed] [Google Scholar]
- Whelan R, Watts R, Orr CA, Althoff RR, Artiges E, Banaschewski T, Barker GJ, Bokde AL, Buchel C, Carvalho FM, et al. Neuropsychosocial profiles of current and future adolescent alcohol misusers. Nature. 2014 doi: 10.1038/nature13402. [DOI] [PMC free article] [PubMed] [Google Scholar]
- Wink AM, Bullmore E, Barnes A, Bernard F, Suckling J. Monofractal and multifractal dynamics of low frequency endogenous brain oscillations in functional MRI. HumBrain Mapp. 2008;29:791–801. doi: 10.1002/hbm.20593. [DOI] [PMC free article] [PubMed] [Google Scholar]
- Wozniak JR, Muetzel RL. What does diffusion tensor imaging reveal about the brain and cognition in fetal alcohol spectrum disorders? Neuropsychol Rev. 2011;21:133–147. doi: 10.1007/s11065-011-9162-1. [DOI] [PubMed] [Google Scholar]
- Wu K, Taki Y, Sato K, Hashizume H, Sassa Y, Takeuchi H, Thyreau B, He Y, Evans AC, Li X, et al. Topological organization of functional brain networks in healthy children: differences in relation to age, sex, and intelligence. PLoS ONE. 2013;8:e55347. doi: 10.1371/journal.pone.0055347. [DOI] [PMC free article] [PubMed] [Google Scholar]
- Yan CG, Cheung B, Kelly C, Colcombe S, Craddock RC, Di Martino A, Li Q, Zuo XN, Castellanos FX, Milham MP. A comprehensive assessment of regional variation in the impact of micromovement head motion on functional connectomics. Neuroimage. 2013;76C:183–201. doi: 10.1016/j.neuroimage.2013.03.004. [DOI] [PMC free article] [PubMed] [Google Scholar]
- Yang Z, Xu Y, Xu T, Hoy CW, Handwerker DA, Chen G, Northoff G, Zuo XN, Bandettini PA. Brain network informed subject community detection in early-onset schizophrenia. Scientific reports. 2014;4:5549. doi: 10.1038/srep05549. [DOI] [PMC free article] [PubMed] [Google Scholar]
- Yap PT, Fan Y, Chen Y, Gilmore JH, Lin W, Shen D. Development trends of white matter connectivity in the first years of life. PLoSONE. 2011;6:e24678. doi: 10.1371/journal.pone.0024678. [DOI] [PMC free article] [PubMed] [Google Scholar]
- Yendiki A, Koldewyn K, Kakunoori S, Kanwisher N, Fischl B. Spurious group differences due to head motion in a diffusion MRI study. Neuroimage. 2013;88C:79–90. doi: 10.1016/j.neuroimage.2013.11.027. [DOI] [PMC free article] [PubMed] [Google Scholar]
- Zang Y, Jiang T, Lu Y, He Y, Tian L. Regional homogeneity approach to fMRI data analysis. Neuroimage. 2004;22:394–400. doi: 10.1016/j.neuroimage.2003.12.030. [DOI] [PubMed] [Google Scholar]
- Zang YF, He Y, Zhu CZ, Cao QJ, Sui MQ, Liang M, Tian LX, Jiang TZ, Wang YF. Altered baseline brain activity in children with ADHD revealed by resting-state functional MRI. Brain Dev. 2007;29:83–91. doi: 10.1016/j.braindev.2006.07.002. [DOI] [PubMed] [Google Scholar]
- Zeng LL, Wang D, Fox MD, Sabuncu M, Hu D, Ge M, Buckner RL, Liu H. Neurobiological basis of head motion in brain imaging. Proc Natl Acad Sci U S A. 2014;111:6058–6062. doi: 10.1073/pnas.1317424111. [DOI] [PMC free article] [PubMed] [Google Scholar]
- Zou QH, Zhu CZ, Yang Y, Zuo XN, Long XY, Cao QJ, Wang YF, Zang YF. An improved approach to detection of amplitude of low-frequency fluctuation (ALFF) for resting-state fMRI: fractional ALFF. J Neurosci Methods. 2008;172:137–141. doi: 10.1016/j.jneumeth.2008.04.012. [DOI] [PMC free article] [PubMed] [Google Scholar]
- Zuo XN, Ehmke R, Mennes M, Imperati D, Castellanos FX, Sporns O, Milham MP. Network centrality in the human functional connectome. Cereb Cortex. 2012;22:1862–1875. doi: 10.1093/cercor/bhr269. [DOI] [PubMed] [Google Scholar]
- Zuo XN, Kelly C, Di Martino A, Mennes M, Margulies DS, Bangaru S, Grzadzinski R, Evans A, Zang Y, Castellanos FX, Milham MP. Growing together and growing apart: Regional and sex differences in the lifespan developmental trajectories of functional homotopy. J Neurosci. 2010;30:15034–15043. doi: 10.1523/JNEUROSCI.2612-10.2010. [DOI] [PMC free article] [PubMed] [Google Scholar]
- Zuo XN, Xing XX. Test-retest reliabilities of resting-state FMRI measurements in human brain functional connectomics: A systems neuroscience perspective. Neurosci Biobehav Rev. 2014;45C:100–118. doi: 10.1016/j.neubiorev.2014.05.009. [DOI] [PubMed] [Google Scholar]
- Zuo XN, Xu T, Jiang L, Yang Z, Cao XY, He Y, Zang YF, Castellanos FX, Milham MP. Toward reliable characterization of functional homogeneity in the human brain: Preprocessing, scan duration, imaging resolution and computational space. Neuroimage. 2013;65:374–386. doi: 10.1016/j.neuroimage.2012.10.017. [DOI] [PMC free article] [PubMed] [Google Scholar]