

Abstract
Endothelial cells lining myocardial capillaries not only impede transport of blood solutes to the contractile cells, but also take up and release substrates, competing with myocytes. Solutes permeating this barrier exhibit concentration gradients along the capillary. This paper introduces a generic model, GENTEX, to characterize blood–tissue exchanges. GENTEX is a whole organ model of the vascular network providing intraorgan flow heterogeneity and accounts for substrate transmembrane transport, binding and metabolism in erythrocytes, plasma, endothelial cells, interstitial space and cardiomyocytes. The model is tested here for the analysis of multiple tracer indicator dilution data on purine nucleoside metabolism in the isolated Krebs–Henseleit-perfused non-working hearts. It has been also used for analysing NMR contrast data for regional myocardial flows and for positron emission tomographic studies of cardiac receptor kinetics. The facilitating transporters, binding sites and enzymatic reactions are nonlinear elements and allow competition between substrates and a reaction sequence of up to five substrate–product reactions in a metabolic network. Strategies for application start with experiment designs incorporating inert reference tracers. For the estimation of endothelial and sarcolemmal permeability-surface area products and metabolism of the substrates and products, model solutions were optimized to fit the data from pairs of tracer injections (of either inosine or adenosine, plus the reference tracers) injected under the same circumstances a few minutes later. The results provide a self-consistent description of nucleoside metabolism in a beating well-perfused rabbit heart, and illustrate the power of the model to fit multiple datasets simultaneously.
Keywords: purine nucleoside metabolism, convection–diffusion–reaction model, GENTEX, axially distributed blood–tissue exchange processes, constrained parameter estimation, simultaneous optimization
1. Introduction
In this study, we focus on the presentation of a multifaceted generalized blood–tissue exchange (BTEX) model for whole organ studies, GENTEX, extending previous models by increasing the numbers of cell types and accounting for nonlinear competitive processes for transport, binding and reaction. Interaction between different cell types is now recognized as important to the normal functioning of cells in tissues and organs. The role of endothelial cells in modulating the function of vascular smooth muscle cells and cardiomyocytes has been elucidated in increasing detail in the last decades, linking cell–cell exchange of metabolic and signalling solutes, receptor activation and metabolic responses. The model is a convection–diffusion–transport–reaction model allowing exchanges and metabolism among three cell types, red blood cells (RBC), endothelium and parenchymal cells, the interstitial space and the plasma space (figure 1). For illustration of the model capabilities and the strategies for its use in data analysis, we show its application to a small facet of the purine nucleoside interactions relating reactions and signalling in the microvasculature of the heart.
Figure 1.

The parameter entry interface for one substrate’s capillary blood–tissue exchange (BTEX) unit of the generic multiscale multicapillary model, GENTEX. Each unit accounts for 12 species (intravascular and extracellular reference tracers and five dual (tracer and non-tracer chemical) reacting species that enter cells of any of the three types shown, RBC, endothelial and parenchymal cells), using the illustrated generic five-region, four-barrier model for blood–tissue exchange. Parameter symbols are defined in the text. The analysis used a set of such modules in parallel to account for the normal myocardial flow heterogeneity.
The presence of endothelial cells between the blood and the cardiomyocyte complicates the interpretation of data from whole organ studies simply because the endothelial barrier hinders the diffusion or permeation of any solute exchanging between blood and the interstitial fluid. Hydrophilic solutes traverse the interendothelial clefts, while lipid soluble ones can penetrate the cell membranes. Thus, image sequences from PET and NMR, and indicator dilution techniques, in general, require modelling to parse and parameterize the kinetics of the exchanges from observations of either washin and washout curves obtained by external detection or of inflow/outflow concentration–time curves.
The application of the model to purine nucleoside metabolism (see figure 2 for the intracellular reactions) in the heart is chosen, because this area of our laboratory’s research drove the development of the model, and because the multiple-indicator dilution (MID) technique provides an abundance of data for several solutes simultaneously, data which heavily constrain the parameterization of the model. Gorman et al. (1986) demonstrated in skeletal muscle, as did Wangler et al. (1989) in guinea-pig hearts, that capillary endothelial cells avidly take up and metabolize 3H-Ado, releasing a set of tracer-labelled metabolites, and in the process strikingly reduce the fraction of arterial tracer adenosine (Ado) that reaches the muscle cells. The first metabolic product of Ado metabolism is inosine (Ino), using the same transporter to escape from the cell as is the vehicle for Ado’s entry. Schwartz et al. (1999) showed that in the guinea-pig heart, uric acid (UA) was the dominant end product. In the rabbit heart, hypoxanthine (Hx) production dominated and there was no significant production of either xanthine (Xa) or UA; this fitted Downey et al.’s (1987) observation that there is no xanthine oxidase in rabbit heart.
Figure 2.

Metabolic reactions for purine nucleosides in cardiac endothelial cells and in cardiomyocytes. Each enzyme (listed with enzyme number) binds substrate, and in the case of xanthine oxidase may bind the intermediate product xanthine. A few of these reactions also take place extracellularly, for example there is an ectodeaminase converting Ado→Ino, but no nucleoside phosphorylase. Interstitial ATP and ADP can be hydrolysed by alkaline phosphatase located near the upstream ends of capillaries.
The anatomy (Yipintsoi et al. 1972; Bassingthwaighte et al. 1974; Stoker et al. 1982; Vinnakota & Bassingthwaighte 2004), and the pioneering methods of analysis of capillary–tissue exchange by Krogh (1919) and Sangren & Sheppard (1953), led to analyses of indicator dilution data on the purine nucleosides (Gorman et al. 1986; Wangler et al. 1989; Schwartz et al. 1999, 2000) that took into account (i) that the capillary–tissue exchange region is axially extended, 200 times as long as its diameter, requiring the use of partial differential equations to model transport along the capillary and (ii) that the capillary endothelium provides two parallel paths for purine nucleoside to travel between blood and myocytes: the paracellular or interendothelial cleft pathway for passive diffusion, and the transcellular route crossing both luminal and abluminal surfaces of the endothelial cell and entry into cardiomyocytes by the carrier-mediated, saturable transporter (figure 1). In modern MID experiments, an inert extracellular reference tracer is chosen to match the size and charge of the substrate under study, in this case Ado and Ino, and so distinguish the fraction of tracer traversing the paracellular (with permeability-surface area PSg) from the transporter-mediated path (with permeability-surface areas PSecl and PSeca in series to cross the endothelium). The prior studies referred to here did not address the issue of the fate of the purine nucleosides and their metabolites within endothelial cells and cardiomyocytes. In this study, the whole organ model is shown to provide a comprehensive analysis of the kinetics particularly of the blood–endothelial part of purine nucleoside metabolism, diagrammed for the intracellular reactions in figure 2.
2. The whole organ blood–tissue exchange model, GENTEX
The MID experiment is an input/output study and requires accounting for the whole organ. It is more powerful than a PET or NMR study, in that those techniques permit the examination of only one solute at a time, using external detection, but all three techniques are based on the same principles. Because the kinetics are due to convection, permeation, diffusion, transmembrane transport and intracellular reaction, the generic model, GENTEX, is necessarily a multiscale, multicomponent construct. It includes:
vascular transport in arteries and veins (King et al. 1993), with subsets of arterioles and venules having differing flows to account for heterogeneity in regional myocardial blood flows (King et al. 1985, 1993). This is done by having up to 20 independent capillary–tissue exchange units, each differing from the others only with respect to the local flow, important for a wide range of small hydrophilic solutes (Goresky 1963; Bassingthwaighte 1970; Kuikka et al. 1986) in the heart. The experimentally observed probability density functions of regional flows are represented by a weighting function approximating the distribution around the known mean flow, using only enough paths, often only 5 or 7, to capture the form of the distribution;
axially-distributed BTEX units accounting for intravascular and extravascular concentration gradients (figure 1), and allowing axial diffusion in all regions;
BTEX units composed of five regions radially: RBC, plasma (p), endothelial cells (ec), interstitial fluid space (isf), the parenchymal cells (pc) and the cardiomyocytes;
transmembrane transport by facilitated, competitive or passive transport parameterized by permeability-surface area products (PS);
reactions first order or enzymatically facilitated. These may be isolated for each solute or in sequences or in branched paths with intracellular sequestration as for Ado entering into the ATP pool;
adsorption to ligand-specific intracellular binding sites for each reactant.
Thus, GENTEX handles up to five metabolizing substrates, either as individual species or up to five reacting species in series. The model includes two additional reference species to provide controls essential for MID data analysis, an intravascular reference tracer constrained to the blood space only, and an extracellular reference tracer limited to the plasma space and to permeation through the interendothelial clefts to the interstitial space. An RBC label such as Cr-labelled haemoglobin can serve as an additional reference tracer. Each of the five reacting species is modelled for both non-tracer and tracer species, allowing specification of the specific activity of each tracer, and accounting for competition between tracer and mother substance. Thus, the total number of species handled as the central time and space-dependent variables is 12. Parameters, including flow, are considered as constants, some of which are measured and others to be estimated from the data.
The individual BTEX unit model is an extension of that of Bassingthwaighte et al. (1989), adding the erythrocytes and accounting for RBC and plasma velocities separately to account for haematocrit reduction in microvessels. The input to each BTEX unit is by convection into the upstream end of the capillary. Model assumptions are: steady flow, rapid relaxation of radial concentration gradients in each physical region (perpendicular to the direction of flow), spatially uniform coefficients for permeation, diffusion and consumption. These account for conductances, PS, across the barriers between the regions, the regional volumes of distribution (V′), the dispersion in the axial direction (D) and consumption (G). Each PS and G can be modified at runtime to choose a more complex algorithm for carrier-mediated transport or enzymatically facilitated reaction. The V’s can be modified to account for concentration-dependent binding processes. The model accounts for chemical reactions accounting for mass balance and concentration-dependencies in reactions, binding and transporter-mediated permeation. The tracer submodel uses linear coefficients slaved from the parent chemical model for each reactant species.
Parameters used in fitting the data (figure 1) are defined as follows:
Fp flow of solute-containing plasma or perfusate (ml g−1 min−1)
PSRBC permeability-surface area product for erythrocytes (ml g−1 min−1)
PSg permeability-surface area product for passive transport through the gaps or clefts between adjacent endothelial cells (ml g−1 min−1)
PSecl permeability-surface area product for endothelial cell luminal surface (ml g−1 min−1)
PSeca abluminal endothelial permeability-surface area product (ml g−1 min−1; assumed = PSecl)
PSpc permeability-surface area product for parenchymal cells (myocytes; ml g−1 min−1)
Greg regional consumptions, or gulosities (ml g−1 min−1). The reaction may beMichaelis–Menten or first order. The subscript ‘reg’ for region refers to RBC, p, ec, isf or pc
Dreg diffusion coefficient (cm2 s−1) in the axial direction within a region
Vp intracapillary plasma volume (ml g−1) , virtual volumes of distribution (ml g−1) of erythrocytes, endothelial cells, interstitial space and parenchymal cells. A virtual volume will exceed the actual volume if its equilibrium total concentration (of bound + free solute) is higher than in the plasma, which is the reference space. Numerically, , where λ is a partition coefficient, λ = Creg/Cp at equilibrium.
The regional concentrations, Creg(x, t), mol ml−1, are a function of capillary axial position, x, and of time, t. The equation for the concentration of a solute along the capillary plasma is
| (2.1) |
in the erythrocytes,
| (2.2) |
in the endothelial cells,
| (2.3) |
in the interstitial fluid,
| (2.4) |
and in the parenchymal cells,
| (2.5) |
L is a capillary length, in the heart averaging 0.8 mm, and a position x/L is a fraction of the capillary length. The erythrocyte velocity, FRBCL/VRBC, is faster than plasma velocity, because the intracapillary haematocrit, Hctcap = VRBC/(Vp + VRBC) is less than the large vessel haematocrit, HctLV. This excess RBC velocity, measurable in vessels less than 200 μm in diameter, persists even into capillaries, where there is an RBC-free layer of plasma within the endothelial glycocalyx lining the capillaries (Vink & Duling 1996). The direct path through the gaps between the endothelial cells, allowing direct plasma–isf exchange, PSg, bypassing the endothelial cells, makes this model different from the one with a set of concentric volumes.
The transmembrane transport, the PS’s, may be passive linear conductances (as in the equations above), or via a facilitating transporter (figure 3) with or without competition between solute species, as, for example, between Ado and Ino. The consumption coefficients, the G’s with the units of a clearance, ml g−1 min−1 like the PS products and the flow, may be first-order rate constants as implied by the form of the equations, or may use Michaelis–Menten enzymatic kinetics of simple form or in competition with another solute. In addition, to account for other reactions, the product of a reaction may have a fraction sequestered within the region or more than one product formed. For the Ado→Ino→Hx→Xa→UA intracellular reaction sequence (figure 2), we considered the following: a fraction of the Ado consumption, fADO goes to Ino, and the remaining fraction (1−fADO) goes through the Ado kinase reaction to AMP to be sequestered in a very large ATP pool (7 mM compared to the normal ambient Ado intracellular pool of less than 10 nM). Adenosine could also be sequestered as S-adenosylhomocysteine if there were a high homocysteine concentration in the perfusate, as is used for the purpose of PET imaging of hypoxic regions (Deussen et al. 1988).
Figure 3.

Competitive transporter kinetics. Solutes S1 and S2 compete for the binding site on the transporter and may have differing affinities and translocation rates. At high substrate concentrations on both sides, this transporter becomes an obligatory counter-transporter, forcing one-to-one exchange. The P’s are unidirectional permeabilities (cm s−1), and in the model are multiplied by membrane surface area, the Kd’s are dissociation constants (Molar) and the TS’s and T’s are the concentrations of transporter in the three forms on either one side of the membrane or the other, with units of concentration in moles per unit surface area on each side.
Ino produces Hx, with no branch path, and a fraction fHx of Hx→Xa, while a smaller fraction (1−fADO) goes to form inosine monophosphate (IMP), the purine salvage pathway. The binding reactions may be a first-order binding to a single site (Langmuir adsorption) or competitive binding of two or more substrates to a site. The binding reactions may assume equilibrium or slow adsorption and release.
The versatility of the model is facilitated by having the parameters entered via buttons on the display of each of the levels of the model, so the user can see the values and change any of them at each run.
(a) Computational methods
The numerical methods are described in detail by Bassingthwaighte et al. (1992). The spatial resolution, using finite elements, is determined by the number of segments, Nseg, chosen. The flow algorithm uses a Lagrangian sliding fluid element, whereby the time-step and the space step are matched, Δt = (Vp/Nseg)/Fp (Bassingthwaighte 1974). A user may also choose as an alternative a serial stirred tank algorithm, whereby dispersion along the capillary is represented by a Poisson process. Both of these flow algorithms account for concentration gradients along the length of the capillary. The Lagrangian method requires fewer elements to account for the gradients accurately, but if very few are used the output concentrations appear in steps, with the step duration Δt. The Poisson algorithm is less efficient because it requires a large number of segments (over 25) to match the gradients and the dispersion correctly.
Efficiency in computation is achieved by removing computation for any regions not being used. For example, when the permeability for a given reactant into the parenchymal cells is set to zero, the equations for the transport, reaction, binding and diffusion inside the cell are not computed. The model can be reduced to a single stirred tank or expanded up to the maximum Nseg of 60 axial segments, times the maximum number of 20 parallel paths, times the maximum number of species bringing the computation to a total of 107 040 differential equations.
In normal usage for the analyses of five reactant tracer species and two reference tracers, it required about 40 s on a laptop computer to get single run solutions to match data acquired over 2 min of outflow sampling, using the Lagrangian flow algorithm, Nseg = 15 axial segments, five different flow paths. Automated parameter optimization for a single dataset took about 10 min, but a much longer and more variable time to fit multiple datasets simultaneously. The model can be run on Unix or Linux systems under XSIM and under a new simulation system, JSim (available at http://nsr.bioeng.washington.edu).
3. Experimental methods
The experimental studies analysed here are designed to examine the transport and metabolism of tracer Ado and Ino in the hearts of rabbits and guinea-pigs. The quantitation of the kinetics of endothelial transport and metabolism provides parameter values to be used elsewhere in studies of non-tracer observations by NMR or chemical measurement. The analyses here account for transport and metabolism in cardiac capillary endothelial cells and cardiomyocytes in the intact heart functioning in perfuso, using high-resolution MID tracer studies to obtain estimates of the permeability-surface area products for the clefts separately from those for the transporters. The MID methodology is suited for eliciting information on fast reaction rates or transfer rates when used in conjunction with modelling analysis for BTEX processes (Bassingthwaighte & Sparks 1986; Bassingthwaighte et al. 1989). Parametric resolution is higher for endothelial cells than for myocytes, because while all of the intravascularly injected tracer is available to endothelial cells, only a modest fraction reaches the cardiomyocytes, and an even smaller fraction of that returns to the outflow to provide kinetic characterization. The results of this modelling analysis have applications as far ranging as the interpretation of NMR data on myocardial phosphate metabolism and PET observations on the uptake of thymidine.
The experiments used tracer injections of Ado, Ino, Hx or Xa to determine the kinetics of the reaction system shown in figure 2. The set of reactant and reference tracers were injected into the coronary inflow in isolated, Krebs–Ringer bicarbonate buffer-perfused heart of rabbits and guinea-pigs, as described in detail by Schwartz et al. (1999, 2000), Kroll et al. (1992) and Kroll & Bassingthwaighte (1998), while the theoretical base is provided by Bassingthwaighte & Goresky (1984; Bassingthwaighte et al. 1998). A diagram of the experimental setup (illustrating an experiment for the reactions of Hx to Xa to UA) is shown in figure 4.
Figure 4.

Procedures for the multiple-indicator dilution experiment where multiple metabolites are produced. Following a bolus injection of 14C-hypoxanthine and tracer-labelled reference solutes into the inflow of an isolated perfused heart, samples of the effluent were collected each second. The samples are split, analysed first for activity of 131I-albumin (intravascular indicator) using a gamma scintillation counter, and then analysed using HPLC (high performance liquid chromatography) to separate the chemical constituents. Liquid scintillation counting gives the concentrations of 3H-L-glucose (the extracellular marker) and of the 14C-carbon in the form of the originally injected Hx and its separated degradation products Xa and UA. The inset shows an example pair of albumin and L-glucose outflow dilution curves.
The intravascular reference tracer was 131I-albumin (MW = 68 000). For the extracellular tracer, we used an analogue of Ado of the same MW, but one that is restricted to the extracellular region, 9-β-D-arabinofuranosyl hypoxanthine (AraH, MW = 267); this gave us the PSg, the capillary cleft pathway permeability for AraH, Ado and Ino, and the volumes of distribution for these three in the interstitial fluid . In Hx studies, the extracellular reference tracer was L-glucose, as in figure 4, because of its closeness to the MW of Hx.
Tracer recoveries, for checking mass balance from inflow to outflow, were 95–99.5%. MID curves from two experiments, on a rabbit heart and a guinea-pig heart, are shown in figure 5.
Figure 5.

Adenosine (Ado) transport and transformation in isolated, perfused (a) rabbit and (b) guinea-pig heart. (a, b) Normalized outflow dilution curves for [14C]-Ado and the two reference tracers, [131I]-albumin (intravascular) and [3H]-AraH (extracellular); model solutions shown by lines were obtained using a single path four-region BTEX model (Bassingthwaighte et al. 1989). (c, d) Semilog plots of Ado and its metabolites, Ino, hypoxanthine (Hx), xanthine (Xa) and uric acid (UA), in the outflow. The Ado curves are the same as in (a, b). Lines joining data points are not model solutions. The striking differences between the two species is that Xa and UA are produced in the guinea-pig, but not in the rabbit, which lacks xanthine oxidase in endothelial cells. Curves labelled UA and Xa from the rabbit (c) are not analysable, being indistinguishable from isotope counting noise. (From Schwartz et al. (1999), with the permission of the American Physiological Society.)
(a) Methods for the modelling analysis of the data
(i) Data analysis
Each dilution curve was normalized with respect to injected activity and expressed as the fraction of injected tracer emerging per second, h(t) (Kuikka et al. 1986). The area of the outflow dilution curve and the mean transit time through the heart for each tracer were calculated from each of the normalized h(t) curves. Extractions of AraH and the primary substrate in the injectate, Ado, Ino, or Hx in the individual runs, were calculated from the data using the formula E(t) = 1−hD(t)/hR(t), where E(t) is the instantaneous extraction at time t, hD(t) is the fraction of permeating tracer exiting per unit time and hR(t) is that for the intravascular plasma reference tracer. The earlier values of E(t) on the upslope and peak of hR(t) were used to give an initial estimate of the capillary permeability-surface area product PSC, for the permeating tracers in the injectate, using the Crone–Renkin equation (Crone 1963),
| (3.1) |
where Emax is the maximal instantaneous extraction, estimated by smoothing through the peak of the curve of E(t). When there is no return flux from tissue to capillary perfusate, then and only then PSC represents the conductance for a unidirectional flux and equals the sum of PSg + PSecl, i.e. the sum of permeability-surface area products for the luminal surface of endothelial cells plus that of the gaps between adjacent endothelial cells.
Optimization analysis of the indicator dilution curves used the GENTEX model, which accounts for bidirectional fluxes across all of the membranes. The degree of regional flow heterogeneity was taken from microsphere deposition or molecular microsphere experiments on rabbit hearts of Gonzalez & Bassingthwaighte (1990), using a five-pathway system to provide a truncated Gaussian distribution of regional flows, in line with the approach detailed by Bassingthwaighte & Goresky (1984) and King et al. (1996).
(ii) Haemodynamic data
Perfusate flow averaged 4.5±0.2 ml g−1 min−1 for rabbits and 5.0±0.4 ml g−1 min−1 for guinea-pigs. These flows are suitable for providing oxygenation for these beating hearts that do no external work, and the perfusion pressures (42±1 mmHg for rabbits, 35±2 for guinea-pigs) were low enough to prevent higher levels of oedema.
(iii) Volume estimates
Intravascular volume Vp was estimated from vascular casting techniques to be about 0.07 ml g−1 in the heart (an approximation for capillary density of about 3000 mm−2 with average diameters of 5.6 μm, e.g. from Bassingthwaighte et al. (1974)). Wangler et al. (1989) showed that substantial variation in the value taken for Vp has little influence on the estimates of the other parameters, so Vp was assumed to be constant: we used Vp = 0.06 ml g−1 instead of 0.07 ml g−1 in order to compensate for the low perfusion pressures in the preparation. The other volumes were given fixed values in accord with the total water space of 0.83 ml g−1: and . The values for total water space and are larger and smaller than in vivo (Gonzalez & Bassingthwaighte 1990) because of interstitial swelling (Kuikka et al. 1986), and are in accord with the estimates by Vinnakota & Bassingthwaighte (2004) for rat heart, using mass, volume and density conservation equations.
(iv) Defining the input function
The input function was not recorded directly in these studies in the interest of minimizing artefacts between the injection site and the heart, and maintaining fluid flow at a constant level. The 131I-albumin curve could have been used as the basis for a deconvolution to define the input function (Kuikka et al. 1986), but we elected for this analysis to use a stronger, forward technique by generating a mathematical analogue to the input function from a lagged normal density curve (Bassingthwaighte et al. 1966) augmented by a multi-exponential tail, and then adjusting its parameters to match the observed experimental 131I-albumin curve, or both the albumin and the AraH curves together. The two-curve fitting procedure has the advantage of using 120 data points from the two dilution curves instead of only the 60 albumin points, but two more parameters, PSg and Visf, for AraH have to be estimated as a part of the input curve computation. Nevertheless, this reduces the degrees of freedom in estimating the input function since the input function itself has four parameters, so the ratio of data points to free parameters is increased from 60/4 to 120/6, i.e. from 15 to 20 data points per parameter. This, of course, also increases the efficiency in optimizing the model solution fits to the data, since the AraH curve is fitted in the two-curve fitting for the input function.
The fitting of the indicator dilution curve for the extracellular reference, AraH, uses only a two-region capillary–isf model, allowing permeation only through the interendothelial cellular clefts and giving estimates of PSg. The values we used for in these KRB-perfused hearts are larger than for the intact animal blood-perfused hearts of Gonzalez & Bassingthwaighte (1990), which averaged 0.18 ml g−1. Extremely large values have been observed sometimes for sucrose (extravascular) space, for example, by Vargas & Johnson (1964, 1967), up to 0.45 ml g−1 in rabbit hearts perfused without any albumin in the perfusate. To avoid this problem, our perfusate contained 0.1% albumin, enough to maintain the capillaries intact (Kellen & Bassingthwaighte 2003). Because accuracy of the estimates of from AraH was possibly compromised by some interstitial binding of AraH, and because the sensitivity of transmembrane transport parameters of Ino and Ado is almost unaffected by even 20% error in estimates of (Bassingthwaighte et al. 1989), we used without adjustment.
Ado and Ino data curves were fitted using the PSg (AraH). For Hx (MW = 134), the extracellular reference solute was L-glucose (MW = 180), and the assumed PSg for Hx was (134/180)1/2 times PSg(L-glucose), used in separate experiments (not reported here) to correct for the difference in MWs. Owing to the high rates of intraendothelial uptake or conversion of Ado and Ino, values for the conductance across the abluminal surface of the endothelial cell, PSeca, could not be determined accurately, but were within 1–10 times those of PSecl; so we arbitrarily fixed PSeca = PSecl. The free parameters optimized were PSecl, PSpc and the values for the consumption, Gec and Gpc. Of these, PSecl is well determined and Gec only slightly less so (Bassingthwaighte et al. 1989, 1992), while PSeca, PSpc and Gpc are estimated with less accuracy. Using a single path GENTEX gives estimates of parameters essentially similar to those reported by Schwartz et al. (1999) for the data in figure 5a,b, affirming expectations.
The current validation test of GENTEX as a hypothesized model is considerably more demanding, namely to provide an explanation or description of two large datasets simultaneously, one set of five curves following Ado injection and the other of four curves following Ino injection, a total of nine curves or 540 data points. The test data were those of the Ado injection experiment in figure 5c and the experiment immediately preceding it using Ino as the primary substrate in the injectate. The flows were the same at the two times. The optimization was initially applied to one set of curves, obtaining preliminary parameter estimates, then the other set, starting with initial parameter values from the first set. GENTEX is not large enough to handle all nine sets of curves simultaneously, so varied subsets of the nine were parameterized. Following a few iterations giving partial convergence toward each of the experiments’ common set of parameters, varied arrangements of partial sets of curves from the two experiments were used together in one GENTEX model and optimized to further improve convergence toward a single common parameter set fitting all of the curves from the two experiments. This was repeated until no further improvement occurred.
4. Results
(a) Model fitting to the outflow dilution data
Fits of the model to the data from both species were obtained. The initial estimates for the reference tracers and the tracer-labelled adenosine and inosine were obtained as reported by Schwartz et al. (1999, 2000), but were further refined by the methods described previously. The fitting of the vascular (albumin) and extracellular (AraH) reference curves defined certain parameters for the purine nucleosides and their reaction products. These were (i) the form of the input function, the effective heterogeneity of the regional flows and the parameters for intravascular delay and dispersion between inflow and outflow from the organ and (ii) the permeability-surface area product for the interendothelial clefts, PSg, the effective volume of the interstitial space and the dispersion of the solute throughout the length of this region. This reduces the degrees of freedom and constrains the remaining parameters for the injected purine nucleosides to those for cellular permeabilities and for rates of the intracellular reactions. Constraints on the parameters for the reaction products are provided by (i) and (ii) and also by the total tracer recovery, i.e. the sum of all the injected 14C-carbon appearing in the outflow. The remaining free parameters for the injected metabolized tracer are for transport into and out of the cells and for intracellular reactions: PSecl and PSeca, Gec, PSpc and Gpc. These same parameters must be estimated for each of the subsequent reaction products, omitting Gec and Gpc when there are no further reactions. Hypoxanthine cannot only escape from the cells, but may also be retained via phosphorylation to form IMP (figure 2).
Results of the modelling analysis for the rabbit data are shown in figure 6 for the effluent curves following Ado and Ino injections. When only one experiment at a time was fitted by the model, the curve fits were substantially better than those shown in figure 6, as is expected since the curves of one experiment are obtained simultaneously, while changes in physiology and in the shapes of the input functions occur between experiments. Nevertheless, the fitting is very good over the major parts of the curves. The misfitting of the albumin curves is inevitable since they were quite different for figure 6a,b, but had to be fitted, for this approach, by the same input function; the result is that the model curve for the tail of the albumin data (identical for figure 6a,b) is too high in figure 6a but too low in figure 6b. This irreconcilable disparity in the two albumin curves was not reflected in related disparities in the fitting of the curves for AraH or the purine nucleosides, which are seen to be well fitted by the model.
Figure 6.

Modelling analysis of MID data following injection of tracer (a) Ino and (b) Ado into the coronary inflow of an isolated Krebs–Ringer perfused rabbit heart. The model analysis used one common set of parameters (table 1) to fit all of the curves in (a) and (b).
Parameters for these rabbit heart analyses are provided in table 1. The conditions of the experiment, where background levels of non-tracer substances in the inflow were zero, and the specific activity of the tracer-labelled solutes was high, the chemical concentrations of Ado, Ino, etc. reaching the membrane and intracellular proteins was so low that there would be no direct competition between tracer solutes and mother substances for attachment to solute-specific sites on transporters, receptors, enzymes, or other binding sites. The estimates thus obtained will give maximal values for transport rates and consumptions. The receptor binding for Ado has not been accounted for, so for any binding there will be masked as an enlargement of its volume of distribution or potentially as a small contribution to the consumption term. This can actually amount to a significant fraction of the tracer dose, because the receptors are in the interstitial space on smooth muscle cells; therefore, competing with the transporter for the free Ado.
Table 1.
Parameters for rabbit heart analysis.
| parameter | units | Ado | Ino | Hx |
|---|---|---|---|---|
| PSg | ml g−1 min−1 | 3.70±0.01 | 3.70±0.01 | 5.18±0.01 |
| PSec | ml g−1 min−1 | 0.35±0.01 | 0.16±0.002 | 2.0±0.67 |
| Gec | ml g−1 min−1 | 22.7±11.2 | 3.14±0.19 | 2.37±0.49 |
| Kd/Btot(ec) | non-dimensional | 0.98±0.46 | 163.3±37.2 | 10.32±3.54 |
| Gisf | ml g−1 min−1 | 0.54±0.005 | ||
| PSpc | ml g−1 min−1 | 10.2±0.076 | 8.09±0.04 | 4.85±0.23 |
| Gpc | ml g−1 min−1 | 15.5±9.58 | 0.055±0.002 | 0.54±0.11 |
| Kd/Btot(pc) | non-dimensional | 8.41×10⁻⁴±9.4×10⁻⁶ | 5.62±0.03 | 1.83±0.10 |
| %ATP(ec) | non-dimensional | 77±0.50% | ||
| %ATP(pc) | non-dimensional | 11±55.3% |
(b) Goodness of fit
The covariance matrix of the optimization parameters, Cov(P), can be estimated by the Hessian matrix at the optimized solution point in parameter space. When residuals are small, the right-hand side of the following equation is an approximation to the covariance matrix (Chan et al. 1993):
where SSR(P) is the sum of the squares of the residuals, m−p is the degrees of freedom, W is the weight matrix, taken here to be the identity matrix and S(P) is the sensitivity matrix, taken to be the log-sensitivity, written in finite difference forms as
where hi are the model values corresponding to the data values at each time ti, and ΔPj/Pj is the fractional difference in the parameter value, usually 1 or 0.1%. The 95% confidence intervals for the parameters are calculated from the covariance matrix and are given in table 1.
Other parameter values were Fp = 3.86 ml g−1 min−1, Vp = 0.06 ml g−1 min−1, . The %ATP (ec or pc) given in the bottom two rows of table 1 are the fractions of Ado retained in the cells at the end of the 2 min data collection.
Table 1 shows that parameter values governing the kinetics occurring close to the intracapillary region carrying the tracers, PSg and PSec, are narrowly constrained as far as the optimization is concerned. Consumption terms, the G’s, are much less strictly bounded, though much more so for Ino than for Ado. The reason for this is obvious when one puts these figures together with the reaction diagram of figure 2: there is only one forward reaction Ino→Hx, so that the consumption of Ino governs the production of Hx, most of which appears in the effluent. For Ado, the situation is more complex, for most of it is incorporated into AMP and then ATP, both of which remain intracellular and neither of which returns a significant amount of tracer-labelled Ado to be washed out or further reacted.
There is a caution in this interpretation however. These are tracer experiments, meaning that the chemical concentrations of the compounds are very low, less than nanomolar in these studies. Consequently, each enzyme, transporter and receptor provides a significant binding site, effectively a buffer, for the free tracer concentrations, and are reflected in the estimates of the intracellular binding reported in table 1 as the ratios of a dissociation constant Kd to a binding site concentration Btot in both the endothelial, ec, and parenchymal cells, pc. The amounts bound to these sites, lumped together in this analysis, are not readily distinguished kinetically from incorporation into intracellular pools of ADP and ATP, and are only recognized kinetically by the fact that some Ado refluxes from the cells at a rate defined by the bidirectional transporters and the Kd/Btot defines an effective enlargement of the cellular volume of distribution. As such, the modelling analysis could have been allowed to incorporate this excess volume of distribution into enlargements of and , but in this analysis these values were fixed from the anatomic estimates rather than considering them to be free parameters in the optimization.
5. Discussion
(a) Modelling and analysis strategy
In the whole organ approach to cellular metabolism, recognizing that the processes of capillary permeation, cellular entry and intracellular reaction kinetics are complex and vary from organ to organ, we try to apply a set of principles unifying the approaches to elucidate the kinetics of these processes (Bassingthwaighte et al. 1998). The general approach to endogenous metabolism has been to carry out tracer studies within a variety of steady states at different concentrations, and for xenobiotics, to study the disposition of tracer under a variety of circumstances, such as different steady-state bulk concentrations, using samples from inflow, outflow and the tissue itself.
To study processes in vivo, a non-destructive approach is needed. The MID technique, introduced by Chinard et al. (1955), based on the use of multiple simultaneous controls, has been the approach of choice. Generally, the tracer substance under study and a reference tracer that does not escape from the capillary plasma are introduced simultaneously into the inflowing blood stream, and their outflow dilution curves are recorded. From a comparison of the outflow patterns for the two substances, information concerning the transcapillary passage of the study substance can be deduced. If the study substance enters tissue cells, a second reference is also usually added to the injection mixture, a substance that enters the interstitial space, but does not enter the tissue cells. The reference substances are chosen so that, as closely as possible, they are carried in the blood stream (solute V), in the extracellular space (solute E) and across the cell membrane (solute N for transported, but not metabolized) in the same way and at the same rate as the substance of interest (solute S), as shown for an exemplary idealized situation in figure 7.
Figure 7.
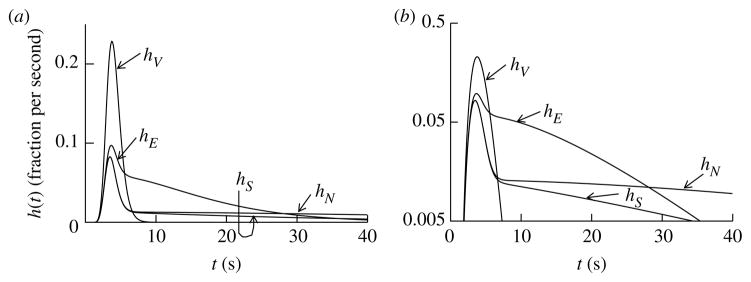
The ideal MID experiment. A matched set of outflow dilution curves for an idealized set of solutes serving as references for a metabolized solute, S. (a) Linear ordinate scaling. (b) Logarithmic ordinate scaling. The input function is the same for all solutes since they were injected as a bolus. Outflow dilution curves are shown for a vascular reference (V) and extracellular reference (E), a transported non-metabolized solute (N) and the solute under study (S). The outflow concentration–time curve for V defines the transport characteristics of the intravascular transport for all of the solutes. The solute E is chosen to be the same size and charge as S but remains extracellular: its outflow curve defines the delay and dispersion due to capillary permeation through interendothelial clefts and its dilution in the extracellular space (intravascular plus interstitial). The solute N, chosen to match E and S with respect to its molecular size and diffusivity during extracellular transport, and to match S with respect to its rate of cellular entry via a facilitating transmembrane transporter, differs from S only in that N is not metabolized. The cellular metabolism of S lowers the tail of the curve hS(t) in comparison with that of hE(t), and provides a measure of the consumption rate.
In this study’s experiments, the non-metabolized reference tracer N is lacking, but in actuality we substitute for the information that was to have come from it by using the time course of appearance of the reaction products. The constraints provided by fitting the product outflow concentration–time curves are severe, since this requires not only mass balance accounting, but also accounting for the kinetics of the reactions, the binding space (buffering) of the enzyme–substrate, the subsequent reactions in the series and the permeabilities of each of the reactants in both cardiomyocytes and endothelial cells. A key to the reduction in the numbers of free parameters is to use a priori information on the anatomic volumes of the spaces (e.g. Vinnakota & Bassingthwaighte 2004), and on the endothelial permeabilities for the reaction products from other studies (e.g. Kroll et al. 1992).
The practical result of using multiple datasets simultaneously, along with the a priori data, is that the fitting is so highly constrained that there is very little leeway for adjusting the remaining free parameters, and therefore the fitting does not give residual sums of squares as low as would be obtained without the constraints of the simultaneous fitting. This is to be expected, given that there are about 60 points per outflow curve (but not 60 independent items of information) plus the anatomic constraints, so that the degrees of freedom are certainly very small. We do not have a good means of estimating the degrees of freedom.
Parameters of the purine nucleoside metabolism in endothelial cells and cardiomyocytes have not hitherto been obtained simultaneously for this set of reactant solutes. The advantages of the combination of the MID technique, the chemical separation and identification of products and the analysis with a general model, GENTEX, with a constrained parameter set are that the parameter sets are wholly and completely compatible with each other and with the experimental data, and give an exact mass balance at the same time.
The GENTEX model is not the complete generality that might be desired. For example, the assumed absence of intraregional radial gradients is justified for small solutes with rapid diffusion and relatively slow consumption rates. For oxygen in cells with high metabolic rates, there must be standing radial gradients not represented here (Krogh, with Erlang, 1919). The model could be extended to provide additional radial shells that would give arbitrarily close approximations to parabolic intracellular profiles.
6. Summary
The general theory of input–output relationships for linear stationary systems is applicable to the study of tracer transients in the absence of temporal variations in concentrations of the non-tracer mother substances. The MID experiment allows one to study non-stationary systems as well by using the combination of tracer and non-tracer models to analyse the data. The GENTEX whole organ model provides for the flow heterogeneity and the multiplicity of the chemical and tracer species of purine nucleosides and metabolites and the kinetics of their exchanges. The example data on the rabbit heart, though acquired in two sets of curves (nine curves of 60 points each) within a few minutes, were analysed as if the whole set were exactly simultaneous. Given that the physiological system was truly stationary, the analysis provides remarkably strong constraints on the observed parameters. This strategy is proposed as a means of reducing error in parameter estimates in observations of metabolic systems and in multi-cellular systems within an organ. Such approaches can similarly be applied to cell culture systems in microfluidic channels.
Acknowledgments
The authors greatly appreciate the use of the multispecies indicator dilution data previously illustrated, but not analysed, by Schwartz et al. (1999) for the multispecies analysis undertaken here, and particularly appreciate the help of James D. Ploger, who worked on the initial analysis. The model programs, MMID4, from Bassingthwaighte et al. (1989), and GENTEX, revised by us from the original of Dr Louis Noodleman and the switch-controlled version under XSIM written by Dr Zheng Li, can be downloaded from the National Simulation Resource website at http://nsr.bioeng.washington.edu, along with the JSim simulation system, developed by Erik Butterworth.
References
- Bassingthwaighte JB. Blood flow and diffusion through mammalian organs. Science. 1970;167:1347–1353. doi: 10.1126/science.167.3923.1347. [DOI] [PMC free article] [PubMed] [Google Scholar]
- Bassingthwaighte JB. A concurrent flow model for extraction during transcapillary passage. Circ Res. 1974;35:483–503. doi: 10.1161/01.res.35.3.483. [DOI] [PMC free article] [PubMed] [Google Scholar]
- Bassingthwaighte JB, Goresky CA. Modeling in the analysis of solute and water exchange in the microvasculature. In: Renkin EM, Michel CC, editors. Handbook of physiology. Sect. 2. The cardiovascular system. The microcirculation. IV. Bethesda, MD: American Physiological Society; 1984. pp. 549–626. [Google Scholar]
- Bassingthwaighte JB, Sparks HV. Indicator dilution estimation of capillary endothelial transport. Annu Rev Physiol. 1986;48:321–334. doi: 10.1146/annurev.ph.48.030186.001541. [DOI] [PMC free article] [PubMed] [Google Scholar]
- Bassingthwaighte JB, Ackerman FH, Wood EH. Applications of the lagged normal density curve as a model for arterial dilution curves. Circ Res. 1966;18:398–415. doi: 10.1161/01.res.18.4.398. [DOI] [PMC free article] [PubMed] [Google Scholar]
- Bassingthwaighte JB, Yipintsoi T, Harvey RB. Microvasculature of the dog left ventricular myocardium. Microvasc Res. 1974;7:229–249. doi: 10.1016/0026-2862(74)90008-9. [DOI] [PMC free article] [PubMed] [Google Scholar]
- Bassingthwaighte JB, Wang CY, Chan IS. Blood–tissue exchange via transport and transformation by endothelial cells. Circ Res. 1989;65:997–1020. doi: 10.1161/01.res.65.4.997. [DOI] [PMC free article] [PubMed] [Google Scholar]
- Bassingthwaighte JB, Chan IS, Wang CY. Computationally efficient algorithms for capillary convection–permeation–diffusion models for blood–tissue exchange. Ann Biomed Eng. 1992;20:687–725. doi: 10.1007/BF02368613. [DOI] [PubMed] [Google Scholar]
- Bassingthwaighte JB, Goresky CA, Linehan JH, editors. Capillary permeation, cellular uptake and product formation. New York, NY: Springer; 1998. Whole organ approaches to cellular metabolism; p. 575. [Google Scholar]
- Chan IS, Goldstein AA, Bassingthwaighte JB. SENSOP: a derivative-free solver for non-linear least squares with sensitivity scaling. Ann Biomed Eng. 1993;21:621–631. doi: 10.1007/BF02368642. [DOI] [PMC free article] [PubMed] [Google Scholar]
- Chinard FP, Vosburgh GJ, Enns T. Transcapillary exchange of water and of other substances in certain organs of the dog. Am J Physiol. 1955;183:221–234. doi: 10.1152/ajplegacy.1955.183.2.221. [DOI] [PubMed] [Google Scholar]
- Crone C. The permeability of capillaries in various organs as determined by the use of the ‘indicator diffusion’ method. Acta Physiol Scand. 1963;58:292–305. doi: 10.1111/j.1748-1716.1963.tb02652.x. [DOI] [PubMed] [Google Scholar]
- Deussen A, Borst M, Kroll K, Schrader J. Formation of S-adenosylhomocysteine in the heart. II A sensitive index for regional myocardial underperfusion. Circ Res. 1988;63:250–261. doi: 10.1161/01.res.63.1.250. [DOI] [PubMed] [Google Scholar]
- Downey JM, Miura T, Eddy LJ, Chambers DE, Mellert T, Hearse DJ, Yellon DM. Xanthine oxidase is not a source of free radicals in the ischemic rabbit heart. J Mol Cell Cardiol. 1987;19:1053–1060. doi: 10.1016/s0022-2828(87)80350-4. [DOI] [PubMed] [Google Scholar]
- Gonzalez F, Bassingthwaighte JB. Heterogeneities in regional volumes of distribution and flows in the rabbit heart. Am J Physiol Heart Circ Physiol. 1990;258:H1012–H1024. doi: 10.1152/ajpheart.1990.258.4.H1012. [DOI] [PMC free article] [PubMed] [Google Scholar]
- Goresky CA. A linear method for determining liver sinusoidal and extravascular volumes. Am J Physiol. 1963;204:626–640. doi: 10.1152/ajplegacy.1963.204.4.626. [DOI] [PubMed] [Google Scholar]
- Gorman MW, Bassingthwaighte JB, Olsson RA, Sparks HV. Endothelial cell uptake of adenosine in canine skeletal muscle. Am J Physiol. 1986;250(3 Pt 2):H482–H489. doi: 10.1152/ajpheart.1986.250.3.H482. [DOI] [PMC free article] [PubMed] [Google Scholar]
- Kellen MR, Bassingthwaighte JB. Transient transcapillary exchange of water driven by osmotic forces in the heart. Am J Physiol Heart Circ Physiol. 2003;285:H1317–H1331. doi: 10.1152/ajpheart.00587.2002. [DOI] [PMC free article] [PubMed] [Google Scholar]
- King RB, Bassingthwaighte JB, Hales JRS, Rowell LB. Stability of heterogeneity of myocardial blood flow in normal awake baboons. Circ Res. 1985;57:285–295. doi: 10.1161/01.res.57.2.285. [DOI] [PMC free article] [PubMed] [Google Scholar]
- King RB, Deussen A, Raymond GR, Bassingthwaighte JB. A vascular transport operator. Am J Physiol Heart Circ Physiol. 1993;265:H2196–H2208. doi: 10.1152/ajpheart.1993.265.6.H2196. [DOI] [PMC free article] [PubMed] [Google Scholar]
- King RB, Raymond GM, Bassingthwaighte JB. Modeling blood flow heterogeneity. Ann Biomed Eng. 1996;24:352–372. doi: 10.1007/BF02660885. [DOI] [PMC free article] [PubMed] [Google Scholar]
- Krogh A. The number and distribution of capillaries in muscles with calculations of the oxygen pressure head necessary for supplying the tissue. J Physiol (Lond) 1919;52:409–415. doi: 10.1113/jphysiol.1919.sp001839. [DOI] [PMC free article] [PubMed] [Google Scholar]
- Kroll K, Bassingthwaighte JB. Role of capillary endothelial cells in transport and metabolism of adenosine in the heart: an example of the impact of endothelial cells on measures of metabolism. In: Bassingthwaighte JB, Goresky CA, Linehan JH, editors. Whole organ approaches to cellular metabolism. ch.11. New York, NY: Springer; 1998. pp. 261–275. [Google Scholar]
- Kroll K, Bukowski TR, Schwartz LM, Knoepfler D, Bassingthwaighte JB. Capillary endothelial transport of uric acid in the guinea pig heart. Am J Physiol Heart Circ Physiol. 1992;262:H420–H431. doi: 10.1152/ajpheart.1992.262.2.H420. [DOI] [PMC free article] [PubMed] [Google Scholar]
- Kuikka J, Levin M, Bassingthwaighte JB. Multiple tracer dilution estimates of D- and 2-deoxy-D-glucose uptake by the heart. Am J Physiol Heart Circ Physiol. 1986;250:H29–H42. doi: 10.1152/ajpheart.1986.250.1.H29. [DOI] [PMC free article] [PubMed] [Google Scholar]
- Sangren WC, Sheppard CW. A mathematical derivation of the exchange of a labeled substance between a liquid flowing in a vessel and an external compartment. Bull Math Biophys. 1953;15:387–394. [Google Scholar]
- Schwartz LM, Bukowski TR, Revkin JH, Bassingthwaighte JB. Cardiac endothelial transport and metabolism of adenosine and inosine. Am J Physiol Heart Circ Physiol. 1999;277:H1241–H1251. doi: 10.1152/ajpheart.1999.277.3.H1241. [DOI] [PMC free article] [PubMed] [Google Scholar]
- Schwartz LM, Bukowski TR, Ploger JD, Bassingthwaighte JB. Endothelial adenosine transporter characterization in perfused guinea pig hearts. Am J Physiol Heart Circ Physiol. 2000;279:H1502–H1511. doi: 10.1152/ajpheart.2000.279.4.H1502. [DOI] [PubMed] [Google Scholar]
- Seemann G, Höper C, Sachse FB, Dössel O, Holden AV, Zhang H. Heterogeneous three-dimensional anatomical and electrophysiological model of human atria. Phil Trans R Soc A. 2006;364 doi: 10.1098/rsta.2006.1781. [DOI] [PubMed] [Google Scholar]
- Shim EB, Leem CH, Abe Y, Noma A. A new multi-scale simulation model of the circulation: from cells to system. Phil Trans R Soc A. 2006;364 doi: 10.1098/rsta.2006.1782. [DOI] [PubMed] [Google Scholar]
- Stoker ME, Gerdes AM, May JF. Regional differences in capillary density and myocyte size in the normal human heart. Anat Rec. 1982;202:187–191. doi: 10.1002/ar.1092020203. [DOI] [PubMed] [Google Scholar]
- Vargas FF, Johnson JA. An estimate of reflection coefficients for rabbit heart capillaries. J Gen Physiol. 1964;47:667–677. doi: 10.1085/jgp.47.4.667. [DOI] [PMC free article] [PubMed] [Google Scholar]
- Vargas FF, Johnson JA. Permeability of rabbit heart capillaries to non-electrolytes. Am J Physiol. 1967;213:87–93. doi: 10.1152/ajplegacy.1967.213.1.87. [DOI] [PubMed] [Google Scholar]
- Vink H, Duling BR. Identification of distinct luminal domains for macromolecules, erythrocytes, and leukocytes within mammalian capillaries. Circ Res. 1996;79:581–589. doi: 10.1161/01.res.79.3.581. [DOI] [PubMed] [Google Scholar]
- Vinnakota K, Bassingthwaighte JB. Myocardial density and composition: a basis for calculating intracellular metabolite concentrations. Am J Physiol Heart Circ Physiol. 2004;286:H1742–H1749. doi: 10.1152/ajpheart.00478.2003. [DOI] [PubMed] [Google Scholar]
- Wangler RD, Gorman MW, Wang CY, DeWitt DF, Chan IS, Bassingthwaighte JB, Sparks HV. Transcapillary adenosine transport and interstitial adenosine concentration in guinea pig hearts. Am J Physiol. 1989;257(1 Pt 2):H89–H106. doi: 10.1152/ajpheart.1989.257.1.H89. [DOI] [PMC free article] [PubMed] [Google Scholar]
- Yipintsoi T, Scanlon PD, Bassingthwaighte JB. Density and water content of dog ventricular myocardium. Proc Soc Exp Biol Med. 1972;141:1032–1035. doi: 10.3181/00379727-141-36927. [DOI] [PMC free article] [PubMed] [Google Scholar]