

Abstract
To identify common genetic variants that contribute to lung cancer susceptibility, we conducted a multistage genome-wide association study of lung cancer in Asian women who never smoked. We scanned 5,510 never-smoking female lung cancer cases and 4,544 controls drawn from 14 studies from mainland China, South Korea, Japan, Singapore, Taiwan, and Hong Kong. We genotyped the most promising variants (associated at P < 5 × 10⁻⁶) in an additional 1,099 cases and 2,913 controls. We identified three new susceptibility loci at 10q25.2 (rs7086803, P = 3.54 × 10⁻¹⁸), 6q22.2 (rs9387478, P = 4.14 × 10⁻¹⁰) and 6p21.32 (rs2395185, P = 9.51 × 10⁻⁹). We also confirmed associations reported for loci at 5p15.33 and 3q28 and a recently reported finding at 17q24.3. We observed no evidence of association for lung cancer at 15q25 in never-smoking women in Asia, providing strong evidence that this locus is not associated with lung cancer independent of smoking.
It is estimated that 25% of lung cancer cases arise in individuals who never smoked. Lung cancer in never smokers ranks as the seventh most common cause of cancer death worldwide1. A number of observations suggest that the molecular pathogenesis of lung cancer differs by smoking status. Differences have been reported by smoking status for cellular and molecular carcinogenic pathways, distinct profiles of oncogenic mutations (for example, in EGFR), and response to targeted therapy2, 3. Compared to lung cancer in smokers, cases in never smokers are more likely to arise in women at a younger age and there is a greater proportion of cases with the adenocarcinoma histology subtype3. Epidemiological studies of lung cancer in never smokers have shown that the incidence of lung cancer in women is particularly high in Asia4, which is partially attributed to exposure to environmental tobacco smoke, combustion products from indoor heating and cooking fuel, and cooking oil fumes4-10.
To gain insight into the etiology of lung cancer among never-smoking women, we formed the Female Lung Cancer Consortium in Asia (FLCCA), which includes studies drawn from mainland China, South Korea, Japan, Singapore, Taiwan, and Hong Kong. Previously, we published the first genome-wide association study (GWAS) of lung cancer in never-smoking Asian women, including 584 cases and 585 controls with large-scale replication, reporting an association at 5p15.33 near the TERT gene 11; in this study, it was also notable that the estimated effect of the associated locus was greater in non-smoking Asian women than the reported effect size observed in primarily smokers of European ancestry12. We also confirmed an association signal in TP63 at 3q2813, replicating the report from a GWAS conducted in Japan14.
To identify new susceptibility loci in Asian never-smoking women, we conducted a lung cancer GWAS in 14 studies (13 case-control studies and 1 cohort study, Supplementary Note, Supplementary Table 1). Samples were scanned at 6 centers (Online Methods): the United States National Cancer Institute (NCI) Cancer Genomic Research (CGR) Laboratory, the Genome Institute of Singapore, Memorial Sloan-Kettering Cancer Center, GeneTech Biotech Co. in Taiwan, Gene-Square Biotech in Beijing, and deCODE Genetics in Iceland. After stringent quality control analysis of genotypes (Online Methods), we combined datasets for 5,510 lung cancer cases and 4,544 controls using a previously described clustering algorithm15. The primary analysis was performed using logistic regression for genotype trend effect (with 1 degree of freedom) adjusted for study center, age and three eigenvectors (on the basis of principal- components analysis). A comparison of the observed and expected p-values in the quantile-quantile (Q-Q) plot showed an enrichment of observed signals with small p-values compared to the null distribution of no association, with little evidence for genomic inflation (unscaled λ = 1.014, λ1000 = 1.003; Supplementary Figure 1)16.
The overall association results are shown in a Manhattan plot, in which we observed both new and known loci that exceeded the threshold for genome-wide significance, P < 5 × 10⁻⁸ (Fig. 1). We observed an association at two previously established loci, rs2736100 at 5p15.3311, 12, 14, 17-19, and rs4488809 at 3q2813, 14. We also observed support for an association at a recently reported locus marked by rs7216064 at 17q24.320 (Supplementary Table 2). Notably, there was no evidence for association across the 15q25 region, which has been associated with smoking-related lung cancer12, 19, 21-24. We did not observe strong signals for other loci reported in either European25 or Asian17,26 populations (Supplementary Table 2).
Figure 1. Association results from a GWAS of never-smoking women in Asia.
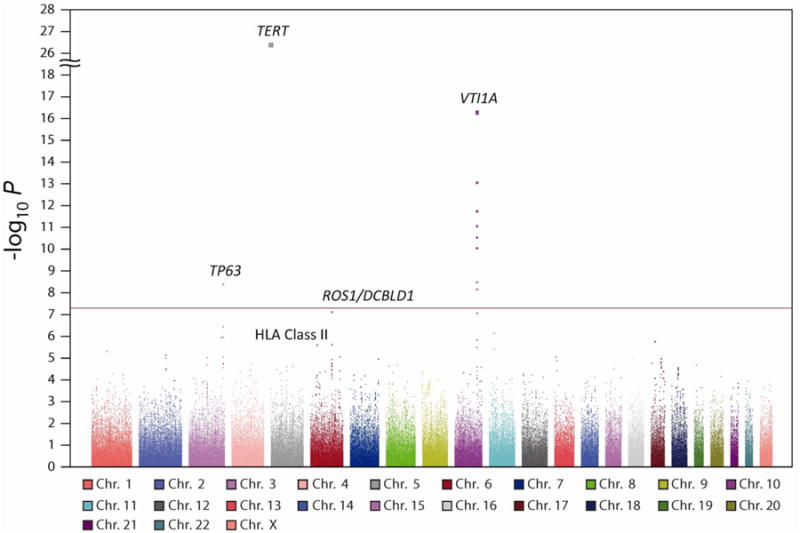
Manhattan plot based on P values derived from 1-degree-of-freedom tests of genotype trend effect in an unconditional logistic regression analysis adjusted for study, age and three eigenvectors in a GWAS of lung cancer in never-smoking Asian females, including 5,510 lung cancer cases and 4,544 controls. The x axis represents chromosomal location, and the y axis shows P values on a negative logarithmic scale. The red horizontal line represents the genome-wide significance threshold of P = 5 × 10⁻⁸. Labeled are two previously associated loci (TERT at 5p15.33 and TP63 at 3q28) together with three newly identified loci (VTI1A on chromosome 10 and ROS1-DCBLD1 and the HLA Class II region on chromosome 6).
In our primary scan, we observed one new locus at 10q25.2, marked by rs7086803, that substantially exceeded the threshold for genome-wide significance (OR = 1.32, 95% CI = 1.24-1.41, P = 5.04 × 10⁻¹⁷) (Fig. 1, Table 1). We developed assays to genotype 13 SNPs associated at P < 5 × 10⁻⁶ in the initial scan, using analysis of all cases or the most common subtype in non-smokers, adenocarcinoma. We genotyped 1,099 new cases and 2,913 controls drawn from the same studies as in the initial scan. In a combined analysis of 6,609 cases and 7,457 controls, 3 new loci achieved associations at genome-wide significance (Table 1): 10q25.2 (rs7086803, OR = 1.28, 95% CI = 1.21-1.35, P = 3.54 × 10⁻¹⁸); 6q22.2 (rs9387478, OR = 0.85, 95% CI = 0.81-0.90, P = 4.14 × 10⁻¹⁰); and 6p21.32 (rs2395185, OR = 1.17, 95% CI = 1.11-1.23, P = 9.51 × 10⁻⁹) (Table 1, Fig. 2, Supplementary Figure 2, Supplementary Tables 3 and 4).
Table 1. New loci associated with lung cancer in a GWAS among never-smoking Asian females.
| SNP | Plausible candidate gene(s) | Chromosome position | Subset | Allelea | MAFb (Control/Case) | Subjects (Control/Case) | OR (95% CI) | Ptrend |
|---|---|---|---|---|---|---|---|---|
| rs7086803 | VTI1A | 10q25.2 | GWAS | G|A | 0.26/0.32 | 4,492/5,457 | 1.32(1.24-1.41) | 5.04×10⁻¹⁷ |
| Replication | G|A | 0.27/0.31 | 2,887/1,085 | 1.23(1.10-1.37) | 3.36×10⁻⁴ | |||
| Combined | G|A | 0.27/0.31 | 7,379/6,542 | 1.28(1.21-1.35) | 3.54×10⁻¹⁸ | |||
| rs9387478 | ROS1, DCBLD1 | 6q22.2 | GWAS | C|A | 0.50/0.46 | 4,542/5,510 | 0.85(0.81-0.90) | 7.79×10⁻⁸ |
| Replication | C|A | 0.49/0.47 | 2,891/1,091 | 0.92(0.83-1.01) | 0.088 | |||
| Combined | C|A | 0.50/0.46 | 7,433/6,601 | 0.85(0.81-0.90) | 4.14×10⁻¹⁰ | |||
| rs2395185c (rs28366298) | HLA Class II region | 6p21.32 | GWAS | G|T | 0.35/0.38 | 4,541/5,504 | 1.16(1.09-1.23) | 2.60×10⁻⁶ |
| Replication | A|C | 0.37/0.42 | 2,880/1,008 | 1.20(1.08-1.33) | 7.93×10⁻⁴ | |||
| Combined | Meta | 7,421/6,512 | 1.17(1.11-1.23) | 9.51×10⁻⁹ |
Minor allele listed second;
Minor allele frequency;
For the HLA Class II region, because a Taqman assay could not be designed for rs2395185, we instead genotyped rs28366298, its perfect surrogate (r2=1.0), by Taqman. The reported P value is based on meta-analysis of the rs2395185 results in the GWAS and the rs28366298 results in the TaqMan set.
Figure 2. Association results, recombination hot-spots, and linkage disequilibrium plots for the regions newly associated with lung cancer in never-smoking Asian females.

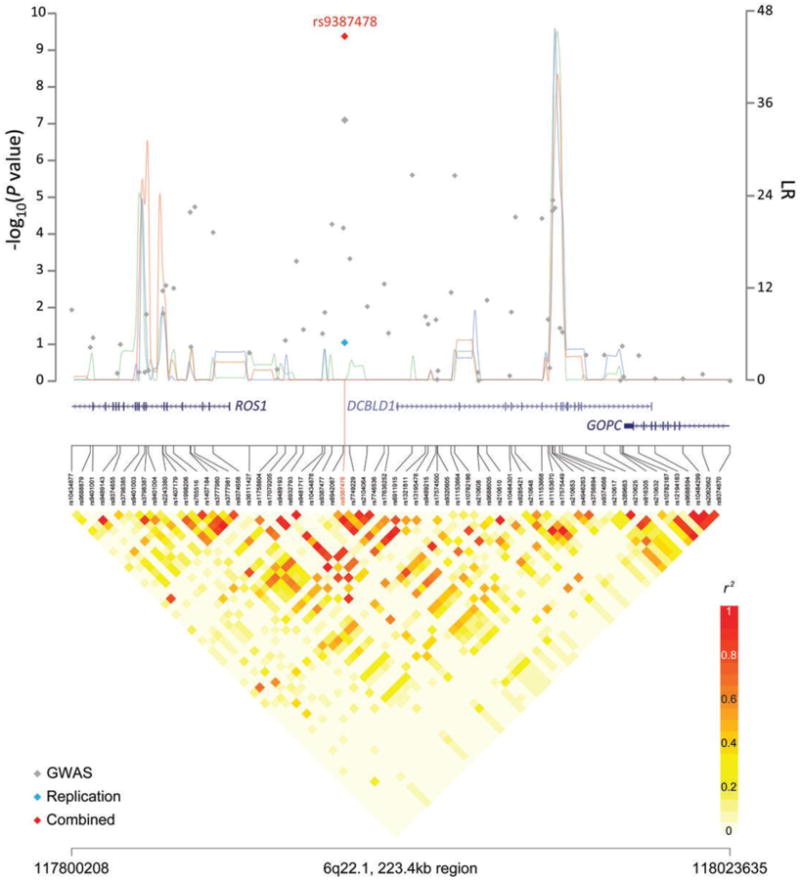

Top, association results of GWAS data (grey diamonds), TaqMan data (blue diamonds) and combined data (red diamonds) are shown in the top panel with −log10(P) values (left y axis). Overlaid are the likelihood ratio statistics (right y axis) to estimate putative recombination hotspots across the region on the basis of 3 sets of 100 randomly selected control samples representing Han Chinese, Japanese and Korean (connected lines in green, blue, and red, respectively) individuals. Bottom, LD heatmap based on pairwise r2 values from total control populations for all SNPs included in the GWAS. (a) A 229.7- kb region at 10q25.2 spanning the VTI1A gene. (b) A 223.4- kb region at 6q22.2 spanning the ROS1, DCBLD1 and GOPC genes. (c) A 279.6- kb region at 6p21.32 spanning multiple genes in the HLA class II region. Because a Taqman assay could not be designed for rs2395185, we instead genotyped rs28366298, its perfect surrogate (r2 = 1.0), by TaqMan. The reported P value is based on meta-analysis of the rs2395185 results in the GWAS and the rs28366298 results in the TaqMan set. Genomic coordinates are based on NCBI Human Genome Build 36. Schematic gene structures are taken from the UCSC Genome Browser and are scaled to the x-axis.
Analysis by histological subtype of lung cancer showed that both the 6q22.2 locus (rs9387478) and 6p21.32 locus (rs2395185) were associated with adenocarcinoma only, which comprised 71% of cases (Table 2). The estimated effects were consistent across studies (Supplementary Figure. 2). We note that rs7086803 showed a somewhat larger effect for squamous carcinoma compared to adenocarcinoma (Table 2), but, as the number of squamous carcinoma cases analyzed was small, we consider this a preliminary observation requiring independent replication.
Table 2. New loci associated with adenocarcinoma and squamous carcinoma of the lung in a GWAS among never-smoking Asian females.
| SNP | Putative gene |
Chromo- some position |
Allelea | MAFb | Adenocarcinoma | Squamous carcinoma | Pheterogeneityc | ||||||
|---|---|---|---|---|---|---|---|---|---|---|---|---|---|
|
| |||||||||||||
| 1 | 2 | 3 | Subjects (Control/Case) |
OR (95% CI) | Ptrend | Subjects (Control/Case) |
OR (95% CI) | Ptrend | |||||
| rs7086803 | VTI1A | 10q25.2 | G|A | 0.27 | 0.31 | 0.34 | 7,035/4,666 | 1.24(1.17-1.32) | 1.19×10⁻¹¹ | 6,714/756 | 1.36(1.21-1.54) | 7.11×10⁻⁷ | 0.014 |
| rs9387478 | ROS1, DCBLD1 | 6q22.2 | C|A | 0.50 | 0.46 | 0.48 | 7,089/4,726 | 0.84(0.80-0.89) | 1.55×10⁻⁹ | 6,768/755 | 0.90(0.81-1.01) | 0.078 | 0.060 |
| rs2395185d (rs28366298) | HLA Class II region | 6p21.32 | Meta | 7,390/4,696 | 1.20(1.13-1.28) | 9.47×10⁻¹⁰ | 7,211/742 | 1.05(0.93-1.18) | 0.42 | 0.56 | |||
Minor allele listed second;
Minor allele frequency; 1: MAF in controls, 2: MAF in adenocarcinoma, 3: MAF in squamous carcinoma;
Tested by case-case analysis.
For the HLA Class II region, because a Taqman assay could not be designed for rs2395185, we instead genotyped rs28366298, its perfect surrogate (r2=1.0), by Taqman. The reported P value is based on meta-analysis of the rs2395185 results in the GWAS and the rs28366298 results in the TaqMan set.
To explore the relationship between these three regions and lung cancer in populations of European ancestry, we analyzed data from a previously reported GWAS of 5,718 lung cancer cases and 5,739 controls, including men and women who were primarily ever smokers12. We found no evidence for association at the three newly associated loci. In a sub-analysis of 350 never-smoker cases and 1,379 never smoker controls drawn from this study, we observed some evidence of association for rs2395185 but larger studies are warranted (unpublished data, T Landi).
We imputed SNPs catalogued in the 1000 Genomes Project March 2012 release and the Division of Cancer Epidemiology and Genetics Imputation Reference Set version 127 using the IMPUTE2 program28 across a 1-Mb region centered on the index SNP (see Online Methods). The association analysis did not identify new signals that were substantially stronger than the genotyped SNPs for the two non-HLA regions (Supplementary Figure. 3a,b). Although there appear to be stronger signals in the imputed data for the HLA Class II region (Supplementary Figure. 3c), HLA-typing will be necessary to unravel the specific haplotypes.
At the 6q22 locus, six SNPs were highly correlated with rs9387478 (r2 = 0.99 – 1.00). Two SNPs, rs9387478 and rs6937083 (pairwise r2 = 1), were observed within a region defined by the Encyclopedia of DNA Elements (ENCODE) as containing both chromatin state segmentation and enhancer- and promoter-associated histone marks. Although the evidence for evolutionary conservation is weak (i.e., a cross-species sequence alignment comparison indicated conservation at the site of ∼29.2 million years since divergence from a common ancestor), rs6937083 falls within an ENCODE predicted transcription factor binding site and an exon of the AceView predicted gene, DCBLD1. The architecture of the region on chromosome 10q25 is more complicated because there are 23 perfectly correlated SNPs (r2 = 1) and 1 highly correlated SNP (r2 = 0.99). All localize to intron 7 or the untranslated region (UTR) of one transcript of the vesicle transport through interaction with the t-SNAREs homolog 1A (yeast) gene (VTI1A). Sixteen fall within putatively functional regions, defined as ENCODE DNase I hypersensitivity clusters, chromatin state segmentation, the UTR of VTI1A, ENCODE enhancer- and promoter-associated histone marks, and/or highly conserved (i.e., a cross-species sequence alignment comparison indicated conservation at the site of 300 million years since divergence from a common ancestor) regions (see Supplementary Table 5); rs11196080 is noteworthy because many of the functionally-predicted areas converge on this SNP, making this a high priority variant for functional follow-up studies.
The strongest new association signal, rs7086803 at 10q25.2, maps to intron 7 of the VTI1A gene, which has been implicated in lung carcinogenesis. Loss of VTI1A activity has been reported to reduce high-frequency spontaneous neurotransmitter release29 and rapid progressive neuro-degeneration in the peripheral ganglia30. VTI1A is also involved in Acrp30-containing vesicles in adipocytes, and lower amounts of VTI1A in cultured adipocytes can inhibit adiponectin secretion31. Lower amounts of adiponectin have previously been associated with advanced lung cancer31,32. A recent study reported recurrent VTI1A-TCF7L2 fusions in colorectal cancers, and a colorectal carcinoma cell line with the fusion gene was shown to be dependent on VTI1A-TCF7L2 for anchorage-independent growth33.
The rs9387478 SNP at 6q22.2 is located in an interval that contains two candidate genes: DCBLD1 (encoding discoidin, CUB and LCCL domain containing 1) and ROS1 (encoding the ROS proto-oncogene receptor tyrosine kinase). ROS1 functions as both an integral membrane protein and a receptor tyrosine kinase34. Expression of Ros1 is specifically increased in lung cancer tissue in mice, and ROS1 expression levels are increased in non-small cell lung cancer (NSCLC)35. ROS1 fusions in lung adenocarcinoma and NSCLC, particularly in Asian never smokers, have been identified as drivers of oncogenesis 36-38. ROS1 rearrangements were found to be more common in lung adenocarcinomas from never smokers and younger affected individuals39. There is limited evidence concerning the functional role of the protein encoded by DCBLD1; a related gene at 3q12.2, DCBLD2 (encoding discoidin, CUB and LCCL domain containing 2, also known as CLCP1), regulates cellular proliferation and invasion and may have an important role in cancer metastasis40, 41, 42.
The third locus, marked by rs2395185 at 6p21.3, is located within 20 kb of HLA-DRA (encoding major histocompatibility complex, class II, DR alpha) and 52 kb downstream of HLA-DRB5 (encoding major histocompatibility complex, class II, DR beta 5). There was no evidence for strong linkage disequilibrium between this SNP and other SNPs reported for lung cancer at 6p21.3217, 23. There was little LD with a recently reported SNP, rs3817963, and lung cancer in a Japanese population, also on 6p21.320; the r2 in Han Chinese and Japanese HapMap samples was 0.18 and 0.10, respectively, and D′ was 0.57 and 0.43, respectively. These data suggest that our locus probably represents a new HLA Class II-related finding for nonsmoking lung cancer susceptibility. Further mapping across the complex HLA region is required to characterize the specific susceptibility alleles or haplotypes involved in non-smoking lung cancer risk. We also note that rs2395185 has been previously associated with ulcerative colitis43, Hodgkin lymphoma44, and type 1 diabetes45.
In previous GWAS of lung cancer, in which a majority of cases were smokers, SNPs across a region at 15q25 have been associated with lung cancer risk12, 19, 21-24. However, studies of smoking related behavior have also identified variants at 15q25, raising the possibility that the variants previously identified by GWAS for lung cancer could mediate risk through effects on tobacco use46. We previously genotyped additional SNPs across 15q25 in Asian studies and observed no evidence of association with lung cancer in never-smoking Asian females11. Notably, in our current, larger study, there was no evidence for association with lung cancer at 15q25 in the never-smoking population overall or in the major subtypes. These data provide strong evidence that this locus is not associated with lung cancer independent of smoking in never-smoking females in Asia, which contrasts with the results from a smaller Asian study24, but is consistent with previous reports from smaller studies conducted in populations of European ancestry12, 47, 48.
We investigated the relationship between our new loci and known environmental exposures. The association between exposure to environmental tobacco smoke (ETS) in the home and adenocarcinoma in the five studies with data available yielded an OR of 1.36 (P = 1.2 × 10⁻⁴) in an analysis of 1,770 cases and 2,675 controls, consistent with previous reports8. The effect of ETS was stronger for subjects with the GG genotype at rs2395185, with OR = 1.78 (P = 1.15 × 10⁻⁵), compared to subjects with GT/TT genotypes, OR = 1.16 (P = 0.15), with Pinteraction = 0.002. The association between the T allele at rs2395185 and risk of adenocarcinoma in subjects with and without exposure to ETS yielded OR = 1.13 (P = 0.031) and OR = 1.43 (P = 5.6 × 10⁻⁴), respectively, with Pinteraction = 0.037. There was no evidence of interaction with the other two new loci reported here.
In summary, we conducted a GWAS of lung cancer in never-smoking females in Asia and identified three new susceptibility loci at 10q25.2, 6q22.2, and 6p21.32. We also confirmed associations with two previously reported regions at 5p15.3311, 12, 14, 17-19, 3q2813, 14 and a recently reported locus at 17q24.320. It is notable that our strongest finding at 10q25.2 has not been reported previously in lung cancer GWAS. This observation suggests that the etiology of lung cancer among never-smokers in Asia may have unique genetic characteristics. This is consistent with the distinct pattern of environmental risk factors that have been causally linked to lung cancer among never-smoking females in Asia4-8, 10, and the distinct molecular phenotypes of lung cancer in never-smokers2, 3. Further work is warranted to map the new regions. Functional work is required to identify the variants that directly account for the underlying association as well as to study how the genetic variants interact with established environmental risk including ETS, cooking fumes, and fuel use among never-smoking females in Asia.
Online Methods
Study participants
Participants were drawn from 14 studies (Supplementary Table 1). Cases had histologically confirmed lung cancer. Each participating study obtained informed consent from study participants and approval from its respective Institutional Review Board for this study. Studies obtained institutional certification permitting data sharing in accordance with the NIH Policy for Sharing of Data Obtained in NIH Supported or Conducted Genome-Wide Association Studies (GWAS), with the exception of the component of the GELAC study that was not scanned at NCI (see below).
Genotyping and quality control
Genome-wide scanning data came from two sources. Internal sets (HKS, SNU, CNULCS, SWHS, YLCS and components of samples from Japan and GELAC) were genotyped at the NCI Cancer Genomic Research (CGR) Laboratory using the Illumina 660W SNP microarray. External sets were genotyped as follows: a) samples from CAMSCH, FLCS, GDS, SLCS, TLCS, and WLCS were genotyped on contract at Gene-Square Biotech, Inc. in Beijing using the Illumina 660W SNP microarray; b) samples from GELAC were genotyped on contract at GeneTech Biotech Co., Taiwan on the Illumina 370k SNP microarray in a pilot project and remaining samples were genotyped on contract at deCODE Genetics, Iceland using the Illumina 610Q SNP microarray and initially reported elsewhere11; c) a subset of samples from Japan were genotyped at Memorial Sloan-Kettering Cancer Center (MSKCC) using the Illumina 610Q SNP microarray; and d) samples from Singapore were genotyped at the Genome Institute of Singapore on the Illumina 660W SNP microarray. The scanned intensity data from external sources were collected, and genotypes were clustered and called at the CGR using Illumina Genome Studio v2011.1 on the basis of the GenTrain2 calling algorithm. Genotype clusters were estimated from samples with preliminary completion rates greater than 98% per cluster group.
Genotyping was attempted for a total of 5,568 samples on the Illumina 660W SNP microarray at the CGR. Six samples could not be loaded into the Illumina Genome Studio because of their low intensities, and 16 samples failed to scan because of broken chips. In addition, a total of 5,946 samples were genotyped at Gene-Square Biotech, Inc. (3,828), deCODE, Iceland and GeneTech Biotech Co., Taiwan (1,232), MSKCC (374) and Singapore (512); the distribution of samples genotyped per SNP microarray chip was as follows: Illumina 660W (4,340), Illumina 610Q (1,494), and Illumina 370K (112) arrays. Seven samples (all from Gene Square) could not be loaded to the Illumina Genome Studio because of their low intensities. In addition, 111 samples from 4 studies (FLCS, GDS, SLCS, and TLCS) were excluded due to lab processing errors. The combined 11,374 samples with genotypes mapped to 11,025 unique individuals drawn from 14 studies.
We subsequently performed quality control filtering at the sample level in 19 QC groups (Supplementary Tables 6a,b,c). Samples were excluded that had low completion rates (n = 725 samples) and extreme mean heterozygosity rates (n = 116). Thresholds were chosen on the basis of the sample completion rate or sample mean heterozygosity distribution for each QC group (Supplementary Table 6a) and on the basis of discordant expected duplicate samples (n = 6). There were samples that were excluded for multiple reasons, and the total number of unique samples excluded was 761 (Supplementary Table 6b). Genotype data for the remaining 10,613 samples were merged, resulting in data from 10,312 unique individuals. The genotype concordance rate for the expected duplicates (n = 311) was greater than 99.9%. Further QC analysis at the individual level led to the exclusion of samples with: (i) gender discordance (n = 94); (ii) less than 86% Asian ancestry (n = 3); (iii) first-degree relatives who were also genotyped in the study (n=136 subjects); and (iv) incomplete phenotype or unknown histology, as well as those who had ever smoked or were deemed ineligible (n=15). Thus, the total number of scanned subjects after both QC and analytic exclusions was 10,054 (5,510 cases and 4,544 controls). A summary of the number of excluded loci by study is shown in Supplementary Table 6c.
TaqMan custom genotyping assays (ABI) were designed and optimized for 13 SNPs, including 9 in the NCI scan data and 4 surrogates not in this scan. In an analysis of 385 samples from 7 studies, the comparison of the Illumina calls with the TaqMan assays conducted at the NCI CGR showed an average concordance rate of 99.97% (with a range of 99.7–100%) for the overlapping 9 SNPs. The Cancer Institute and Hospital, Chinese Academy of Medical Sciences also conducted TaqMan genotyping for 7 SNPs on 201 previously scanned samples from 5 studies. The comparison of the Illumina calls with the TaqMan assays showed an average concordance rate of 99.93% (with a range of 99.5-100%). In examining the concordance between rs2395185 (scan) and its perfect surrogate rs28366298 (TaqMan), we applied genotype mapping GG→AA, GT→AC and TT→CC in order to confirm reproducibility of genotyping between platforms.
For the replication phase, we analyzed an additional 3,933 individuals (1,023 cases and 2,910 controls) with TaqMan data, and an additional 79 individuals (76 cases and 3 controls) genotyped using the Illumina 660W array at Gene-Square were available for analysis. Thus, the final number of subjects used in the analyses was 14,066 (6,609 cases and 7,457 controls; Supplementary Table 1). SNP assays with locus call rates lower than 90% or Hardy-Weinberg Equilibrium (HWE) p values less than 1.0 × 10⁻⁷ in each QC group were excluded. In total, 596,032 SNPs remained in the analytic data set. After setting the minimum minor allele frequency (MAF) to 0.01, we excluded 83,806 loci from the association analysis. Thus, 512,226 SNPs were analyzed in the association studies reported here.
Statistical analyses
Data analysis and management were performed with GLU (Genotyping Library and Utilities version 1.0), a suite of tools available as an open-source application for the management, storage and analysis of GWAS data. Assessment of the population structure of study participants was performed with the GLU struct.admix module using the JPT+CHB, CEU and YRI samples as the reference populations (HapMap Build 28). A set of 33,165 SNPs with low pairwise correlation (r2 < 0.01) was selected for this analysis. Three individuals were estimated to have less than 86% Asian ancestry (Supplementary Fig. 4).
The genotypes for all subject pairs were computed for cryptic relatedness using the GLU qc.ibds module with the same set of selected SNPs. In addition to 68 pairs of unexpected duplicates, we detected 33 parent-offspring and 41 full-sibling pairs. For the 142 unexpected duplicates and first-degree relative pairs, 1 subject from each simple pair was excluded. For each family with multiple relative pairs detected, only one randomly chosen subject was included in the principal-components analysis (PCA). To address the underlying population substructure, PCA was conducted using the GLU struct.pca module, a program similar to EIGENSTRAT49, 50, with the same set of SNPs (Supplementary Fig. 5a,b). Three samples with less than 86% Asian ancestry were excluded on the basis of PCA.
Association analysis
Association analyses were conducted using logistic regression, adjusted for age (in 10-year categories), study group and eigenvectors if they were significant when analyzed in the base models. For analysis of all cases versus controls, we adjusted for EV1, EV2 and EV4. For analysis of adenocarcinoma cases versus controls, we adjusted for EV2 and EV4. For analysis of squamous cell cases versus controls, we adjusted for EV8. Each SNP genotype was coded as a count of minor alleles (i.e. trend effect). A score test with one degree of freedom was performed on all genetic parameters in each model to determine statistical significance. The unscaled λ value for all cases versus controls in the main effect model was 1.014, and λ1000 was 1.00316, with λcorrected=1+(λ-1) × (ncase-1+ncontrol-1)/(2 × 10-3).
We assessed heterogeneity in genetic effects across studies using the Cochran's Q statistic, which conforms to a chi-square distribution with k-1 degree of freedom, where k is the number of studies.
For the inclusion of TaqMan data for the SNPs that failed assay design (rs2395185 and rs10197940), we conducted a fixed effects meta-analysis by combining the aggregate results from their perfect surrogates (rs28366298 and rs2290368, respectively) scanned in the GWAS with their own results based only on the additional TaqMan samples not used in the GWAS association analyses.
Genotype-environment interactions with ETS were assessed using logistic regression for studies with such information available and adjusted by age, study group, the main effect of the SNP and ETS, and the interaction term.
Estimate of recombination hotspots
To identify recombination hotspots in the region, we used SequenceLDhot51, a program that uses the approximate marginal likelihood method52 and calculates likelihood ratio statistics at a set of possible hotspots. Drawn from scanned controls, 100 individuals were randomly sampled from Han Chinese, Japanese and Korean samples. Three independent recombination hotspot inferences were analyzed and represented as three different colored lines in Fig. 1. Specifically, for the VTI1A regional plot, genotypes of 70 SNPs spanning chr10: 114,362,000 - 114,593,000 (UCSC Genome Build hg18) were phased using PHASE v2.153 to calculate background recombination rates. The PHASE outcome was used as direct input for the SequenceLDhot program and LD was estimated as r2 for 70 SNPs within a ∼230 kb region, and a heat map was drawn using the snp.plotter program54. Similarly, we started with the genotypes of 63 SNPs for the ROS1/DCBLD1 regional plot and the genotypes of 59 SNPs for the HLA class II locus.
Imputation analysis
To begin to fine map newly identified regions, we imputed all the SNPs catalogued in the 1000 Genomes Project data, March 2012 release, and the DCEG Imputation Reference Set version 127. The IMPUTE2 program28 was used to impute a 1 Mb region centered on the index SNP for each of the three regions, using recommended default settings. Imputed SNPs with INFO < 0.3 were excluded from association analysis using the SNPTEST program v2.3 (see URLs), which considered probabilistic genotypes out of imputation. Because 1000 Genomes Project data was based on the NCBI Build 37 reference genome, we conducted liftover (see URLs) on our scan data from Build 36 to 37 before imputation.
Data access
The CGEMS data portal provides access to individual level data for investigators from certified scientific institutions after approval of their submitted Data Access Request.
URLs
GLU: http://code.google.com/p/glu-genetics/
EIGENSTRAT: http://genepath.med.harvard.edu/∼reich/EIGENSTRAT.htm
STRUCTURE: http://pritch.bsd.uchicago.edu/structure.html
IMPUTE2: http://mathgen.stats.ox.ac.uk/impute/impute_v2.html
SNPTEST: https://mathgen.stats.ox.ac.uk/genetics_software/snptest/snptest.html
LIFTOVER: http://hgdownload.cse.ucsc.edu/downloads.html
Forest plots were generated using SAS v9.2. (http://support.sas.com/kb/43/855.html)
Supplementary Material
Acknowledgments
We thank J.-J. Yang, X.-N. Yang, Q. Zhou, W.-B. Guo, S.-L. Chen, Y. Huang, Z. Xie, J.-G. Chen, H.-H. Yan, K. Tajima, Y. Yatabe, T. Hida, K.-L. Chuah, A. Ng, P. Eng, S.-S. Leong, M.-K. Ang, E. Lim, T.-K. Lim, M. Teh, W.-T. Poh and A. Teh. The overall GWAS project was supported by the intramural program of the US National Institutes of Health/National Cancer Institute. A list of support provided to individual studies is provided in the Supplementary Note.
Study Support: The overall GWAS project was supported by the intramural program of the U.S. National Institutes of Health, National Cancer Institute. See Supplementary Note for support provided to individual studies.
Footnotes
Author Contributions: Q.L., N.R., S.J.C., D. Lin, C.A.H., Y.-C.H., K.M., A.S., H.D.H., J.Y.P., C.-J.C., Y.H.K., Y.T.K., C.L., Y.-L.W., P.-C.Y., B.Z., M.-H.S., J.F.F., K.C., W.Z., T.W., H.S., I.-S.C., D. Lu, N. Caporaso, W.P., R.K., J. Liu, M.T.L., N. Chatterjee, M.T. and M.Y. organized and designed the study. S.J.C., D. Lin, R.K., J. Liu, C.A.H., K.M., T.W., L.B., M.Y., J. Yuenger, Z.Y., C.W., H.G., A.H., W.W., Y.L., W.P., H.-C.L. and B.Z. conducted and supervised the genotyping of samples. Z.W., K.B.J., N.R., Q.L., S.J.C., N. Chatterjee, C.A.H., H.D.H., W.H., M.Y., I.-S.C., C.-F.H., W.-C.W., C.C.C., S.I.B., C.-H.C., R.V. and Y.-H.C. contributed to the design and execution of statistical analysis. Q.L., N.R., S.J.C., Z.W., W.H., C.C.C., C.A.H., K.M., Y.-C.H., A.S., H.D.H., N. Chatterjee, N. Caporaso, C.L., M.Y., B.A.B., M.T., S.-J.A., S.I.B., M.T.L., C.K., R.V., Y.-L.W., J.F.F. and I.-S.C. wrote the first draft of the manuscript. C.A.H., Q.L., B.Z., Y.-C.H., K.M., A.S., K.C., J.-C.W., M.P.W., W.Z., J.Y.P., W.H., C.-J.C., Y.H.K., Y.T.K., T.W., H.S., I.-S.C., T.M., H.N.K., F.W., Z.Y., C.W., S.-J.A., G.-C.C., B.Q., V.H.F.L., D. Lu, H.-S.J., J.S.S., J.H.K., Y.-T.G., Y.-H.T., Y.J.J., H.G., Z.H., I.-J.O., K.-Y.C., X.H., W.W., J.C., X.-C.Z., M.-S.H., H.Z., J. Wang, X.Z., J.E.C., W.-C.S., K.H.P., S.W.S., X.-O.S., Y.-M.C., L.L., C.H.K., L.H., Y.-C.K., T.-Y.Y., J.X., P.G., W.T., J.S., C.-L.W., H.L., A.D.L.S., Z.Z., Y.C., Y.Y.C., J.-Y.H., J.S.K., H.-I.Y., Q.C., C.-C.L., I.K.P., P.X., J.D., Q.H., R.-P.P., T.K., S.-S.K., C.-Y.C., R.V., J. Wu, W.-Y.L., K.-C.C., W.-H.C., B.-T.J., J.K.C.C., M.C., Y.-J.L., J. Yokota, J. Li, H.C., Y.-B.X., C.-J.Y., H.K., G.W., L.J., Y.-L.L., K.S., Y.-L.W., P.-C.Y., M.-H.S., J.F.F., D. Lin, S.J.C. and N.R. conducted the epidemiological studies and contributed samples to the GWAS and/or follow-up genotyping. All authors contributed to the writing of the manuscript.
Competing Financial Interests: The authors declare no competing financial interests.
References
- 1.Sun S, Schiller JH, Gazdar AF. Lung cancer in never smokers--a different disease. Nat Rev Cancer. 2007;7:778–790. doi: 10.1038/nrc2190. [DOI] [PubMed] [Google Scholar]
- 2.Sun Y, et al. Lung adenocarcinoma from East Asian never-smokers is a disease largely defined by targetable oncogenic mutant kinases. J Clin Oncol. 2010;28:4616–4620. doi: 10.1200/JCO.2010.29.6038. [DOI] [PMC free article] [PubMed] [Google Scholar]
- 3.Rudin CM, et al. Lung cancer in never smokers: molecular profiles and therapeutic implications. Clin Cancer Res. 2009;15:5646–5661. doi: 10.1158/1078-0432.CCR-09-0377. [DOI] [PMC free article] [PubMed] [Google Scholar]
- 4.Thun MJ, et al. Lung cancer occurrence in never-smokers: an analysis of 13 cohorts and 22 cancer registry studies. PLoS Med. 2008;5:e185. doi: 10.1371/journal.pmed.0050185. [DOI] [PMC free article] [PubMed] [Google Scholar]
- 5.Gao YT, et al. Lung cancer among Chinese women. Int J Cancer. 1987;40:604–609. doi: 10.1002/ijc.2910400505. [DOI] [PubMed] [Google Scholar]
- 6.Gu D, et al. Cigarette smoking and exposure to environmental tobacco smoke in China: the international collaborative study of cardiovascular disease in Asia. Am J Public Health. 2004;94:1972–1976. doi: 10.2105/ajph.94.11.1972. [DOI] [PMC free article] [PubMed] [Google Scholar]
- 7.Lan Q, Chapman RS, Schreinemachers DM, Tian L, He X. Household stove improvement and risk of lung cancer in Xuanwei, China. J Natl Cancer Inst. 2002;94:826–835. doi: 10.1093/jnci/94.11.826. [DOI] [PubMed] [Google Scholar]
- 8.Couraud S, Zalcman G, Milleron B, Morin F, Souquet PJ. Lung cancer in never smokers - A review. Eur J Cancer. 2012;48:1299–1311. doi: 10.1016/j.ejca.2012.03.007. [DOI] [PubMed] [Google Scholar]
- 9.Samet JM, et al. Lung cancer in never smokers: clinical epidemiology and environmental risk factors. Clin Cancer Res. 2009;15:5626–5645. doi: 10.1158/1078-0432.CCR-09-0376. [DOI] [PMC free article] [PubMed] [Google Scholar]
- 10.Lo YL, et al. Risk factors for primary lung cancer among never smokers by gender in a matched case-control study. Cancer Causes Control. 2012 doi: 10.1007/s10552-012-9994-x. Epub. [DOI] [PubMed] [Google Scholar]
- 11.Hsiung CA, et al. The 5p15.33 locus is associated with risk of lung adenocarcinoma in never-smoking females in Asia. PLoS Genet. 2010;6 doi: 10.1371/journal.pgen.1001051. [DOI] [PMC free article] [PubMed] [Google Scholar]
- 12.Landi MT, et al. A genome-wide association study of lung cancer identifies a region of chromosome 5p15 associated with risk for adenocarcinoma. Am J Hum Genet. 2009;85:679–691. doi: 10.1016/j.ajhg.2009.09.012. [DOI] [PMC free article] [PubMed] [Google Scholar]
- 13.Hosgood HD, III, et al. Genetic variant in TP63 on locus 3q28 is associated with risk of lung adenocarcinoma among never-smoking females in Asia. Hum Genet. 2012 doi: 10.1007/s00439-012-1144-8. Epub ahead of print. [DOI] [PMC free article] [PubMed] [Google Scholar]
- 14.Miki D, et al. Variation in TP63 is associated with lung adenocarcinoma susceptibility in Japanese and Korean populations. Nat Genet. 2010;42:893–896. doi: 10.1038/ng.667. [DOI] [PubMed] [Google Scholar]
- 15.Amundadottir L, et al. Genome-wide association study identifies variants in the ABO locus associated with susceptibility to pancreatic cancer. Nat Genet. 2009;41:986–990. doi: 10.1038/ng.429. [DOI] [PMC free article] [PubMed] [Google Scholar]
- 16.de Bakker PI, et al. Practical aspects of imputation-driven meta-analysis of genome-wide association studies. Hum Mol Genet. 2008;17:R122–R128. doi: 10.1093/hmg/ddn288. [DOI] [PMC free article] [PubMed] [Google Scholar]
- 17.Hu Z, et al. A genome-wide association study identifies two new lung cancer susceptibility loci at 13q12.12 and 22q12.2 in Han Chinese. Nat Genet. 2011;43:792–796. doi: 10.1038/ng.875. [DOI] [PubMed] [Google Scholar]
- 18.McKay JD, et al. Lung cancer susceptibility locus at 5p15.33. Nat Genet. 2008;40:1404–1406. doi: 10.1038/ng.254. [DOI] [PMC free article] [PubMed] [Google Scholar]
- 19.Truong T, et al. Replication of lung cancer susceptibility loci at chromosomes 15q25, 5p15, and 6p21: a pooled analysis from the International Lung Cancer Consortium. J Natl Cancer Inst. 2010;102:959–971. doi: 10.1093/jnci/djq178. [DOI] [PMC free article] [PubMed] [Google Scholar]
- 20.Shiraishi K, et al. A genome-wide association study identifies two new susceptibility loci for lung adenocarcinoma in the Japanese population. Nat Genet. 2012;44:900–903. doi: 10.1038/ng.2353. [DOI] [PubMed] [Google Scholar]
- 21.Amos CI, et al. Genome-wide association scan of tag SNPs identifies a susceptibility locus for lung cancer at 15q25.1. Nat Genet. 2008;40:616–622. doi: 10.1038/ng.109. [DOI] [PMC free article] [PubMed] [Google Scholar]
- 22.Hung RJ, et al. A susceptibility locus for lung cancer maps to nicotinic acetylcholine receptor subunit genes on 15q25. Nature. 2008;452:633–637. doi: 10.1038/nature06885. [DOI] [PubMed] [Google Scholar]
- 23.Wang Y, et al. Common 5p15.33 and 6p21.33 variants influence lung cancer risk. Nat Genet. 2008;40:1407–1409. doi: 10.1038/ng.273. [DOI] [PMC free article] [PubMed] [Google Scholar]
- 24.Wu C, et al. Genetic variants on chromosome 15q25 associated with lung cancer risk in Chinese populations. Cancer Res. 2009;69:5065–5072. doi: 10.1158/0008-5472.CAN-09-0081. [DOI] [PubMed] [Google Scholar]
- 25.Shi J, et al. Inherited Variation at Chromosome 12p13.33, Including RAD52, Influences the Risk of Squamous Cell Lung Carcinoma. Cancer Discov. 2012;2:131–139. doi: 10.1158/2159-8290.CD-11-0246. [DOI] [PMC free article] [PubMed] [Google Scholar]
- 26.Dong J, et al. Association analyses identify multiple new lung cancer susceptibility loci and their interactions with smoking in the Chinese population. Nat Genet. 2012;44:895–899. doi: 10.1038/ng.2351. [DOI] [PMC free article] [PubMed] [Google Scholar]
- 27.Wang Z, et al. Improved imputation of common and uncommon SNPs with a new reference set. Nat Genet. 2012;44:6–7. doi: 10.1038/ng.1044. [DOI] [PMC free article] [PubMed] [Google Scholar]
- 28.Howie BN, Donnelly P, Marchini J. A flexible and accurate genotype imputation method for the next generation of genome-wide association studies. PLoS Genet. 2009;5:e1000529. doi: 10.1371/journal.pgen.1000529. [DOI] [PMC free article] [PubMed] [Google Scholar]
- 29.Ramirez DM, Khvotchev M, Trauterman B, Kavalali ET. Vti1a identifies a vesicle pool that preferentially recycles at rest and maintains spontaneous neurotransmission. Neuron. 2012;73:121–134. doi: 10.1016/j.neuron.2011.10.034. [DOI] [PMC free article] [PubMed] [Google Scholar]
- 30.Kunwar AJ, et al. Lack of the endosomal SNAREs vti1a and vti1b led to significant impairments in neuronal development. Proc Natl Acad Sci U S A. 2011;108:2575–2580. doi: 10.1073/pnas.1013891108. [DOI] [PMC free article] [PubMed] [Google Scholar]
- 31.Bose A, et al. The v-SNARE Vti1a regulates insulin-stimulated glucose transport and Acrp30 secretion in 3T3-L1 adipocytes. J Biol Chem. 2005;280:36946–36951. doi: 10.1074/jbc.M508317200. [DOI] [PubMed] [Google Scholar]
- 32.Petridou ET, et al. Circulating adiponectin levels and expression of adiponectin receptors in relation to lung cancer: two case-control studies. Oncology. 2007;73:261–269. doi: 10.1159/000127424. [DOI] [PubMed] [Google Scholar]
- 33.Bass AJ, et al. Genomic sequencing of colorectal adenocarcinomas identifies a recurrent VTI1A-TCF7L2 fusion. Nat Genet. 2011;43:964–968. doi: 10.1038/ng.936. [DOI] [PMC free article] [PubMed] [Google Scholar]
- 34.Lemmon MA, Schlessinger J. Cell signaling by receptor tyrosine kinases. Cell. 2010;141:1117–1134. doi: 10.1016/j.cell.2010.06.011. [DOI] [PMC free article] [PubMed] [Google Scholar]
- 35.Acquaviva J, Wong R, Charest A. The multifaceted roles of the receptor tyrosine kinase ROS in development and cancer. Biochim Biophys Acta. 2009;1795:37–52. doi: 10.1016/j.bbcan.2008.07.006. [DOI] [PubMed] [Google Scholar]
- 36.Li C, et al. Spectrum of oncogenic driver mutations in lung adenocarcinomas from East Asian never smokers. PLoS One. 2011;6:e28204. doi: 10.1371/journal.pone.0028204. [DOI] [PMC free article] [PubMed] [Google Scholar]
- 37.Rikova K, et al. Global survey of phosphotyrosine signaling identifies oncogenic kinases in lung cancer. Cell. 2007;131:1190–1203. doi: 10.1016/j.cell.2007.11.025. [DOI] [PubMed] [Google Scholar]
- 38.Takeuchi K, et al. RET, ROS1 and ALK fusions in lung cancer. Nat Med. 2012;18:378–381. doi: 10.1038/nm.2658. [DOI] [PubMed] [Google Scholar]
- 39.Bergethon K, et al. ROS1 rearrangements define a unique molecular class of lung cancers. J Clin Oncol. 2012;30:863–870. doi: 10.1200/JCO.2011.35.6345. [DOI] [PMC free article] [PubMed] [Google Scholar]
- 40.Kim M, et al. Epigenetic down-regulation and suppressive role of DCBLD2 in gastric cancer cell proliferation and invasion. Mol Cancer Res. 2008;6:222–230. doi: 10.1158/1541-7786.MCR-07-0142. [DOI] [PubMed] [Google Scholar]
- 41.Koshikawa K, et al. Significant up-regulation of a novel gene, CLCP1, in a highly metastatic lung cancer subline as well as in lung cancers in vivo. Oncogene. 2002;21:2822–2828. doi: 10.1038/sj.onc.1205405. [DOI] [PubMed] [Google Scholar]
- 42.Nagai H, et al. CLCP1 interacts with semaphorin 4B and regulates motility of lung cancer cells. Oncogene. 2007;26:4025–4031. doi: 10.1038/sj.onc.1210183. [DOI] [PubMed] [Google Scholar]
- 43.Silverberg MS, et al. Ulcerative colitis-risk loci on chromosomes 1p36 and 12q15 found by genome-wide association study. Nat Genet. 2009;41:216–220. doi: 10.1038/ng.275. [DOI] [PMC free article] [PubMed] [Google Scholar]
- 44.Urayama KY, et al. Genome-wide association study of classical Hodgkin lymphoma and Epstein-Barr virus status-defined subgroups. J Natl Cancer Inst. 2012;104:240–253. doi: 10.1093/jnci/djr516. [DOI] [PMC free article] [PubMed] [Google Scholar]
- 45.Nakanishi K, Shima Y. Capture of type 1 diabetes-susceptible HLA DR-DQ haplotypes in Japanese subjects using a tag single nucleotide polymorphism. Diabetes Care. 2010;33:162–164. doi: 10.2337/dc09-1210. [DOI] [PMC free article] [PubMed] [Google Scholar]
- 46.Chanock SJ, Hunter DJ. Genomics: when the smoke clears. Nature. 2008;452:537–538. doi: 10.1038/452537a. [DOI] [PubMed] [Google Scholar]
- 47.Spitz MR, Amos CI, Dong Q, Lin J, Wu X. The CHRNA5-A3 region on chromosome 15q24-25.1 is a risk factor both for nicotine dependence and for lung cancer. J Natl Cancer Inst. 2008;100:1552–1556. doi: 10.1093/jnci/djn363. [DOI] [PMC free article] [PubMed] [Google Scholar]
- 48.Wang Y, Broderick P, Matakidou A, Eisen T, Houlston RS. Chromosome 15q25 (CHRNA3-CHRNA5) variation impacts indirectly on lung cancer risk. PLoS One. 2011;6:e19085. doi: 10.1371/journal.pone.0019085. [DOI] [PMC free article] [PubMed] [Google Scholar]
- 49.Patterson N, Price AL, Reich D. Population structure eigenanalysis. PLoS Genet. 2006;2:e190. doi: 10.1371/journal.pgen.0020190. [DOI] [PMC free article] [PubMed] [Google Scholar]
- 50.Price AL, et al. Principal components analysis corrects for stratification in genome-wide association studies. Nat Genet. 2006;38:904–909. doi: 10.1038/ng1847. [DOI] [PubMed] [Google Scholar]
- 51.Fearnhead P. SequenceLDhot: detecting recombination hotspots. Bioinformatics. 2006;22:3061–3066. doi: 10.1093/bioinformatics/btl540. [DOI] [PubMed] [Google Scholar]
- 52.Fearnhead P, Harding RM, Schneider JA, Myers S, Donnelly P. Application of coalescent methods to reveal fine-scale rate variation and recombination hotspots. Genetics. 2004;167:2067–2081. doi: 10.1534/genetics.103.021584. [DOI] [PMC free article] [PubMed] [Google Scholar]
- 53.Abnet CC, et al. Genotypic variants at 2q33 and risk of esophageal squamous cell carcinoma in China: a meta-analysis of genome-wide association studies. Hum Mol Genet. 2012;21:2132–2141. doi: 10.1093/hmg/dds029. [DOI] [PMC free article] [PubMed] [Google Scholar]
- 54.Luna A, Nicodemus KK. snp.plotter: an R-based SNP/haplotype association and linkage disequilibrium plotting package. Bioinformatics. 2007;23:774–776. doi: 10.1093/bioinformatics/btl657. [DOI] [PubMed] [Google Scholar]
Associated Data
This section collects any data citations, data availability statements, or supplementary materials included in this article.