

Abstract
Lean body mass (LBM) is a heritable trait predicting a series of health problems, such as osteoporotic fracture and sarcopenia. We aim to identify sequence variants associated with LBM by a genome-wide association study (GWAS) of copy number variants (CNVs). We genotyped genome-wide CNVs of 1627 individuals of the Chinese population with Affymetrix SNP6.0 genotyping platform, which comprised of 9 40 000 copy number probes. We then performed a GWAS of CNVs with lean mass at seven sites: left and right arms, left and right legs, total of limb, trunk and whole body. We identified a CNV that is associated with LBM variation at the genome-wide significance level (CNV2073, Bonferroni corrected P-value 0.002 at right arm). CNV2073 locates at chromosome 15q13.3, which has been implicated as a candidate region for LBM by our previous linkage studies. The nearest gene, gremlin1, has a key role in the regulation of skeletal muscle formation and repair. Our results suggest that the gremlin1 gene is a potentially important gene for LBM variation. Our findings also show the utility and efficacy of CNV as genetic markers in association studies.
Keywords: association, copy number variation, gremlin1 gene, lean body mass, 15q13.3
INTRODUCTION
Loss and function impairment of skeletal muscle is a common skeletal disorder affecting millions of people worldwide, especially in the elderly. Its most severe outcome is to predispose people to sarcopenia. It is also related to a series of other diseases and health problems, such as osteoporosis (MIM 166710), fracture, impaired protein balance, dyslipidemia (MIM 151660), obesity (MIM 601665), insulin resistance, overall frailty and increased mortality.1,2 Skeletal muscle is characterized by the measurement of lean body mass (LBM), which is the single best predictor for sarcopenia. LBM is highly inheritable, with estimated heritability ranging from 52 to 84%.3–5 However, only a few genes for LBM have so far emerged,6 leaving the majority of the genetic background of LBM still unknown.
Traditional association analysis has focused largely on single nucleotide polymorphisms (SNPs). This assessment of SNP variation has proven fruitful; hundreds of common variants have been found to be associated with diseases such as obesity, osteoporosis, type 2 diabetes and immunological disease.7 However, recent studies have shown that another type of genomic variation, copy number variations (CNVs), has a significant role in influencing common diseases as well, and are likely to be at reasonably high frequencies in the population. Recent data imply that CNVs account for up to 4 Mb of genetic differences, whereas that for SNP variation is only 2.5 Mb.8 The widespread distribution of CNVs across the genome has made it an important type of genetic variation for identifying disease-associated genetic loci. Many diseases are found to be associated with copy number (CN) changes, including osteoporosis,9 lupus glomerulonephritis,10 autism,11 and HIV infection and progression.12 Therefore, investigation of CNVs would contribute to unravel the genetic basis of complex diseases and phenotypes. Nonetheless, to the best of our knowledge, there is no CNV-aimed association study on LBM reported. It is largely unknown whether CNV underlies the variation of LBM. In this study, we report a CNV-based genome-wide association study (GWAS) to identify genetic loci influencing LBM variation.
MATERIALS AND METHODS
Study subjects
The study sample consisted of 1627 (802 males and 825 females) unrelated Chinese-Han subjects living in the cities of Xi’an/Changsha and their neighboring areas. The study was approved by the local institutional review board. After signing an informed consent, all subjects received assistance in completing a structured questionnaire including questions about anthropometric variables, lifestyle, diet, family information and medical history, and so on.
Phenotyping
The cohort was recruited for studies aimed in searching for genes underlying body compositions (bone mass, fat mass and lean mass). Body composition was measured using a dual-energy X-ray absorptiometry scanner Hologic QDR 4500W (Hologic Inc., Bedford, MA, USA), following the manufacturer’s protocol. A dual-energy X-ray absorptiometry scan can accurately measure total body and regional bone mass, fat mass and fat-free mass. Lean mass is calculated by taking bone mass away from fat-free mass.13,14 After removal of all metals, a subject laid on a bed and was scanned from head to toe. Whole body composition, body compositions at sub-regions, such as head, trunk and limb, were measured by the dual-energy X-ray absorptiometry scanner.
To ensure the quality of collected data, all scans were conducted, reviewed and analyzed by a clinical expert. Body weight, height and age were obtained on the same visit. In this study, lean mass at four limbs, trunk and whole body were analyzed as main phenotypes.
Genome-wide genotyping and quality controls (QC)
Genomic DNA was extracted from peripheral blood leukocytes using standard protocols. Genome-Wide Human SNP Array 6.0 (Affymetrix Inc., Santa Clara, CA, USA), which includes 906 600 SNPs and 9 40 000 CN probes, was used to genotype each subject, according to the Affymetrix protocol. Briefly, ~250 ng of genomic DNA was digested with restriction enzyme NspI and StyI. Digested DNA was adaptor ligated and PCR amplified for each sample. Fragment PCR products were then labeled with biotin, denatured and hybridized to the arrays. Arrays were then washed and stained using phycoerythrin on Affymetrix Fluidics Station, and scanned using the GeneChip Scanner 30007G to quantify fluorescence intensities (Affymetrix Inc.). Data management and analyses were conducted using the Affymetrix Genotyping Command Console. The Affymetrix contrast QC threshold was set at the default value of greater than 0.4 for sample QC. The final average contrast QC across the entire sample reached a high level of 2.62.
Assessment of genetic background
The method of genomic control implemented in the STRUCTURE2.2 program15 was used to detect possible population stratification of the study sample. For structure analysis, 2000 SNPs were randomly selected at the genome for clustering of all the subjects. The program uses a Markov chain Monte Carlo algorithm to cluster individuals into different cryptic subpopulations based on multilocus genotype data. Potential substructure was estimated under a priori assumption of K=2 discrete subpopulations. To cross-validate the results, we also conducted principal component analysis on selected genotypes using EIGENSTRAT.16 The calculated principal components are informative to correct for potential population stratification in subsequent association analyses.
CNV determination
CNVs were identified using the CANARY algorithm implemented in the Birdsuite software (Affymetrix Inc.),17 which utilized a previously defined CNV map based on HapMap samples.17 In order to generate results with high confidence, we conducted QC filtering both at the sample level and the CNV level, according to the previously reported methods.17 First, for the sample level QC, we used three quality metrics reported by the Birdseye method to evaluate the initial 1627 subjects for quality in CN genotyping. The following procedures were adopted: (1) we removed any sample that was greater or less than three s.d. values from the average estimate of CN, which was approximate two copies at genome-wide level; (2) we calculated the variability in CN and SNP probe intensities with each standardized per chromosome. We removed any sample with three s.d. values more than these estimates on the average genome-wide level; (3) we removed any sample in which more than two chromosomes failed any of these three metrics, that is, more than three values in estimated CN or excessive CNV or SNP variability for the chromosome.
Second, we conducted QC filtering at the CNV level. Out of the initial 1280 CNVs, we discarded (1) any CNVs in which more than 5% of the copy calls were uncertain (confidence score >0.1) or missing, and (2) any CNVs with the frequency of major variant greater than 99%. The filtering procedure resulted in 603 CNVs available for subsequent association analyses.
Statistical analyses
Lean mass at the following seven sites was analyzed: left and right arms, left and right legs, subtotal of limbs, trunk and whole body. Each phenotype was adjusted by age, gender, and the first two principal components calculated from the 2000 selected SNPs. Residual phenotypes were normalized by inverse quantile of the standard normal distribution, which imposes a standard normal distribution on the phenotype to be analyzed. Covariate adjustment and phenotype normalization were performed with Minitab (Minitab Inc., State College, PA, USA).
Association of lean mass and CNV was performed by a linear regression model using PLINK.18 In brief, CNVs were treated as predictors for lean mass. The PLINK input genotype file set includes three files: a family file, a map file and a gvar file. The family file and map file describe individuals and variants, and gvar describes the paternal and maternal origins of the derived CNs. Each row in a family file represents one subject with the following fields separated by a tab: family id, subject id, father id, mother id, sex and phenotype. Each row in a map file represents one variant with the following fields: chromosome, CNV id, genetic distance and start physical position. Each row in a gvar file has seven fields: family id, subject id, CNV id, first CN, first dosage, second CN and second dosage. Here, first CN and first dosage are the allele inherited from the first parent and its dosage, and the same for the second ones. The command implemented the association test is
The output file lists P-values for all CNVs.
We adopted the strict Bonferroni correction to account for multiple testing comparisons. Raw P-values were adjusted by the product of the number of CNVs (603) and the number of phenotypes (7). Significant results were declared at nominal level 0.05 after correction, corresponding to the genome-wide significance level 1.18E-5.
RESULTS
Basic characteristics of the sample are summarized in Table 1. The STRUCTURE8 program clustered all subjects into one single homogeneous population (see Supplementary Figure S1). The estimated inflation factor (λ) from association analyses is 1.02, below the level of typical deviation for population stratification. All these results indicate that population stratification is not likely to present in the studied sample.
Table 1.
Basic characteristics of the study sample
| Trait | Total (N=1627) | Male (N=802) | Female (N=825) |
|---|---|---|---|
| Age (year) | 34.49 (13.24) | 31.43 (11.93) | 37.46 (13.77) |
| Height (cm) | 164.25 (8.16) | 170.27 (5.96) | 158.38 (5.22) |
| Weight (kg) | 65.72 (9.61) | 65.74 (9.64) | 54.63 (8.09) |
| W-body-lean (kg) | 45.29 (9.26) | 52.83 (5.95) | 37.95 (4.13) |
| Trunk-lean (kg) | 21.33 (3.98) | 24.44 (2.89) | 18.31 (2.14) |
| L-leg-lean (kg) | 7.39 (1.72) | 8.80 (1.19) | 6.01 (0.79) |
| R-leg-lean (kg) | 7.49 (1.76) | 8.94 (1.21) | 6.09 (0.81) |
| L-arm-lean (kg) | 2.35 (0.75) | 2.98 (0.51) | 1.74 (0.31) |
| R-arm-lean (kg) | 2.55 (0.81) | 3.22 (0.55) | 1.91 (0.37) |
| Subtotal-lean (kg) | 41.12 (8.70) | 48.38 (5.77) | 34.06 (3.97) |
Abbreviations: L, left; R, right; W, whole.
Note: data presented are unadjusted means (s.d.).
There is one CNV, CNV2073, which hits the genome-wide significance level with raw P-value 6.22E-7 (Bonferroni corrected P-value=0.002) for lean mass at the right arm (R-arm). Figure 1 displays the Manhattan plot of genome-wide scan for this phenotype. The association of this CNV and lean mass is also nominally significant at most other sites, though none of them achieves a genome-wide significance level (Table 2). Table 2 also lists the association results of the top 10 CNVs ranked according to P-values for lean mass at R-arm.
Figure 1.
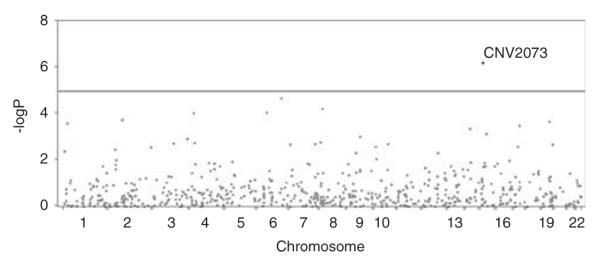
Manhattan plot of lean mass at R-arm. The y axis represents −log10P, and x axis represents the start physical position of CNV along chromosomes. The plot displays P-values of lean mass at right arm for all 603 CNVs. The line shows the threshold for genome-wide signifcance level. The figure shows that CNV2073 is significant at genome-wide level 1.18E-5.
Table 2.
P-values of the top 10 CNVs
| P-value |
|||||||||||
|---|---|---|---|---|---|---|---|---|---|---|---|
| CNV | CHR | Start | End | Freq | R-arm | L-arm | R-leg | L-leg | Subtotal | Trunk | W-body |
| CNV 2073 | 15 | 28377089 | 28536721 | 0.19 | 6.22E-07 | 6.53E-06 | 3.74E-04 | 3.83E-04 | 1.19E-03 | 0.12 | 3.85E-03 |
| 2.62E-03 | 0.03 | 1 | 1 | 1 | 1 | 1 | |||||
| CNV 1010 | 6 | 134592448 | 134598896 | 0.12 | 2.00E-05 | 4.31E-05 | 0.01 | 0.01 | 4.79E-03 | 0.03 | 7.82E-03 |
| 0.08 | 0.18 | 1 | 1 | 1 | 1 | 1 | |||||
| CNV 1253 | 8 | 12260380 | 12286526 | 0.4 | 5.81E-05 | 7.78E-04 | 0.01 | 0.1 | 0.07 | 0.32 | 0.08 |
| 0.25 | 1 | 1 | 1 | 1 | 1 | 1 | |||||
| CNV 944 | 6 | 49039688 | 49043159 | 0.19 | 8.72E-05 | 3.64E-05 | 3.97E-04 | 0.01 | 0.03 | 0.36 | 0.04 |
| 0.37 | 0.15 | 1 | 1 | 1 | 1 | 1 | |||||
| CNV 10674 | 4 | 18697657 | 18733331 | 0.06 | 9.24E-05 | 2.86E-05 | 0.08 | 0.29 | 0.06 | 0.34 | 0.11 |
| 0.39 | 0.12 | 1 | 1 | 1 | 1 | 1 | |||||
| CNV 243 | 2 | 79184286 | 79195607 | 0.03 | 1.71E-04 | 5.37E-05 | 0.3 | 0.36 | 0.02 | 0.86 | 0.02 |
| 0.72 | 0.22 | 1 | 1 | 1 | 1 | 1 | |||||
| CNV 2406 | 19 | 40541333 | 40553688 | 0.44 | 1.96E-04 | 1.17E-04 | 0.01 | 0.01 | 9.25E-03 | 0.03 | 7.73E-03 |
| 0.82 | 0.49 | 1 | 1 | 1 | 1 | 1 | |||||
| CNV 22 | 1 | 17067742 | 17134834 | 0.36 | 2.33E-04 | 2.91E-04 | 0.02 | 0.01 | 5.02E-03 | 0.09 | 0.02 |
| 0.98 | 1 | 1 | 1 | 1 | 1 | 1 | |||||
| CNV 2267 | 17 | 41006741 | 41015665 | 0.46 | 2.91E-04 | 3.26E-03 | 0.03 | 0.03 | 8.68E-03 | 0.09 | 0.03 |
| 1 | 1 | 1 | 1 | 1 | 1 | 1 | |||||
| CNV 12158 | 14 | 40541848 | 40555277 | 0.01 | 4.24E-04 | 1.66E-05 | 1.51E-03 | 3.45E-04 | 3.03E-03 | 0.04 | 3.86E-03 |
| 1 | 0.07 | 1 | 1 | 1 | 1 | 1 | |||||
Abbreviations: CHR, chromosome; CNV, copy number variant; Freq, frequency of the least frequent copy number; L, left; R, right; w, whole.
P-value was estimated by regression analysis. For each CNV, P-values at the first row are raw P-values and that at the second row are Bonferroni corrected ones; significant results after correction are marked in bold.
CNV2073 locates from 2 83 77 089 to 2 85 36 721 bp (NCBI build 36.3) at chromosome 15q13.3. Three types of CN exist in the sample: CN=2, 3, and 4, with frequencies 0.06, 0.13 and 0.81, respectively. Compared with subjects with two CNs (normal diploid), subjects with three copies had 6.9% lower mean lean mass at R-arm, and subjects with four copies had 11.2% lower lean mass at R-arm (Figure 2). Linear regression analysis showed that CNV15q13.3 contributed to 1.0% of the total lean mass variance at R-arm.
Figure 2.
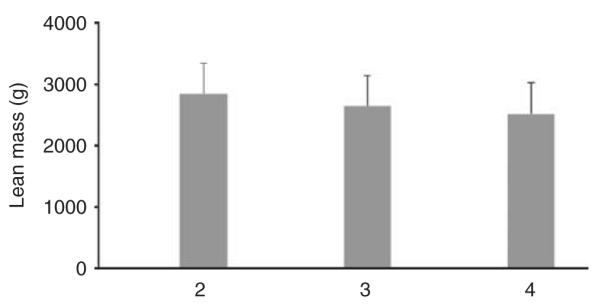
Mean R-arm lean mass values at different copy numbers for CNV2073. Copy numbers of 2, 3 and 4 exist for CNV2073. The y axis represents the mean lean mass at the right arm for a particular copy number. Error bars denote standard error.
Two genes, gremlin1 and chrfam7a, locate in the region 15q13.3, which is covered by CNV2073. Of them, gremlin1 is of particular interest. It is a candidate gene for LBM reported by both molecular function study19–21 and previous genetic linkage studies.22,23 However, none of previous association studies has linked this gene to LBM variation yet.
DISCUSSION
Lean mass has a considerable heritability. Although previous SNP-aimed association studies have identified several candidate genes,6 vast majority of genetic mechanisms of lean mass remains unclear, which may reside in CNVs. To the best of our knowledge, this is the first GWAS between lean mass and CNVs in the Chinese population. We identified a candidate genomic region 15q13.3 and an associated gene gremlin1 at the genome-wide significance level. Notably, this region was also indicated to be important for lean mass variation in our two previous linkage studies.22,23 The first study performed a large-scale whole genome linkage scan for lean mass involving 4498 individuals from 451 Caucasian families. The most pronounced linkage signal was found at 15q13.3 with the LOD score 4.86.22 The second genome-wide linkage scan of 434 Caucasian pedigrees gave a suggestive linkage signal at this region with the LOD score 2.72.23 The current study first implied that this region is also associated with lean mass in the Chinese population.
The associated gene gremlin1 and CNV2073 are about 2 MB apart. The gene is a member of the bone morphogenetic protein (BMP) antagonistic family. It was first cloned from a Xenopus ovarian library for its axial patterning activities. The human gremlin1 gene encodes for a glycosylated homodimeric peptide of 28 kDa with 184 amino acids.24 As an antagonist to BMP, the regulation of gremlin1 is essential for mesoderm induction, establishment of dorsoventral polarity, ectodermal differentiation, somite formation and myogenesis induction.24
It is well known that the reduction of lean mass with aging is caused by the atrophy of type II myofiber.25,26 The capacity of generating new myonuclei for myofiber repair, growth, or replacement is dependent upon the persistence of skeletal satellite cells.27,28 The proliferation and differentiation of skeletal satellite cell is activated by the expression of the myogenin regulatory factor MyoD, which, in turn, is down-regulated by BMP4. Gremlin1, as an antagonist to BMP4, therefore promotes the expression of MyoD, and the generation and repair of lean mass.29,30 Figure 3 illustrate the regulation pathways of the effect of gremlin1 on lean mass.
Figure 3.
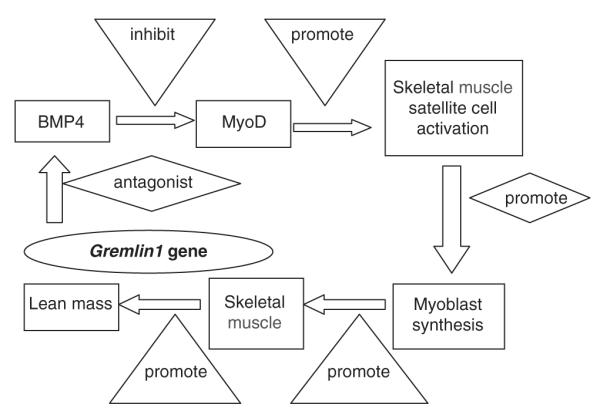
Hypothesized functional mechanism of gremlin1 to lean mass. In this plot, gremlin1 antagonizes the activity of bone morphogenetic protein 4 (BMP4), which inhibits the expression of MyoD. MyoD is a protein with a key role in upregulating muscle differentiation by stimulating the activity of skeletal muscle satellite cells. As a result, the synthesis of myoblast gets activated, and the levels of skeletal muscle and lean mass increase.
With the same sample pool and analytical approach, we performed another CNV-based GWAS previously.9 The identified CNVs were successfully validated by real-time PCR in that study. Therefore, though the identified CNV was not further validated by real-time PCR in this study, it may still be highly reliable.
In conclusion, we have conducted a GWAS between CNVs and lean mass in the Chinese population, and identified a significant gene gremlin1 in the region 15q13.3. Our study strengthens our understanding of the genetic determinants underlying sarcopenia-related phenotypes, and contributes to further functional studies.
Supplementary Material
ACKNOWLEDGEMENTS
The study was partially supported by Shanghai Leading Academic Discipline Project (S30501) and startup fund from Shanghai University of Science and Technology. The investigators of this work were partially supported by grants from NIH (P50AR055081, R01AG026564, R01AR050496, RC2DE020756, R01AR057049, and R03TW008221) and the Franklin D. Dickson/Missouri Endowment and the Edward G. Schlieder Endowment. Lei Zhang was supported by National Natural Science Foundation of China project (31100902). This work was partially supported by Shanghai Pujiang Program (10PJ1407700) for Yan Zhang.
Footnotes
Supplementary Information accompanies the paper on Journal of Human Genetics website (http://www.nature.com/jhg)
References
- 1.Sipila S, Heikkinen E, Cheng S, Suominen H, Saari P, Kovanen V, et al. Endogenous hormones, muscle strength, and risk of fall-related fractures in older women. J. Gerontol. A Biol. Sci. Med. Sci. 2006;61:92–96. doi: 10.1093/gerona/61.1.92. [DOI] [PubMed] [Google Scholar]
- 2.Karakelides H, Nair KS. Sarcopenia of aging and its metabolic impact. Curr. Top Dev. Biol. 2005;68:123–148. doi: 10.1016/S0070-2153(05)68005-2. [DOI] [PubMed] [Google Scholar]
- 3.Hsu FC, Lenchik L, Nicklas BJ, Lohman K, Register TC, Mychaleckyj J, et al. Heritability of body composition measured by DXA in the diabetes heart study. Obes. Res. 2005;13:312–319. doi: 10.1038/oby.2005.42. [DOI] [PubMed] [Google Scholar]
- 4.Keen-Kim D, Mathews CA, Reus VI, Lowe TL, Herrera LD, Budman CL, et al. Overrepresentation of rare variants in a specific ethnic group may confuse interpretation of association analyses. Hum. Mol. Genet. 2006;15:3324–3328. doi: 10.1093/hmg/ddl408. [DOI] [PubMed] [Google Scholar]
- 5.Nguyen TV, Howard GM, Kelly PJ, Eisman JA. Bone mass, lean mass, and fat mass: same genes or same environments? Am. J. Epidemiol. 1998;147:3–16. doi: 10.1093/oxfordjournals.aje.a009362. [DOI] [PubMed] [Google Scholar]
- 6.Liu XG, Tan LJ, Lei SF, Liu YJ, Shen H, Wang L, et al. Genome-wide association and replication studies identified TRHR as an important gene for lean body mass. Am. J. Hum. Genet. 2009;84:418–423. doi: 10.1016/j.ajhg.2009.02.004. [DOI] [PMC free article] [PubMed] [Google Scholar]
- 7.Hindorff LA, Junkons HA, Mehta JP, TA M. A catalog of published genome-wide association studies. National Human Genome Research Institute; 2009. ( http://www.genome.gov/26525384) [Google Scholar]
- 8.Feuk L, Carson AR, Scherer SW. Structural variation in the human genome. Nat Rev. Genet. 2006;7:85–97. doi: 10.1038/nrg1767. [DOI] [PubMed] [Google Scholar]
- 9.Yang TL, Chen XD, Guo Y, Lei SF, Wang JT, Zhou Q, et al. Genome-wide copy-number-variation study identified a susceptibility gene, UGT2B17, for osteoporosis. Am. J. Hum. Genet. 2008;83:663–674. doi: 10.1016/j.ajhg.2008.10.006. [DOI] [PMC free article] [PubMed] [Google Scholar]
- 10.Aitman TJ, Dong R, Vyse TJ, Norsworthy PJ, Johnson MD, Smith J, et al. Copy number polymorphism in Fcgr3 predisposes to glomerulonephritis in rats and humans. Nature. 2006;439:851–855. doi: 10.1038/nature04489. [DOI] [PubMed] [Google Scholar]
- 11.Glessner JT, Wang K, Cai G, Korvatska O, Kim CE, Wood S, et al. Autism genome-wide copy number variation reveals ubiquitin and neuronal genes. Nature. 2009;459:569–573. doi: 10.1038/nature07953. [DOI] [PMC free article] [PubMed] [Google Scholar]
- 12.Degenhardt JD, de Candia P, Chabot A, Schwartz S, Henderson L, Ling B, et al. Copy number variation of CCL3-like genes affects rate of progression to simian-AIDS in Rhesus Macaques (Macaca mulatta) PLoS Genet. 2009;5:e1000346. doi: 10.1371/journal.pgen.1000346. [DOI] [PMC free article] [PubMed] [Google Scholar]
- 13.Hansen RD, Raja C, Aslani A, Smith RC, Allen BJ. Determination of skeletal muscle and fat-free mass by nuclear and dual-energy x-ray absorptiometry methods in men and women aged 51-84 y (1-3) Am. J. Clin. Nutr. 1999;70:228–233. doi: 10.1093/ajcn.70.2.228. [DOI] [PubMed] [Google Scholar]
- 14.Payette H, Hanusaik N, Boutier V, Morais JA, Gray-Donald K. Muscle strength and functional mobility in relation to lean body mass in free-living frail elderly women. Eur. J. Clin. Nutr. 1998;52:45–53. doi: 10.1038/sj.ejcn.1600513. [DOI] [PubMed] [Google Scholar]
- 15.Pritchard JK, Stephens M, Donnelly P. Inference of population structure using multilocus genotype data. Genetics. 2000;155:945–959. doi: 10.1093/genetics/155.2.945. [DOI] [PMC free article] [PubMed] [Google Scholar]
- 16.Price AL, Patterson NJ, Plenge RM, Weinblatt ME, Shadick NA, Reich D. Principal components analysis corrects for stratification in genome-wide association studies. Nat. Genet. 2006;38:904–909. doi: 10.1038/ng1847. [DOI] [PubMed] [Google Scholar]
- 17.Kathiresan S, Voight BF, Purcell S, Musunuru K, Ardissino D, Mannucci PM, et al. Genome-wide association of early-onset myocardial infarction with single nucleotide polymorphisms and copy number variants. Nat. Genet. 2009;41:334–341. doi: 10.1038/ng.327. [DOI] [PMC free article] [PubMed] [Google Scholar]
- 18.Purcell S, Neale B, Todd-Brown K, Thomas L, Ferreira MA, Bender D, et al. PLINK: a tool set for whole-genome association and population-based linkage analyses. Am. J. Hum. Genet. 2007;81:559–575. doi: 10.1086/519795. [DOI] [PMC free article] [PubMed] [Google Scholar]
- 19.Petrovsky N, Schmechtig A, Flomen RH, Kumari V, Collier D, Makoff A, et al. CHRFAM7A copy number and 2-bp deletion polymorphisms and antisaccade performance. Int. J. Neuropsychopharmacol. 2009;12:267–273. doi: 10.1017/S1461145708009784. [DOI] [PubMed] [Google Scholar]
- 20.Severance EG, Dickerson FB, Stallings CR, Origoni AE, Sullens A, Monson ET, et al. Differentiating nicotine- versus schizophrenia-associated decreases of the alpha7 nicotinic acetylcholine receptor transcript, CHRFAM7A, in peripheral blood lymphocytes. J. Neural. Transm. 2009;116:213–220. doi: 10.1007/s00702-008-0164-y. [DOI] [PubMed] [Google Scholar]
- 21.Sinkus ML, Lee MJ, Gault J, Logel J, Short M, Freedman R, et al. A 2-base pair deletion polymorphism in the partial duplication of the alpha7 nicotinic acetylcho-line gene (CHRFAM7A) on chromosome 15q14 is associated with schizophrenia. Brain Res. 2009;1291:1–11. doi: 10.1016/j.brainres.2009.07.041. [DOI] [PMC free article] [PubMed] [Google Scholar]
- 22.Wang XL, Deng FY, Tan LJ, Deng HY, Liu YZ, Papasian CJ, et al. Bivariate whole genome linkage analyses for total body lean mass and BMD. J. Bone Miner. Res. 2008;23:447–452. doi: 10.1359/JBMR.071033. [DOI] [PMC free article] [PubMed] [Google Scholar]
- 23.Zhao LJ, Xiao P, Liu YJ, Xiong DH, Shen H, Recker RR, et al. A genome-wide linkage scan for quantitative trait loci underlying obesity related phenotypes in 434 Caucasian families. Hum. Genet. 2007;121:145–148. doi: 10.1007/s00439-006-0286-y. [DOI] [PubMed] [Google Scholar]
- 24.Gazzerro E, Canalis E. Bone morphogenetic proteins and their antagonists. Rev. Endocr. Metab. Disord. 2006;7:51–65. doi: 10.1007/s11154-006-9000-6. [DOI] [PubMed] [Google Scholar]
- 25.Janssen I, Heymsfield SB, Wang ZM, Ross R. Skeletal muscle mass and distribution in 468 men and women aged 18–88 yr. J. Appl. Physiol. 2000;89:81–88. doi: 10.1152/jappl.2000.89.1.81. [DOI] [PubMed] [Google Scholar]
- 26.Lexell J. Human aging, muscle mass, and fiber type composition. J. Gerontol. A Biol. Sci. Med. Sci. 1995;50(Spec No):11–16. doi: 10.1093/gerona/50a.special_issue.11. [DOI] [PubMed] [Google Scholar]
- 27.Snijders T, Verdijk LB, van Loon LJ. The impact of sarcopenia and exercise training on skeletal muscle satellite cells. Ageing Res. Rev. 2009;8:328–338. doi: 10.1016/j.arr.2009.05.003. [DOI] [PubMed] [Google Scholar]
- 28.Thornell LE, Lindstrom M, Renault V, Mouly V, Butler-Browne GS. Satellite cells and training in the elderly. Scand. J. Med. Sci. Sports. 2003;13:48–55. doi: 10.1034/j.1600-0838.2003.20285.x. [DOI] [PubMed] [Google Scholar]
- 29.Reshef R, Maroto M, Lassar AB. Regulation of dorsal somitic cell fates: BMPs and Noggin control the timing and pattern of myogenic regulator expression. Genes Dev. 1998;12:290–303. doi: 10.1101/gad.12.3.290. [DOI] [PMC free article] [PubMed] [Google Scholar]
- 30.Frank NY, Kho AT, Schatton T, Murphy GF, Molloy MJ, Zhan Q, et al. Regulation of myogenic progenitor proliferation in human fetal skeletal muscle by BMP4 and its antagonist Gremlin. J. Cell Biol. 2006;175:99–110. doi: 10.1083/jcb.200511036. [DOI] [PMC free article] [PubMed] [Google Scholar]
Associated Data
This section collects any data citations, data availability statements, or supplementary materials included in this article.