Abstract
Background
Sodium nitroprusside (SNP) is used to decrease arterial blood pressure (BP) during certain surgical procedures. There are limited data regarding efficacy of BP control with SNP. There are no data on patient and clinician factors that affect BP control. We evaluated the dose-response relationship of SNP in infants and children undergoing major surgery and performed a quantitative assessment of BP control.
Methods
One hundred fifty-three subjects at 7 sites received a blinded infusion followed by open-label SNP during operative procedures requiring controlled hypotension. SNP was administered by continuous infusion and titrated to maintain BP control (mean arterial BP [MAP] within ±10% of clinician-defined target). BP was recorded using an arterial catheter. Statistical Process Control methodology was used to quantify BP control. A multivariable model assessed the effects of patient and procedural factors.
Results
BP was controlled an average 45.4% (SD 23.9%, 95% CI 41.5%-49.18%) of the time. Larger changes in infusion rate were associated with worse BP control (7.99% less control for 1 mcg•kg−•min− increase in average titration size, p=0.0009). A larger difference between a patient's baseline and target MAP predicted worse BP control (0.93% worse control per 1 mmHg increase in MAP difference, p=0.0013). Both effects persisted in multivariable models.
Conclusions
: SNP was effective in reducing BP. However, BP was within the target range less than half of the time. No clinician or patient factors were predictive of BP control, although two inverse relationships were identified. These relationships require additional study and may be best coupled with exposure-response modeling to propose improved dosing strategies when using SNP for controlled hypotension in the pediatric population.
Introduction
Deliberate hypotension is used during general anesthesia in a subset of patients undergoing orthopedic, neurosurgical, craniofacial, cardiovascular, and otolaryngologic surgeries. During deliberate hypotension, systemic arterial blood pressure (BP) is decreased in a stepwise manner. Lower BPs lead to reduced blood loss, decrease the need for blood transfusion, and improve visibility in the surgical field.1-3 Deliberate hypotension may be achieved using a variety of agents including anesthetic gases, beta-blockers, calcium-channel blockers, or vasodilatory drugs.4-6
Sodium nitroprusside (SNP) is a direct-acting vasodilator commonly used for reduction of BP. SNP metabolism in the red blood cell results in the release of nitric oxide. Nitric oxide in turn activates guanylyl cyclase, leading to increased intracellular levels of cyclic guanosine monophosphate that causes vascular smooth muscle relaxation.7 Hypotensive effects of SNP are achieved within 30 seconds. The duration of the effect is 1-10 minutes. In comparison to other BP-decreasing drugs, SNP has both faster onset and offset of effect.8,9 These properties allow for rapid adjustment of drug dosing in response to BP changes from various clinical factors. Neither hepatic nor renal dysfunction are contraindications for SNP use. Concerns about cyanide toxicity and resultant metabolic acidosis arise with prolonged use, and this issue was directly assessed in other analyses of the present data.
The Sodium Nitroprusside in Pediatrics (SNIP) trial was a phase II, multicenter, randomized controlled trial executed under the sponsorship of the National Institute of Child Health and Human Development and performed under the auspices of the Best Pharmaceuticals for Children Act (BPCA). It consisted of a parallel group, dose ranging, effect-controlled study, followed by an open-label dose titration of an IV SNP infusion in 203 pediatric subjects requiring deliberate hypotension or controlled normotension for an anticipated duration of at least 2 hours. Subjects were randomized to receive 1 of 4 blinded SNP doses. The blinded phase was mandated by the Food and Drug Administration's written request to obtain kinetic – pharmacodynamic data for labeling of SNP in neonates and children; these results will be reported elsewhere. After 30 minutes of blinded infusion, subjects were switched to open-label SNP. During this open-treatment phase, SNP was titrated to achieve a target mean arterial BP (MAP).
A secondary analysis of dose-response data from the open treatment phase was performed, using aspects of Statistical Process Control (SPC) theory to assess the degree of BP control. SPC uses control charts to track the accuracy of an intervention. These charts demonstrate changes in efficiency and accuracy of processes over time.10,11 In this analysis, we plotted control of BP in each patient over elapsed time of drug infusion. We used SPC-derived information to explore the technique of deliberate hypotension and the impact of clinicians’ dosing practices on hemodynamic outcomes.
No trial to date has systematically examined the effectiveness of deliberate hypotension or factors that alter its effectiveness. Using SPC, we explored patient and clinician factors that influence the effectiveness of a long-standing clinical practice and a quantitative measure of the control that clinicians achieve using SNP. This is the first comparative effectiveness study to examine both patient and clinician factors that impact BP control during deliberate hypotension in children.
Methods
IRB approval was obtained at each participating site. Written parental informed consent, and subject assent when applicable, were obtained for all participants. Subjects were male and female patients, from birth through 16 years of age, who required intraoperative deliberate hypotension for at least 2 hours. Enrollment was stratified into 5 age groups: neonates (< 30 days of age), infants and toddlers (30 days to < 2 years of age), preschool children (2 to < 6 years of age), school-age (6 years of age to < Tanner Stage III), and adolescents (Tanner Stage III through 16 years of age). Two hundred-three subjects completed the study at 10 sites. Not all subjects completed a 90-minute Open Treatment Phase as planned in the protocol. A short Open Treatment Phase would limit the detectable hemodynamic variations. Therefore, data were limited to subjects with ≥60 minutes of Open Treatment Phase data. For this analysis, we anticipated that clinical practices vary by site. In order to have adequate numbers of subjects at each site, we omitted data from sites with ≤8 subjects each. Although enrollment was stratified by age groups, age was treated as a continuous variable in this analysis. This yielded 153 evaluable cases across 7 sites, with the youngest patient being 3 months of age.
Before enrolling patients in the study, clinicians from all participating sites were brought to the coordinating center; an anesthesia simulator was used to teach principal investigators and study coordinators how to perform study-related procedures. All patients received a 10 mL/kg bolus of isotonic crystalloid infusion to normalize for potential hypovolemia before surgery, per the protocol. After the bolus infusion was completed, a baseline MAP was measured, defined as the MAP taken just before initiation of the blinded phase but after at least 5 minutes of stable anesthesia (no dosage changes). Subjects’ clinicians then designated a target MAP for each patient based on clinical need, but not less than 50 mmHg. The target MAP could be adjusted, if clinically indicated, throughout SNP administration. This allowed for flexibility in clinical management should the patient's condition change. SNP infusion during the blinded phase was titrated up to the total blinded dose over 10 minutes (5 minutes each at 1/3 and 2/3 the total dose). Open-label infusion of SNP began at ≤ 0.3 mcg•kg−•min−. Clinicians titrated the infusion rate to maintain a MAP within ±10% of target MAP. The frequency and magnitude of dose adjustments were at the discretion of the clinician. Subjects did not receive any other antihypertensive drugs (beta-blockers, calcium-channel blockers, etc.). SNP was administered through a continuous infusion pump; all sites used protocol-defined pumps and tubing. MAP was measured via an indwelling arterial catheter. Vital signs were assessed every 2 minutes for 10 minutes at the start of the Open Treatment Phase and after any dosing change, and then every 5 minutes thereafter. A standardized anesthetic technique was described in the protocol. Briefly, induction could be with sevoflurane or halothane + nitrous oxide, propofol, or thiopental. Anesthesia could be maintained with sevoflurane, isoflurane, halothane, or propofol infusion. Analgesia could be provided with fentanyl or remifentanil. Neuromuscular blockade could be achieved with rocuronium or vecuronium. A variety drugs were permitted in order to provide clinicians latitude in providing appropriate anesthesia. Blood loss was replaced 3:1 with isotonic crystalloid or 1:1 with colloid solution. Normothermia was maintained per institutional practice.
All data were collected on electronic Case Report Forms. Patient characteristics (age, gender, race), physical examination, and medical history were documented at study enrollment. The procedure and indication were recorded. SNP infusion rates were recorded throughout each case. All procedures and medications given before or concomitant to SNP administration were recorded with their indication, dose, and time.
External contracted research personnel reviewed and compared Case Report Form data to source documents; these were required to be 100% consistent. Data underwent regular quality review by an independent data safety and monitoring board. During statistical analysis, points were inspected for possible errors if they had weighted residuals >5 or < -5. Outliers were reviewed on an individual basis and were either corrected, left unchanged, or excluded from the analysis. Missing continuous covariates were replaced by the median value for the rest of the population (stratified by age category). Missing categorical covariates were replaced with the most probable category in this population. If >20% of the covariate was missing, that covariate was omitted from the analysis.
Raw BP data were reviewed to exclude physiologically implausible or missing data. The following a priori criteria were used:
Pulse pressure (systolic minus diastolic) < 15 mmHg
MAP >130
Absent systolic or diastolic data
Clinical investigators participated in the data review. Entries without systolic or diastolic data were removed. Thereafter, each remaining entry was retained or omitted based on unanimous consensus; of ~2,000 entries that met the above screening criteria, 10 were omitted due to clinical implausibility.
Statistical methods
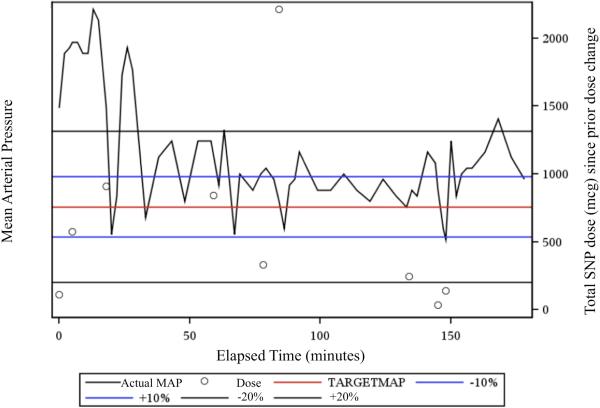
SPC procedures and charts were generated using SAS 9.2 (Cary, NC). Calculations, analyses, and figures were generated using SAS 9.2 / Enterprise Guide 4.2 (Cary, NC). Power calculations were generated using SAS 9.2 and PASS 2008 (Kaysville, UT).12 All tests assumed a significance level α=0.05. Values are reported as mean ± SD unless otherwise noted. Control charts were generated for the Open Treatment Phase data of each subject (Figure 1). A priori clinical criteria for BP control of ±10% of target MAP were defined in the study protocol. Each chart plots actual MAP over time relative to the target MAP and control boundaries of ±10% of target MAP. The chart accounts for changes in the clinician-determined target MAP during a case. Additionally, infusion rate changes were indicated at their corresponding times, with the total nonweight-adjusted dose of SNP administered since the previous dose change. The cumulative time within the MAP boundaries for each subject was calculated by summation of time within consecutive observations. BP control was defined as the percentage of time spent within a MAP boundary. Control was calculated for both ±10% of the target MAP in each patient.
Figure 1.
shows a representative Statistical Process Control (SPC) control chart. Control charts were generated for each subject in the study. Elapsed time in minutes is shown on the X-axis. The left Y-axis indicates the target mean arterial blood pressure (MAP) (in red), ±10 boundaries (in blue), and ±20% boundaries (in black). The actual MAP (black) is plotted over time. Note that all values on the x-axis are relative to the target MAP. The boundaries at any given time are plus-or-minus 10% and 20% of the target MAP at that time. The right Y-axis shows non-weight-adjusted sodium nitroprusside (SNP) dose. Black circles indicate changes in infusion rate; the y-axis value is the cumulative dose administered since the previous dose change.
Model-based analysis
Control within ±10 of target MAP was selected as the primary outcome. To explore clinician dosing practices, 2 main predictors were selected: the frequency and the magnitude of dose adjustments in each patient. Frequency was calculated as the number of dose adjustments for a given patient divided by the elapsed time. The magnitude of dose adjustments is a measure of the average size of titrations. Doses were reported as mcg•kg−•min−1. Average titration size was calculated as the sum of the absolute value of the mcg•kg−•min− change of each dose adjustment, divided by the number of dose adjustments (Σ Δ|DoseChange|)/# DoseChanges).
To examine the effects of dosing practices on BP control, variables with a clinically plausible effect on hemodynamic control were considered. Procedures were categorized into 3 types: 1) cerebral catheterization – i.e., coil embolectomy of cerebral arteriovenous malformations, 2) craniofacial surgeries, and 3) spinal fusion. Because it was assumed that large changes in patients’ fluid volume would affect BP control, blood loss measurements were corrected for patients’ estimated blood volume. Blood loss was defined as a percent of estimated blood volume.13 Blood loss was estimated based on volume of blood in suction canisters, sponge weights, and blood on drapes.
Consideration was given for interactions between factors such as clustering of procedures within certain sites as well as the propensity for age to be correlated with certain procedures. Summary and frequency tables were generated for all variables, as well as histograms and bar charts as appropriate. Correlations between all variables were assessed using the Pearson Product-Moment Correlation; correlations were tested relative to 0. Any correlations that were statistically significant were reviewed to determine clinical importance.
Linear regressions of control versus each predictor were performed using the ROBUST REG procedure in SAS. The outlier cut-off was set at twice the corrected median residual. The leverage cut-off was set at twice the robust distance that defines leverage. This limited the effect of outliers and leverage points to provide more accurate regression estimates.14 These preliminary results were compared to the subsequent multivariable statistical model, to see if any predictors remained significant after accounting for all others.
Subjects were not equally distributed among different procedure types. To account for the unequal distributions, least squares means were calculated for the types of procedures. In addition, systematic differences between individual procedures were assessed using ANOVA with Scheffe's test to perform pairwise comparisons among all 3 procedures. Similarly, Scheffe's test was used to explore differences in dosing practices between procedures. A mixed effect model was used to determine the relationship between BP control and our predictors using the SAS PROC/MIXED procedure.14 Site, surgery type, site-by-age, site-by-titration magnitude, and site-by-titration frequency were included as random effects. Normality was assessed using residual plots. Power was calculated post hoc, given the known sample size of 153. All calculations assume a significance level of 0.05. The full model had 80% power to detect an R-squared of ~0.22.
Results
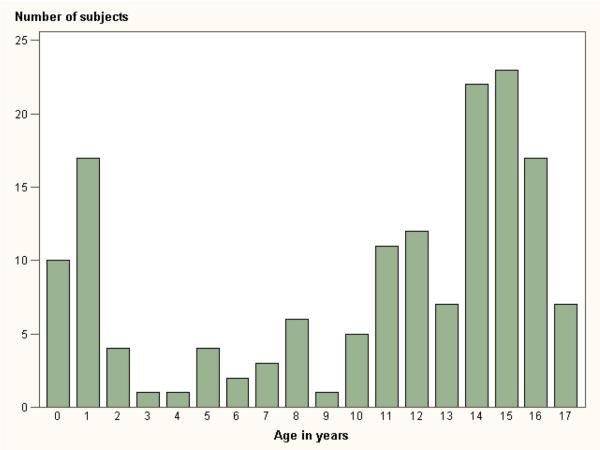
Table 1 shows summary data for age and weight. Subjects ranged in age from 3 months to just under 17 years of age (10.4±5.7 years). Sixty-six percent of subjects were female, while 34% were male. Age distribution is shown in Figure 2.
Table 1.
Demographic data
| Variable | ||
|---|---|---|
| Age (in years) | 10.38 ± 5.66 years | Range: 87 days – 16y11m |
| Weight (in kg) | 39.12 ± 23.38 kg | Range: 5.30-112.20 |
| Sex | 66% Female 34% Male |
Demographic data for the 153 subjects included in this analysis.
Figure 2.
shows the distribution of subjects by year of age.
Tachycardia is an adverse effect encountered with the use of SNP. Tachycardia as an adverse event was defined as heart rate ≥180 bpm for children <6 months, ≥160 bpm in children 6 months to <3 years, 150 bpm in children 3 years to <8 years, and ≥130 bpm in children 8 years or older. It occurred overall in 7.9% of all study participants. There was no correlation with age or blinded dose group.
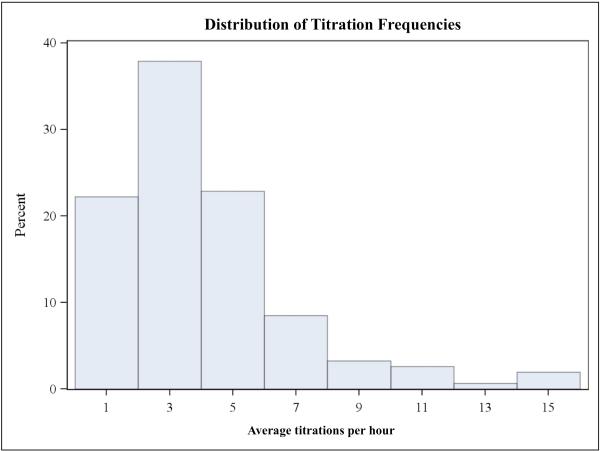
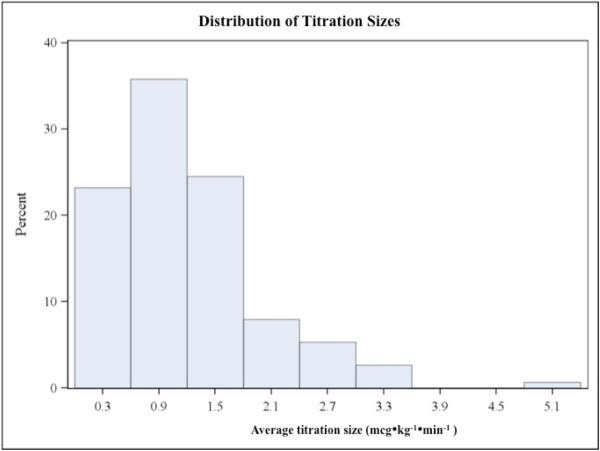
Dosing practices varied greatly as shown in Figures 3a and 3b, although frequent and large dose changes were comparatively rare. The average number of dose adjustments per patient was 4 per hour (3.99±2.90), but ranged from zero to nearly 16 adjustments per hour. The average titration was 1.21±0.78 mcg•kg−•min−, ranging from 0.19 mcg•kg−•min− up to 5.33 mcg•kg−•min−. Mean blood loss was 27% of total estimated blood volume, but there was a large standard deviation of 32%. MAP reduction from baseline averaged 19.2±6.5 mmHg, ranging from 1.33-48.3 mmHg.
Figures 3a and 3b.
are histograms showing the distributions of average titration frequency (3a) and average titration size (3b). Bar height represents percent of total subjects (N=153). Note that both distributions are skewed to the right; large and frequent dose adjustments were rare.
Patient BP was in control (i.e., within ±10 of target MAP) an average of 45.4% of the time (SD 23.9%, 95% CI 41.5%-49.18%). Control varied from 0.9% to >98% across the group, with a standard deviation of 23.9%. The distribution of subjects’ time within ±10 MAP was broad and did not fit a normal curve. Nevertheless, the data are a full range of outcomes that cluster near the mean.
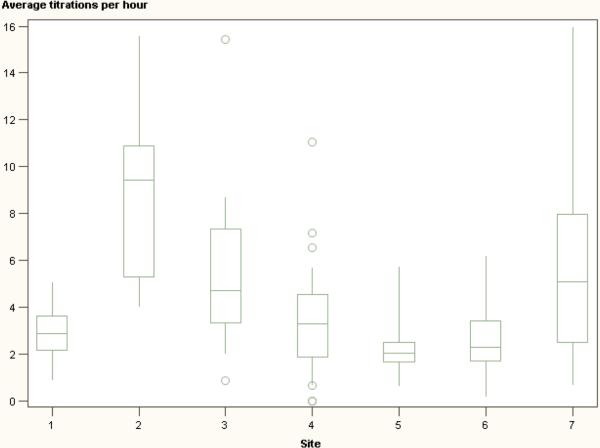
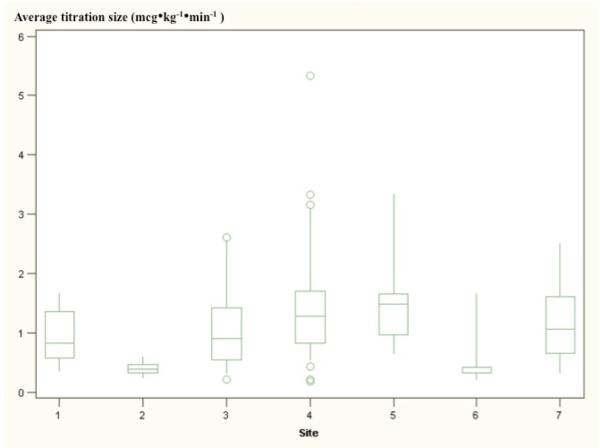
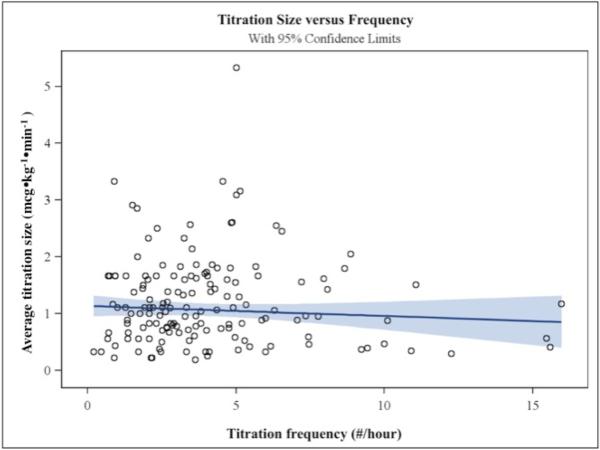
There were no significant correlations among any of the variables, as assessed by the Pearson Product-Moment method. Figures 4a and 4b show box and whisker plots of titration frequency (Fig 4a) and titration size (Fig 4b) at each of the clinical sites. Average BP control differed among sites and types of procedures. Table 2 shows the mean of BP control for each research site and class of procedure. There was a more than 2-fold difference between the sites with highest and lowest average control (68.9% versus 32.3%). Cerebral catheterizations had much lower average control than spinal and craniofacial procedures (22.2%, versus 49.1% for spinal cases and 41.5% for craniofacial cases). There were no apparent relationships among variables within research sites. Specifically, the frequency of dose titrations did not appear to correlate with the size of dose titrations at a given site. A relationship between titration frequency and size was not evident based on linear regression analysis (p=0.275) (Figure 5).
Figures 4a and 4b.
are box-and-whisker plots of clinical practices at each study site. Sites are noted on the x-axis; the axis reflects the average titration frequencies and titration sizes (4a and 4b, respectively) for each subject. Whiskers extend to ±1.5 times the interquartile range. Circles indicate extreme values. Differences in titration techniques between sites are evident, as well as differences within sites, as indicated by wide distributions of data.
Table 2.
Arterial blood pressure control by research site and by procedure.
| Control percent of time spent in within ±10% of target MAP | Mean | Std Dev | Min | Max | N |
|---|---|---|---|---|---|
| Craniofacial | 41.52 | 24.21 | 1.13 | 88.93 | 58 |
| Catheterization | 22.23 | 16.52 | 7.22 | 50.13 | 5 |
| Spinal | 49.12 | 23.14 | 0.90 | 98.64 | 90 |
| Site 1 | 39.79 | 20.11 | 2.33 | 64.08 | 11 |
| Site 2 | 32.32 | 22.88 | 3.64 | 75.86 | 9 |
| Site 3 | 49.59 | 22.99 | 0.90 | 83.30 | 21 |
| Site 4 | 36.78 | 23.47 | 1.13 | 88.93 | 68 |
| Site 5 | 58.71 | 17.65 | 33.59 | 98.64 | 18 |
| Site 6 | 68.94 | 18.61 | 38.75 | 90.19 | 9 |
| Site 7 | 58.34 | 17.44 | 21.74 | 89.08 | 17 |
Mean, standard deviation, and range of blood pressure control (as a percentage of total time) are shown for each of the 3 types of procedures, and each of the 7 sites.
MAP = mean arterial blood pressure
Figure 5.
is a scatterplot showing the relationship between titration size (in mcg•kg−•min−, on the y-axis) and titration frequency (in titrations/hour, on the x-axis). A regression line (slope=-0.0165) is drawn in dark blue, with light blue indicating 95% confidence intervals. There was no significant relationship between titration size and frequency (p=0.275). The SAS PROC/ROBUSTREG regression provides a more accurate estimate for the slope when there are prominent outliers and leverage points, as occurs in these data.
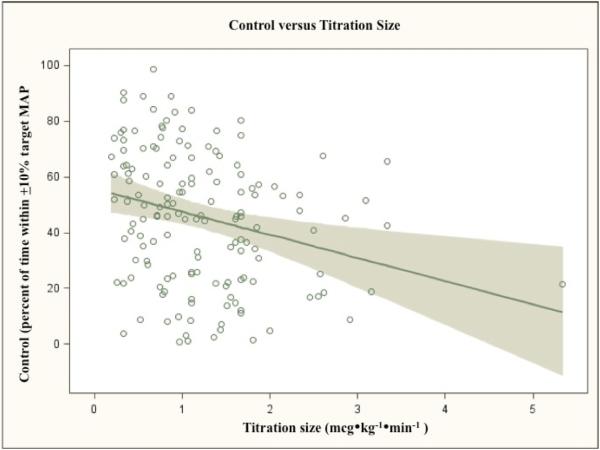
There was no obvious relationship between control and the frequency of SNP titrations, patient age, or blood loss. None of these regressions met statistical significance (p-values of 0.18, 0.34, and 0.47, respectively). Increasing size of titrations did correlate with worsening control (p=0.0009) (Figure 6). In addition, the magnitude of the relationship was large; control would be expected to decrease ~8 percentage points with a 1 mcg•kg−•min− increase in average dose change. However, the actual predictive capacity of titration size was small (R2=0.062). Similarly, a larger decrease in BP from baseline predicted worse control (0.93% decrease in control per 1 mmHg increase in MAP difference, p=0.0013) but with little predictive capacity (R2=0.065).
Figure 6.
is a scatterplot showing the relationship between titration size (in mcg•kg−•min−, on the x-axis) and arterial blood pressure (BP) control (% of time within ±10 of target mean BP (MAP), on the x-axis). The regression was generated with the SAS PROC/ROBUSTREG procedure to account for leverage points. There was a significant effect of titration size on BP control – a 1 mcg•kg−•min− increase in average titration size predicts an 8% decrease in BP control (slope=-7.99, 95% CI -12.72 to -3.26, p=0.0009). However, for any given average titration size, control varied greatly; titration size accounts for only a small portion of the variability in control (R-squared = 0.06).
There was no significant difference in control between spinal and craniofacial procedures, or between catheterization and craniofacial procedures. There may have been a statistically significant difference in the mean control between catheterizations and spinal surgeries (estimated difference in mean control 26.89%, CI 0.30% to 53.48%); the wide confidence interval makes drawing a true conclusion difficult. Procedures differed with respect to dosing practice. Table 3 shows the difference between the mean sizes of dose titrations in the 3 types of procedures, as calculated by Scheffe's test following ANOVA. The average dose titration was significantly larger for catheterizations than in other procedures.
Table 3.
Comparison of mean titration size between types of procedures, in mcg•kg-1•min-1.
| Type of Procedure | Mean | Standard Deviation |
|---|---|---|
| Catheterization | 2.35 | 1.79 |
| Craniofacial | 1.25 | 0.76 |
| Spinal | 1.12 | 0.67 |
| Procedure Comparison | Difference Between Means | 95% Confidence Limits | |
|---|---|---|---|
| Catheterization - Craniofacial | 1.09** | 0.22 | 1.96 |
| Catheterization - Spinal | 1.22** | 0.36 | 2.08 |
| Spinal - Craniofacial | −0.13 | −0.45 | 0.19 |
The 3 types of procedures were compared using ANOVA. The mean titration size in each is shown in the top half of the table. Scheffe's test was used to compare the mean titration size among catheterization, craniofacial, and spinal procedures, shown in the lower half of the table. Asterisks indicate a statistically significant difference in the 2 groups' means, p=0.0023.
No predictors reached statistical significance in the full model. Although site was included only as a random effect, a single site (site 5) had 14% better BP control than the trial-wide average (p=0.047). No other variables differed significantly between site 5 and other sites. This finding could reflect difference in prior experiences of sites with deliberate hypotension, a factor not controlled for in this analysis. The reduced model met criteria for normal data distributions based on model convergence. The only predictors to reach statistical significance were the magnitudes of dose titrations (estimate -5.66% control per mcg•kg−•min− difference in dose adjustment size, 95% CI -10.42 to -0.90, p=0.0202) and of hypotension (estimate -0.89% control per mm Hg of MAP, CI -1.43 to -0.35, p=0.0013). This was concordant with the findings from the linear regression (estimate -7.99%, p=0.0009, and -0.93%, p=0.0013, respectively).
The number of titrations per hour was not significant (p=0.42) and the estimated effect was small (0.61% decrease in control for 1 additional titration per hour). Procedure type did not have a statistically significant effect after controlling for other variables (p=0.35). Using least squares means, there was a trend towards worse control in cerebral catheterizations, but this did not reach significance relative to either spinal or craniofacial procedures (Tukey-Kramer adjusted p-values 0.47 and 0.33 respectively).
Discussion
In 153 separate operative cases across 7 clinical sites, clinicians maintained BP control an average of 45% of the time. This was the case despite continuous BP monitoring through an in-dwelling arterial line and use of a drug with extremely rapid titratability. Furthermore, the standard deviation was nearly 24%; the large range of values was present across all patient ages, degrees of blood loss and hypotension, and titration practices. An individual patient's BP might have been in control for nearly an entire surgical case, or conversely, almost never. Despite a long history of clinical use, the safety, efficacy and pharmacodynamics of SNP in children has never been explored in a large-scale clinical trial. Prior studies of SNP have primarily examined: 1) clinical outcomes secondary to BP changes, such as amount of blood loss, recovery time, etc.;3,8,9 or 2) physiologic features such as cerebral oxygenation, mixed venous oxygen saturation, or rebound tachycardia.15-18 There are no data describing how the practice of deliberate hypotension varies with respect to time spent in satisfactory BP control and the frequency and magnitude of dose titrations necessary to achieve said control. In our analysis of this large dataset, no single factor, nor a combination of factors, predicted whether a patient would have good or poor BP control.
From a physiologic standpoint, better BP control can be expected when a patient's target MAP was near their baseline since this would be more in keeping with their normal cardiovascular physiology. While we did demonstrate that the degree of hypotension had a statistically significant impact on BP control, the poor predictive ability was unexpected. The range of control was quite large regardless of patients’ MAP changes.
We explored whether there might be an interaction with age. Neither age nor degree of hypotension predicted control, but perhaps the change from baseline combined with age of the patient was significant. In the multivariable model, we still found no effect of an agehypotension interaction (p=0.78). These findings may simply reflect that children demonstrate autoregulation, i.e., the human body's inherent robustness to a wide range of physiologic states, such that even large changes in MAP from baseline have only a small effect on the ability to control BP.
The size of dose titrations did have a clinically significant effect. This was apparent in a linear regression, and persisted in a larger model. This finding is important in clinical practice because it validates performing a “gentler” titration. In contrast, there was no evidence that frequently adjusting the infusion rate was any different from only rarely intervening. These results suggest that an ideal titration technique for SNP could involve any number of dosage adjustments, but that each adjustment should be small. Furthermore, these findings have informed more complex hemodynamic models of MAP response to SNP dosing that incorporate classical pharmacokinetic relationships as well as developmental factors that consider age and size of the patient population.
The difference in control between catheterizations and other procedures was puzzling. Intuitively, endovascular procedures involve minimal blood loss and stimulation compared to surgeries, yet BP control was worse in catheterization cases. This effect did not reach statistical significance in the multivariable models, but the difference in mean control among the 3 procedures did reach significance. Since the average titration size was larger in these cases, it may be that the larger size of titrations during catheterizations contributed to poorer control. Alternatively, and perhaps more plausibly, the difference may reflect clinician choice. Per the study protocol, clinicians were advised to titrate SNP to achieve a MAP within ±10 of the target MAP. However, they may have acted differently in the intravascular, as opposed to open-surgical, operative setting. Clinicians may have felt that increases in BP were more permissive in a catheterization setting, as opposed to the operative setting where controlling blood loss and maintaining a clear visual field are primary goals. Depth of anesthesia and changes in anesthetic level could also contribute to these differences among types of procedure. For this reason, surgical stimulation was kept as level as possible (e.g., data collection did not occur before skin incision or after surgical closure). The standardized anesthetic technique allowed clinicians latitude to provide an even level of anesthesia throughout cases.
A key finding in the present study was the poor predictive capacity of any single factor as well as the multivariable model. Two factors were statistically significant in single and multivariable testing, which indicates that titration size and degree of hypotension do have some ability to independently predict BP control. However, these effects are only evident on a population basis. Most of the variability in BP control for an individual patient is due to unknown factors.
It remains impossible to predict accurately whether BP in a patient undergoing deliberate hypotension will easily remain within the desired window based on current understanding. It is unclear whether the variation in BP control reflects features of the drug, clinician technique, or patients. While SNP may have readily predictable effects, clinicians ultimately determine whether patients remain within a target BP window. Perhaps unique physiology in each patient predisposes to hemodynamic stability or instability. Likely, a combination of these factors dictates BP control. More mechanistic pharmacokinetics/pharmacodynamics characterization should expand knowledge of the consistency of SNP effects.
Hopefully, these findings will motivate further exploration into the clinical relevance of BP control. The results of such research could then guide additional studies, identifying the most relevant outcomes on which to base the determination of comparative effectiveness. Dosing techniques could also be improved based on these findings if BP control significantly predicts clinical outcomes. Having shown the effectiveness of deliberate hypotension with SNP in maintaining a target BP, much remains to be explored concerning the importance of BP control and clinician technique.
Acknowledgements
The authors would like to acknowledge the invaluable input of Anne Zajicek, MD, PharmD at the Eunice Kennedy Shriver National Institute of Child Health and Human Development.
Funding: NO1-HD-4-3385 (NICHD, Rockville, Maryland), TL1RR024126 (NCRR/NIH, Bethesda, Maryland)
Footnotes
The SNIP Long-Term Study Group: Children's Hospital of Los Angeles, Principal Investigator Gary Scott, MD; Children's Hospital of Philadelphia, Principal Investigator Lynne Maxwell, MD; Texas Children's Hospital, Principal Investigator Steven Sayer, MD; University of Michigan Mott Children's Hospital, Principal Investigator Shoba Malviya MD; and Children's Hospital of Pittsburgh, Principal Investigator Peter J. Davis, MD.
The authors declare no conflicts of interest.
DISCLOSURES: Name: David R Spielberg, MD MHSc
Contribution: This author contributed to data analysis and manuscript preparation.
Name: Jeffrey S Barrett, PhD
Contribution: This author contributed to study design and data analysis.
Attestation: Jeffrey S Barrett attests to the integrity of the original data and the analysis reported in this manuscript. Jeffrey S Barrett is the archival author
Name: Gregory B Hammer, MD
Contribution: This author contributed to study design and conduct of the study.
Attestation: Gregory B Hammer approved the final manuscript. Gregory B Hammer attests to the integrity of the original data and the analysis reported in this manuscript.
Name: David R Drover, MD MSc
Contribution: This author contributed to study design, conduct of the study, and manuscript preparation.
Attestation: David R Drover approved the final manuscript. David R Drover attests to the integrity of the original data and the analysis reported in this manuscript.
Name: Tammy Reece, MS
Contribution: This author contributed to conduct of the study and data collection.
Name: Carol A Cohane, RN BSN
Contribution: This author contributed to conduct of the study and data collection.
Name: Scott R Schulman, MD MHSc
Contribution: This author contributed to study design, conduct of the study, and manuscript preparation.
Attestation: Scott R Schulman approved the final manuscript. Scott R Schulman attests to the integrity of the original data and the analysis reported in this manuscript.
This manuscript was handled by: Sorin J. Brull, MD, FCARCSI (Hon)
Contributor Information
David R Spielberg, Department of Pediatrics, Duke University School of Medicine, Durham, NC. (Current affiliation: Division of Pulmonary Medicine, Cincinnati Children's Hospital Medical Center, Cincinnati, Ohio.).
Jeffrey S Barrett, Department of Pediatrics, University of Pennsylvania Medical School, Philadelphia, Pennsylvania (Current Affiliation: Interdisciplinary Pharmacometrics Program, Sanofi US, Bridgewater, New Jersey).
Gregory B Hammer, Department of Anesthesia, Stanford School of Medicine, Stanford, California..
David R Drover, Department of Anesthesia, Stanford School of Medicine, Stanford, California..
Tammy Reece, Duke Clinical Research Institute, Durham, North Carolina..
Carol A Cohane, Department of Anesthesia, Stanford School of Medicine, Stanford, California..
Scott R Schulman, Department of Pediatrics, Duke University School of Medicine, Durham, NC. (Current affiliation: Department of Anesthesia and Perioperative Care. University of California San Francisco, San Francisco, California.).
References
- 1.Larson AG. Deliberate Hypotension. Anesthesiology. 1964;25:682–706. doi: 10.1097/00000542-196409000-00018. [DOI] [PubMed] [Google Scholar]
- 2.Dutton RP. Controlled hypotension for spinal surgery. Eur Spine J. 2004;13(Suppl 1):S66–71. doi: 10.1007/s00586-004-0756-7. [DOI] [PMC free article] [PubMed] [Google Scholar]
- 3.Precious DS, Splinter W, Bosco D. Induced hypotensive anesthesia for adolescent orthognathic surgery patients. J Oral Maxillofac Surg. 1996;54:680–3. doi: 10.1016/s0278-2391(96)90679-5. discussion 3-4. [DOI] [PubMed] [Google Scholar]
- 4.Degoute CS. Controlled hypotension: a guide to drug choice. Drugs. 2007;67:1053–76. doi: 10.2165/00003495-200767070-00007. [DOI] [PubMed] [Google Scholar]
- 5.Testa LD, Tobias JD. Pharmacologic drugs for controlled hypotension. J Clin Anesth. 1995;7:326–37. doi: 10.1016/0952-8180(95)00010-f. [DOI] [PubMed] [Google Scholar]
- 6.Tobias JD. Controlled hypotension in children: a critical review of available agents. Paediatr Drugs. 2002;4:439–53. doi: 10.2165/00128072-200204070-00003. [DOI] [PubMed] [Google Scholar]
- 7.Tuzel IH. Sodium nitroprusside: a review of its clinical effectiveness as a hypotensive agent. J Clin Pharmacol. 1974;14:494–503. doi: 10.1002/j.1552-4604.1974.tb01363.x. [DOI] [PubMed] [Google Scholar]
- 8.Hersey SL, O'Dell NE, Lowe S, Rasmussen G, Tobias JD, Deshpande JK, Mencio G, Green N. Nicardipine versus nitroprusside for controlled hypotension during spinal surgery in adolescents. Anesth Analg. 1997;84:1239–44. doi: 10.1097/00000539-199706000-00012. [DOI] [PubMed] [Google Scholar]
- 9.Lustik SJ, Papadakos PJ, Jackman KV, Rubery PT, Jr., Kaplan KL, Chhibber AK. Nicardipine versus nitroprusside for deliberate hypotension during idiopathic scoliosis repair. J Clin Anesth. 2004;16:25–33. doi: 10.1016/j.jclinane.2003.05.002. [DOI] [PubMed] [Google Scholar]
- 10.Russell RRaT, Bernard W. Statistical Process Control Operations Management: Quality and Competitiveness in a Global Environment. John Wiley & Sons, Inc.; Hoboken, NJ: 2006. [Google Scholar]
- 11.Pfadt A, Wheeler DJ. Using statistical process control to make data-based clinical decisions. J Appl Behav Anal. 1995;28:349–70. doi: 10.1901/jaba.1995.28-349. [DOI] [PMC free article] [PubMed] [Google Scholar]
- 12.Hintze J. PASS 2008. NCSS, LLC.; Kaysville, UT: 2008. [Google Scholar]
- 13.Cote C. Pediatric Anesthesia. In: Miller RD, editor. Miller's Anesthesia. 7th ed. Vol. 2. Churchill Livingstone/Elsevier; Philadelphia, PA: 2010. p. v.p. xxii.p. 3084.p. I-89. [Google Scholar]
- 14.SAS Institute Inc. SAS/STAT 9.2 User's Guide. Second Edition. SAS Institute Inc.; Cary, NC: 2009. [Google Scholar]
- 15.Simsic JM, Bradley SM, Mulvihill DM. Sodium nitroprusside infusion after bidirectional superior cavopulmonary connection: preserved cerebral blood flow velocity and systemic oxygenation. J Thorac Cardiovasc Surg. 2003;126:186–90. doi: 10.1016/s0022-5223(03)00582-8. [DOI] [PubMed] [Google Scholar]
- 16.Maktabi M, Warner D, Sokoll M, Boarini D, Adolphson A, Speed T, Kassell N. Comparison of nitroprusside, nitroglycerin, and deep isoflurane anesthesia for induced hypotension. Neurosurgery. 1986;19:350–5. doi: 10.1227/00006123-198609000-00003. [DOI] [PubMed] [Google Scholar]
- 17.Yaster M, Simmons RS, Tolo VT, Pepple JM, Wetzel RC, Rogers MC. A comparison of nitroglycerin and nitroprusside for inducing hypotension in children: a double-blind study. Anesthesiology. 1986;65:175–9. doi: 10.1097/00000542-198608000-00008. [DOI] [PubMed] [Google Scholar]
- 18.Bernard JM, Passuti N, Pinaud M. Long-term hypotensive technique with nicardipine and nitroprusside during isoflurane anesthesia for spinal surgery. Anesth Analg. 1992;75:179–85. doi: 10.1213/00000539-199208000-00005. [DOI] [PubMed] [Google Scholar]


