Figure 2.
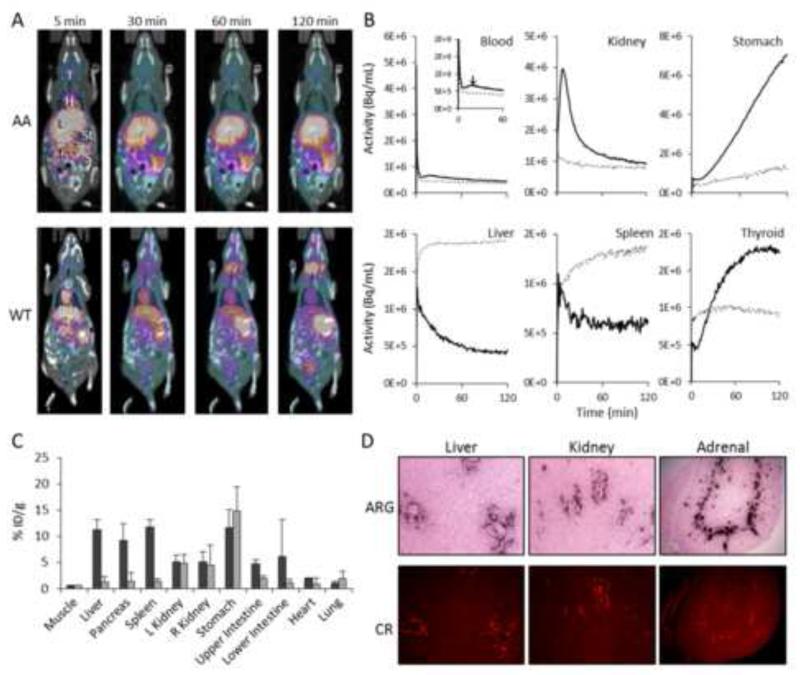
Dynamic PET imaging of 124I-p5 binding to amyloid in vivo. A) Whole body biodistribution of radioactivity by PET/CT imaging in AA and WT mice summed at 5, 30, 60 and 120 min pi, where L, liver, T, thyroid, St, stomach, S, spleen and I, intestines. Yellow and purple colors represent the presence of radioactivity. B) TAC data for the initial 120 mins post injection of 124I-p5. ROI’s were placed over tissues and the change in tissue radioactivity measured in mice with AA (dashed line) or WT (solid line: data represent mean of 3 mice). C) Tissue radioactivity measurements (%ID/g) measured at 120 min pi of 124I-p5 in AA (dark) and WT (light) mice (mean ± SD, n = 3). D) Representative tissue microdistribution of 124I-p5 at 120 min pi in microautoradiographs (ARG). Amyloid was detected by Congo red fluorescence (CR) in consecutive tissue sections.

