

Significance
Peptoid nanosheets are an emerging class of 2D nanomaterials that have the potential for use in a variety of applications ranging from molecular sensors to artificial enzymes. Because peptoids are highly designable polymers, nanosheets provide a general platform on which to display an enormous diversity of functionalities. Nanosheets are known to form through a unique monolayer compression mechanism, catalyzed by the air–water interface. Here we demonstrate that nanosheets can be formed via adsorption of peptoids at an oil–water interface. Using vibrational sum frequency spectroscopy, we show that electrostatic interactions are essential in the formation of an ordered peptoid monolayer at the interface, a critical intermediate in the nanosheet assembly pathway. These findings open the door for enhancing the complexity and functionality of 2D nanomaterials.
Keywords: peptoid assembly, vibrational sum frequency spectroscopy, liquid surfaces, biomimetic polymers, protein mimetic materials
Abstract
Peptoid nanosheets are a recently discovered class of 2D nanomaterial that form from the self-assembly of a sequence-specific peptoid polymer at an air–water interface. Nanosheet formation occurs first through the assembly of a peptoid monolayer and subsequent compression into a bilayer structure. These bilayer materials span hundreds of micrometers in lateral dimensions and have the potential to be used in a variety of applications, such as in molecular sensors, artificial membranes, and as catalysts. This paper reports that the oil–water interface provides another opportunity for growth of these unique and highly ordered peptoid sheets. The monolayers formed at this interface are found through surface spectroscopic measurements to be highly ordered and electrostatic interactions between the charged moieties, namely carboxylate and ammonium residues, of the peptoid are essential in the ability of these peptoids to form ordered nanosheets at the oil–water interface. Expanding the mechanism of peptoid nanosheet formation to the oil–water interface and understanding the crucial role of electrostatic interactions between peptoid residues in nanosheet formation is essential for increasing the complexity and functionality of these nanomaterials.
Recent advances in the design, synthesis, and characterization of 2D nanomaterials with atomic precision have given rise to ultrathin materials with unprecedented functionality (1). Specifically, organic 2D nanomaterials hold promise as biocompatible materials that can be chemically tailored and built from the bottom up, through the self-assembly of small molecule, protein, or polymer building blocks (2–5). Polymer-based 2D nanomaterials, in particular, hold promise as templates for bottom-up assembly of circuits, semiconductors, and organic–inorganic composite materials (6–8) as well as high surface area membranes for filtration, catalysis, and sensing (9, 10). Material properties, such as precisely defined porosity, metal or protein recognition sites, and other reactive groups (5, 11, 12), can be patterned directly into the polymer sequence. Peptoids are a highly designable class of polymer, recently designed to assemble into 2D peptoid nanosheets (13–15). Synthesized from a chemically diverse set of cheap, commercially available building blocks (16), peptoids have an exact monomer sequence that can direct chain folding into higher order nanostructures. Peptoid nanosheets span hundreds of micrometers in lateral dimensions, are only 3 nm thick, and are freely floating in water. The outer surfaces of the nanosheet can be readily functionalized with a controlled spatial density of binding sites (5), and the nanosheets are stable across a wide range of temperatures and pH values (14), making peptoid nanosheets a rugged, highly designable platform for bottom-up assembly of 2D nanomaterials and composite materials.
Peptoid nanosheets have previously been made through a unique assembly mechanism involving the organization of molecular units at the air–water (air–H2O) interface (15, 17). Here we report that peptoid nanosheets can also form at an oil–water interface. A key intermediate in the nanosheet assembly pathway is the formation of a peptoid monolayer. Adsorption at a 2D fluid interface preorganizes the linear peptoid chains into the orientation needed for bilayer formation, with aromatic groups preferentially displayed on the nonpolar side of the monolayer and polar groups on the aqueous side (Fig. 1). Upon compression, the monolayer buckles into a bilayer, where the nonpolar side of the monolayer becomes the interior, structural core of the nanosheet. Aromatic–aromatic interactions on the nonpolar side of the monolayer likely contribute to the nanosheet’s ordered atomic structure and stability. Importantly, the spacing between peptoid chains in the monolayer mirrors the spacing observed in the resultant nanosheet. Thus, the lateral assembly of the chains in the peptoid monolayer is crucial for dictating the structure and stability of the resultant peptoid nanosheets. Substituting oil in place of air, as the nonpolar phase, opens up opportunities to engineer the nanosheet structure and production method. For example, the oil phase could contain chemical reagents, serve to minimize evaporation of the aqueous phase, or enable microfluidic production of nanosheets.
Fig. 1.
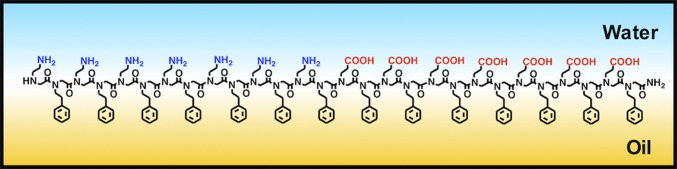
Schematic illustration of the assembly pathway for peptoid nanosheet formation at the oil–water interface.
Engineering peptoid nanosheet structure requires precise control of the monolayer intermediate. Thus, a molecular level understanding of the monolayer is required. For example, the chemical cross-linking of neighboring chains, as a means of improving nanosheet stability, requires knowledge of the chain conformation. Ultimately, a true understanding of the relationship between monomer sequence and nanosheet structure requires atomic-level structural data. To date, most of the structural data on nanosheets are from scattering and microscopy measurements (13–15), which provide excellent information on the nanoscale ordering, but little on chain conformation. The study of chain conformation and supramolecular interaction between neighboring chains in the monolayer intermediate requires surface-sensitive spectroscopic techniques. To this end, we use total internal reflection (TIR) vibrational sum frequency (VSF) spectroscopy (18) and interfacial tension measurements to study peptoid assembly at the carbon tetrachloride–aqueous (CCl4–H2O) interface. VSF spectroscopy is a well-established surface-selective technique that produces vibrational spectra of interfacial molecules (19). As with traditional vibrational spectroscopic techniques, peak center frequencies and widths of VSF spectra are sensitive to the chemical environments of the functional groups, and can thus provide details about specific intermolecular forces at play during the assembly of a monolayer. VSF spectroscopy additionally has the capability of probing molecular orientation; signal is only generated when molecules adsorb to the interface with their functional groups aligned in a net orientation relative to the plane of the interface. Based on these merits, VSF spectroscopy is an optimal technique to study the molecular-level structural and conformational details of the key peptoid monolayer intermediate.
To elucidate the role of polymer side-chains in the supramolecular assembly, we take advantage of the precision sequence control of peptoid polymers. Exact peptoid sequences can be designed and synthesized using the submonomer solid-phase method (20). The ability to synthesize an exact polymer sequence enables atomic-level control over molecular design parameters, such as polymer chain length, sequence patterning, and side-chain chemistry. Thus, peptoid polymers serve as convenient building blocks for the systematic study of structure–property relationships between molecular design and nanosheet material properties. In this work, we compare the interfacial adsorption and assembly of a previously reported (5, 14) peptoid 1 (Fig. 2A) with its carboxyl analog, peptoid 2 (Fig. 2B), wherein the amine residues of 1 have been replaced with carboxyl groups. Peptoid 1 was found to be more stable than an alternating charge structure (14). In this way, we isolate the contribution of the charged functional groups from the aromatic groups, and show that the charged functional groups play an important role in the sequence design and 2D assembly of 1.
Fig. 2.
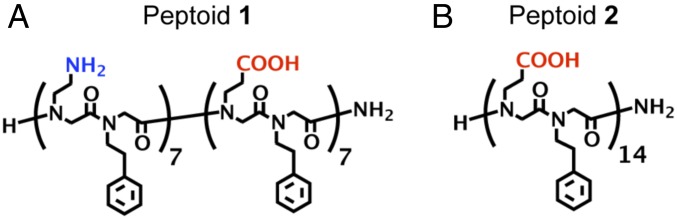
Chemical structures of (A) peptoid 1 and (B) peptoid 2 investigated in this work. Peptoid 1 formed nanosheets whereas 2 did not.
Results and Discussion
Peptoid Nanosheet Formation at the Oil–Water Interface.
To examine whether peptoid nanosheet formation can proceed via a monolayer collapse mechanism at an oil–water interface, a large number of water-immiscible organic solvents were tested as the oil phase. Vials were completely filled with a two-phase mixture of the organic solvent and an aqueous phase containing 20 μM of 1 at pH 8.0, making sure to exclude air from the vial. Vials were mounted onto a custom-made vial-rocking device used for peptoid nanosheet preparation (15) and after a fixed number of vial rocking cycles, the presence of peptoid nanosheets in the aqueous phase was evaluated by optical microscopy. Short-chain aliphatic solvents, such as pentane, hexane, and heptane, all produced nanosheets that were qualitatively comparable in size and yield to nanosheets prepared from the air–H2O interface (Fig. 3A). However, longer alkane molecules, such as hexadecane or mineral oil, did not form nanosheets. Hexadecane and mineral oil are similar to the shorter alkane solvents in terms of their immiscibility and interfacial tension with water, but have significantly higher viscosities than hexane (SI Appendix, Table S1). Thus, the lack of sheet formation observed with the longer alkanes suggests that an oil phase with high viscosity impedes nanosheet formation, possibly by preventing rapid collapse of the peptoid monolayer into a bilayer. Additionally, benzene and toluene did not yield nanosheets, likely because aromatic solvents interfere with the π–π interactions between the phenylethyl side-chains of neighboring peptoid strands, preventing the strands from packing into an ordered peptoid monolayer. Lastly, using CCl4 as the oil phase yielded peptoid nanosheets, albeit significantly smaller in size and yield than nanosheets prepared from the air–H2O or hexane–H2O interfaces (Fig. 3A). CCl4 has dielectric constant, water miscibility, and interfacial tension values very close to those of hexane (Table S1), suggesting that CCl4 is a sufficiently nonpolar solvent, capable of forming a peptoid monolayer to the same extent as hexane. However, unlike hexane, CCl4 has a strong affinity for aromatic rings (21–23). In fact, the heat of mixing for a binary mixture of benzene–CCl4 is significantly less than that of benzene–hexane (Table S1). Moreover, the affinity of CCl4 for aromatic groups is even stronger for alkyl-substituted benzene rings, such as ethylbenzene, than for benzene (24, 25). Because 1 contains 14 ethylbenzene-like residues, this peptoid is likely to have a strong attraction for the CCl4 solvent, making it difficult to desolvate the 1 monolayer from the CCl4–H2O interface during bilayer formation. A lower degree of peptoid monolayer detachment from the CCl4–H2O interface could explain the observed smaller size and yield of nanosheets prepared from the CCl4–H2O interface (Fig. 3A) relative to the air–H2O and hexane–H2O interfaces.
Fig. 3.

Characterization of 1 nanosheets formed from air–H2O and oil–water interfaces. (A) Fluorescence microscopy images of Nile-red-stained nanosheets deposited on agarose gel. (B) AFM image of the edge of an individual peptoid nanosheet, deposited on a mica substrate and imaged in ambient air. (C) Powder XRD spectra of a dry, pelleted stack of nanosheets formed from the air–H2O, hexane–H2O, and CCl4–H2O interfaces. Spectra are normalized by the intensity of the 4.6-Å peak. The three equally spaced peaks (denoted by blue arrow) arise from the 2.8-nm thickness of the 1 nanosheet.
To characterize the atomic structure of nanosheets produced from the oil–H2O interface, we performed atomic force microscopy (AFM) and powder X-ray diffraction (XRD). AFM analysis of individual peptoid nanosheets revealed that nanosheets made from hexane–H2O exhibit the same 3.0 ± 0.3-nm thickness as nanosheets made from air–H2O, and exhibit a thickness that is consistent with a 2-molecule-thick bilayer (Fig. 3B). Powder XRD data obtained from dry, pelleted stacks of nanosheets made from either hexane–, CCl4–, or air–H2O interfaces confirmed that nanosheets prepared with organic solvents possess the same degree of structural order as nanosheets made from the air–H2O interface. The diffraction pattern of all nanosheets exhibited a characteristic 4.6-Å peak, attributed to interbackbone spacing between polymer chains, as well as a 2.8-nm peak arising from the thickness of the peptoid bilayer (Fig. 3C). Thus, the XRD results obtained with hexane and CCl4 are consistent with all previously reported peptoid nanosheets (5, 13–15), which were assembled through the air–H2O interface.
Ordering of Peptoid Monolayers at the Oil–Water Interface.
To determine when a full peptoid monolayer is achieved at the CCl4–H2O interface, surface pressure data were obtained for 1 as a function of bulk aqueous peptoid concentration (Fig. 4). Adsorption to the CCl4–H2O interface begins at an extremely low bulk peptoid concentration of 0.02 µM (∼4 mN/m). The amount of adsorbed peptoid continues to increase with concentration until ∼1 µM (36 mN/m), at which point an increase in concentration does not result in a significant change in surface pressure. This surface pressure value is the same as that obtained for 1 (20 μM) at the hexane–H2O interface (Table S1). At 1 µM, a full peptoid monolayer is achieved at the CCl4–H2O interface. Adsorption of peptoid to the air–H2O interface begins at 1 µM (5 mN/m), with a full monolayer achieved at >20 µM (33 mN/m). Both the lower concentration of initial peptoid adsorption and higher surface pressure value of the full peptoid monolayer observed at the CCl4–H2O interface, compared with the air-H2O interface, further corroborate the existence of attractive interactions between the phenylethyl groups of the peptoid and the CCl4 solvent.
Fig. 4.

Interfacial pressure of 1 at the air–H2O interface (red circles) and at the CCl4–H2O interface (black circles) as a function of peptoid concentration (in 10 mM Tris buffer, pH 8.0).
VSF spectra of 1 and 2 at 20 µM were obtained at the CCl4–H2O interface (Fig. 5) after allowing the peptoid monolayer to equilibrate for ∼1 h. At this concentration, a full peptoid monolayer of 1 is achieved. Because VSF spectroscopy only gives signal from molecular modes with an average net orientation relative to the plane of the interface, the peaks that appear in the spectra in Fig. 5 indicate that the peptoid functional groups are ordered at the interface. More specifically, the polarization scheme of the incident and detected beams (s-sum frequency, s-visible, p-infrared) used in these studies demonstrates that the peptoid functional groups have an average net orientation normal to the plane of the interface. In the CH–OH stretching region for 1 (Fig. 5A), the peak near 2,580 cm−1 is assigned to the carboxylic acid OH stretching mode (26). Although most of the polar residues of 1 are expected to be charged at pH 8.0, some of the carboxyl groups are still protonated, as seen by the small-intensity carbonyl stretching mode peak near 1,760 cm−1 (Fig. 5A, Inset). The peaks that appear from 2,800 to 3,000 cm−1 are assigned to alkyl CH2 stretching modes of the methylene groups in the peptoid backbone and side-chains (27), whereas the peaks at 3,000–3,100 cm−1 are assigned to the aromatic CH stretching modes of the phenyl functional groups (27). The broad peaks that appear from 3,100 to 3,600 cm−1 are assigned to the coordinated water OH stretching modes (28). The NH3+ stretching mode is also known to appear in the 3,100–3,600-cm−1 region, but was difficult to distinguish from the relatively strong water signal (27).
Fig. 5.

VSF spectra (ssp) of (A) the CH–OH stretching region of 1 (amide–carbonyl region, Inset), (B) the CH–OH stretching region of 2 (amide–carbonyl region, Inset), and (C) the carboxylate stretching region of 1 (black circles) and 2 (gray squares). All spectra were collected using a 20-μM peptoid concentration in pH 8.0, 10 mM Tris buffer. The solid lines are fits to the data.
The VSF spectrum of the 20-μM peptoid 1 monolayer reveals that 1 adsorbs at the CCl4–H2O interface into an equilibrated film that completely covers the water surface. This is demonstrated by the lack of a free-OH oscillator peak near 3,670 cm−1, indicating that water molecules in the topmost interfacial layer are not present (29). There is also strong evidence from the VSF spectrum that the interfacial peptoid layer is highly ordered. This can be observed from the strong intensity of the aromatic CH stretching mode peak that appears near 3,066 cm−1, indicating that the phenyl groups have a strong net orientation normal to the plane of the interface. The methylene groups also show a degree of ordering, but not due to a fully extended backbone conformation as depicted in Fig. 1. Because a net orientation of functional groups is required for generating VSF signal, the orientation depicted in Fig. 1, in which all of the methylene groups pointing into the oil phase have the exact opposite orientation as those pointing into the water phase, would cause cancellation of any signal in the region from 2,800 to 3,000 cm−1.
The lack of a fully extended peptoid backbone conformation is confirmed by the spectrum taken in the amide I–carbonyl region of 1 (Fig. 5A, Inset). Here, the sharp peak that appears near 1,665 cm−1 is assigned to the amide I stretching mode (27) and is indicative that the amide groups along the peptoid backbone have a net orientation normal to the plane of the interface. The peptoid backbone therefore must not be in a fully extended conformation at the interface, but contain some intrachain disorder such that peaks due to the methylene and amide groups appear in the spectra. This conformational freedom of the interfacial peptoids is not surprising, because peptoid backbones are known to be flexible (30). Additionally, the CCl4–H2O interface provides a fluid environment in which side-chains can interact with both the oil and the water phases, causing molecular assembly to be more flexible than in the dry state (powder XRD pellet) or at the air–H2O interface (31).
Interfacial peptoid ordering can also be observed in the carboxylate stretching region of 1 (Fig. 5C). The strong intensity of the peak near 1,405 cm−1 indicates that the carboxylate groups are also highly oriented normal to the plane of the interface. An additional peak appears in the spectrum near 1,360 cm−1, which is assigned to carboxylate groups in a stronger water hydrogen bonding environment than those that correspond to the 1,405-cm−1 peak (31). A third peak appears in the spectrum of 1 near 1,440 cm−1. Similar carboxylate peak frequencies have been observed in VSF spectroscopic studies of carboxylate–metal ion complexes, which were attributed to the disruption of carboxylate solvation shells due to the closeness of the cations (32, 33). FTIR studies of simple carboxylic acids have additionally shown that the frequency of the peak attributed to the COO− antisymmetric stretch of a carboxylate–amine complex (34) is blue-shifted by ∼40 cm−1 relative to that of a fully water-solvated carboxylate group (35). The peak that appears near 1,440 cm−1 is therefore assigned to a direct ionic interaction between the negatively charged carboxylate groups and the positively charged amine groups. This direct interaction acts to disrupt the water solvation shell of the carboxylate groups, causing the peak frequency to shift to higher wavenumbers due to a lack of hydrogen bonding from water molecules.
To confirm the assignment of the peak near 1,440 cm−1, the VSF spectrum of 1 (Fig. 5C) was compared with that of 2, which lacks the ability to form attractive electrostatic interactions. It is clear from the spectrum of 2 that only a single peak appears near 1,400 cm−1. This peak is slightly red-shifted relative to the peak of 1, indicating a greater degree of water hydrogen bonding of the carboxylate groups of 2 compared with 1. Additionally, the presence of the peak near 1,440 cm−1 for 1 and the lack of this peak for 2 confirms that a direct ionic interaction exists between some of the negatively charged carboxylate groups and some of the positively charged amine groups in the 1 monolayer.
The lack of cationic groups in sequence 2 strongly affects the spectrum in the CH–OH stretching region (Fig. 5B). Compared with the spectrum for 1 (Fig. 5A), the amplitudes of the peaks assigned to the coordinated water OH stretching modes are much larger for 2 than for 1. This is attributed to a difference in the charge of the peptoid monolayers at the oil–water interface. As with 1, there is minimal protonation of the carboxylic acid groups of 2 at pH 8.0, as evidenced by the small carbonyl peak near 1,730 cm−1 (Fig. 5B, Inset). Because 2 contains mostly negatively charged carboxylate groups, the lack of positively charged amines to counterbalance the net charge of the carboxylates creates an electric field at the interface of 2 that acts to orient the dipoles of water molecules near the interface to a greater extent than those near the interface of 1. The alkyl CH2 stretches are also quite different between the two peptoids (Fig. 5 A and B). The widths of the peaks due to the CH2 stretching modes for 2 are overall broader compared with those for 1. This indicates that the backbone and/or side-chain conformations are different between the two different peptoid monolayers, with 2 exhibiting a wider range of methylene groups in different chemical environments than 1. These differences in the surface structure of 1 and 2 are also supported by interfacial pressure measurements collected with 20-µM peptoid at the CCl4–H2O interface. The 1 monolayer exhibited a higher interfacial pressure (36 mN/m) than that of 2 (24 mN/m), indicating that a greater degree of adsorption and packing at the interface is achieved by 1 compared with 2. We attribute the lower packing density of 2 to charge–charge repulsions that exist between neighboring charged carboxylate groups at the interface. These repulsive interactions may also increase the heterogeneity around the methylene groups of 2 such that broader peaks attributed to the CH2 stretching modes are seen in the spectrum of 2 compared with those seen in the spectrum of 1. It is likely that these repulsive interactions inhibit the ability of 2 to form nanosheets via the interface by preventing the proper packing and alignment of the peptoid monolayer. Conversely, the attractive electrostatic interactions present in the monolayer of 1 likely allow nanosheet formation by promoting tightly packed and aligned peptoids at the interface. These different interactions are depicted in Fig. 6. Such a dependence on electrostatic interactions in monolayer formation implies the potential for salts to greatly affect peptoid assembly at the interface.
Fig. 6.
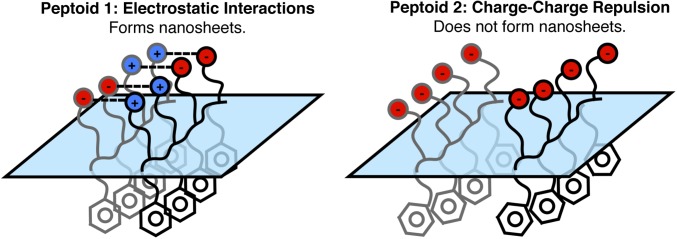
Cartoon depicting the attractive interactions in monolayers of 1 (Left) and the repulsive interactions in monolayers of 2 (Right).
As the degree of peptoid packing appears to play a large role in the conformation of the peptoid within the interfacial monolayer, spectra of 1 were obtained as a function of bulk peptoid concentration (Fig. 7). From a bulk peptoid concentration of 0.02–0.06 µM, increases in amplitude from the peptoid alkyl and aromatic CH peaks are seen (Fig. 7A, Inset). The increase in surface pressure over this concentration range from ∼4 mN/m to ∼27 mN/m indicates an increase in the number of interfacial peptoid molecules. By a concentration of 0.06 µM, the free-OH peak near 3,670 cm−1 has disappeared, indicating full coverage of the interface by the peptoid. This concentration also shows a drastic increase in amplitude of the peak near 1,400 cm−1 due to a large increase in the number of oriented carboxylate groups at the interface (Fig. 7B).
Fig. 7.

VSF spectra (ssp) of 1 as a function of peptoid concentration (in 10 mM Tris buffer, pH 8.0). (A) The CH–OH stretching region. (B) The carboxylate stretching region. The solid lines are fits to the data.
The carboxylate–amine charge complex peak near 1,440 cm−1 does not appear until a peptoid concentration of 0.1 µM (∼31 mN/m). The amplitude of this peak and the water-solvated carboxylate peak near 1,405 cm−1 continue to grow until a concentration of 10 µM (∼36 mN/m). These data overlay almost perfectly with those at 20 µM. The shift in frequency of the solvated carboxylate peak from ∼1,400 to ∼1,405 cm−1 shows a decrease in the degree of hydrogen bonding from water as the monolayer packing density increases. Over this concentration range in the CH–OH stretching region, there is also a continual increase in amplitude of the aromatic CH stretch peak near 3,066 cm−1. Additionally there is a narrowing of the alkyl CH2 stretch peak near 2,940 cm−1, indicating a decrease in the number of methylene chemical environments as more peptoids pack at the interface. These combined spectral changes are consistent with an increase in monolayer packing and subsequent ordering of the peptoid backbone, side-chains, and functional groups.
Note that the data at 0.06 µM for 1 are similar to the data for 2 at 20 µM. For both peptoid monolayers, the spectra show strong signal from the water, broad methylene peaks, and only one peak in the carboxylate stretching region. This carboxylate peak is red-shifted 5 cm−1 relative to the carboxylate–amine charge complex peak. The lack of a charge complex in the spectra of 2 is attributed to its lack of amine groups. No complex is observed with 1 at 0.06 µM because a full monolayer has not been attained at the oil–water interface. The peptoid chains within this partially filled monolayer presumably lack the alignment and close packing required for the amines to interact with the carboxylates.
Conclusions
Peptoid nanosheets were produced at an oil–water interface with a bilayer structure comparable in thickness and crystallinity to those produced at the air–H2O interface. The use of hexane or CCl4 as the oil phase resulted in nanosheet formation, whereas some other nonpolar solvents with similar dielectric constant but possessing aromatic rings or higher viscosity did not produce nanosheets detectable by optical microscopy. Interestingly, although 1 adsorbed into a monolayer with 36-mN/m interfacial pressure at both the CCl4 and hexane interfaces (at 20-μM bulk peptoid concentration), resultant nanosheet size and yield were noticeably smaller with CCl4. Collapsing the monolayer into a bilayer may be hindered by the energetic cost of desolvating the aromatic side-chains of 1 from the oil phase.
VSF spectroscopy and interfacial tension measurements of 1 at the CCl4–H2O interface revealed that 1 packs into an ordered, dense monolayer that completely covers the interface at 20-µM bulk peptoid concentration. The aromatic CH, methylene CH, amide I, and carboxylate groups of 1 are all oriented normal to the plane of the interface, yet the peptoid backbone exhibits some flexibility in its conformation. Whereas both 1 and 2 exhibited mostly deprotonated carboxylate residues, oriented normal to the plane of the interface, the carboxylates of 1 were found to occupy three distinct chemical environments, including a direct ion–pair interaction with the cationic amines of 1 as evidenced by the peak at 1,440 cm−1. The absence of this peak in the spectrum of 2, as well as the frequency of the peak, is consistent with an ion–pair interaction between the charged carboxylate and amine residues of 1. Peptoid 2 also exhibited a more loosely packed monolayer, a broader distribution of backbone and side-chain methylene environments, and a stronger interfacial field than 1, all of which we attribute to greater electrostatic repulsion between the carboxylates of 2. The repulsive interactions in the monolayer of 2 likely inhibit nanosheet formation, whereas the attractive interactions in the monolayer of 1 likely enhance nanosheet formation. VSF spectroscopy and interfacial tension measurements of 1 as a function of concentration showed the impact of interfacial packing on peptoid conformation and organization within the monolayer. At concentrations where 1 did not tightly pack at the interface, the peptoid structure was very similar to that of 2, with an absence of the carboxylate–amine ion–pair interaction. An increase in packing of 1, however, resulted in the appearance of the ion–pair interaction and an increase in the net orientation of the peptoid functional groups normal to the plane of the interface.
This work has important implications in the design of organic 2D nanomaterials. The use of fluid interfaces to influence the chain ordering within two dimensions is a very powerful and potentially general strategy to catalyze the production of supramolecular 2D assemblies. We directly observed the importance of electrostatic interactions on peptoid assembly at the oil–water interface, and demonstrated that the peptoid monolayer can be desorbed upon compression to form nanosheet bilayers. The ability to form nanosheets from an oil–water interface opens the door for increasing their structural complexity and chemical functionality, to produce a broad class of planar nanomaterials. Like proteins, peptoid polymers can be sequence-defined, which allows for elucidation of crucial interactions that lead to efficient assembly, and offers great opportunities to explore the relationship between polymer sequence and the folded molecular structure. Our increased understanding of the interfacial assembly is an important step for the design of functionalized peptoids that can form nanosheets with protein-like properties tailored for specific applications.
Materials and Methods
Materials.
Peptoid oligomers were synthesized on an automated robotic synthesizer using the solid-phase submonomer method and purified by reverse-phase HPLC, as previously described (14). The expected (observed) molecular weights (g/mol) of 1 and 2 were 3,878.5 (3,878.6) and 4,081.4 (4,084.4), respectively. All other chemicals were purchased from Sigma Aldrich. For the VSF spectroscopic and interfacial tension studies, the CCl4 was twice distilled before using.
Peptoid Nanosheet Preparation.
Pure, lyophilized peptoid was dissolved in a 2:1 (vol/vol) mixture of DMSO:water to obtain a 2-mM peptoid stock solution stored at room temperature. Nanosheets were prepared using clean, cylindrical 4-mL glass vials, which were filled to the maximum volume with the oil–water mixture to prevent formation of an air–H2O interface. For experiments using hexane as the oil phase, 500 μL of aqueous nanosheet-forming solution (20 μM peptoid, 10 mM Tris, pH 8.0 buffer in Milli-Q water) was prepared from the 2-mM peptoid stock solution in the 4-mL glass vial, followed by gentle addition of hexane (4.2 mL) on top of the aqueous layer. For CCl4 as the oil phase, 3 mL CCl4 was added to a clean 4-mL glass vial, followed by gentle addition of ∼1.7 mL aqueous nanosheet-forming solution to completely fill the vial. All vials were tightly capped and slowly inverted to confirm the absence of any air bubbles. Vials were then rotated from vertical to horizontal at room temperature, using a previously described (15) device that allows the wait time between vial rotation cycles to be set at 900 s.
Peptoid Nanosheet Characterization.
Individual peptoid nanosheets were analyzed with AFM using an Asylum MFP-3D AFM. Before AFM analysis, the nanosheet solutions were dialyzed—using a 1-mL Spectra-Por Float-A-Lyzer device with 100-kDa molecular weight cutoff (MWCO)—overnight against pure Milli-Q water, to remove free peptoid strands and buffer salt. A 2-μL droplet of dialyzed nanosheet solution was transferred onto freshly cleaved mica and imaged with tapping mode AFM in ambient air. Powder XRD spectra were collected at a multiple-wavelength anomalous diffraction and monochromatic macromolecular crystallography beamline, 8.3.1, at the Advanced Light Source located at Lawrence Berkeley National Laboratory. Beamline 8.3.1 has a 5-T single-pole superbend source with an energy range of 5–17 keV. Data were collected with a 3 × 3 CCD array (ADSC Q315r) detector at a wavelength of 1.1159 Å. Data sets were collected with the detector 200 mm from the sample. Peptoid nanosheet solutions were concentrated 100-fold in an Amicon Ultra centrifugal filter (100 kDa MWCO, Millipore), then centrifuged at 13,200 rpm for 20 min. After removing the supernatant, the resulting peptoid nanosheet pellet was pipetted onto a Kapton mesh (MiTeGen). Data were processed with custom Python scripts. Optical imaging of nanosheets was performed under epifluorescence illumination with an Olympus IX81 inverted microscope, fitted with a Hamamatsu Orca CCD camera. Nile red, an environmentally sensitive dye whose fluorescence intensity increases substantially when it is localized in hydrophobic environments, was added to the nanosheet-containing solution at a final concentration of 0.5 μM, to stain nanosheets for imaging. Images were obtained by transferring a 2-μL aliquot of nanosheet solution onto porous 1% agarose gel, as previously described (15).
Spectroscopic Studies of Peptoid Monolayers.
The laser system used for the VSF studies has been described elsewhere (36). Briefly, a sum frequency generation spectrometer purchased from Ekspla was used to generate the visible 532-nm beam and the tunable infrared beam. The beams were coherently overlapped at the CCl4–H2O interface at their respective TIR angles. The VSF signal was collected with a monochromator and detected with a photomultiplier tube. The sample cell was machined from a solid piece of Kel-F, with a CaF2 window facing the incoming beams and a BK7 window facing the outgoing beams. The sample cell and all glassware were cleaned in a NoChromix-H2SO4 bath with subsequent rinsing in water (18.2 MΩ cm). A CCl4-Tris buffer (10 mM, pH 8) interface was first prepared and a spectrum obtained, which indicated that the buffer was not surface-active. To this aqueous layer was added an appropriate aliquot of the stock peptoid solution. The spectra shown are an average of at least 300 laser shots per data point and were normalized by dividing the raw spectra by nonresonant gold spectra in the corresponding spectral regions. The resulting spectra were fit according to the method described in SI Appendix.
Interfacial Tension Measurements.
Interfacial tension measurements were obtained at the oil–water interface using the Wilhelmy plate method according to a previously described procedure (32). Briefly, a platinum plate attached to a balance (KSV) was lowered to the neat CCl4–H2O interface and the interfacial tension was measured to be 44–46 mN/m. To the aqueous layer was added an aliquot of concentrated Tris buffer solution to obtain a bulk concentration of 10 mM (pH 8). Subsequently, an appropriate aliquot of the stock peptoid solution was deposited to the buffer layer and the interfacial tension was measured for ∼2 h. Interfacial pressure values were obtained by subtracting the equilibrium interfacial tension value of the peptoid solution from the CCl4-Tris buffer interfacial tension value (∼44 mN/m). The same protocol was used at the air–H2O interface, using a filter paper plate and the surface tension of the neat air–Tris buffer interface (∼72 mN/m) to determine the surface pressure of each peptoid solution.
Supplementary Material
Acknowledgments
The work performed at the University of Oregon has been supported by the US Department of Energy (DOE), Office of Basic Energy Sciences, Division of Materials Sciences and Engineering under Award DE-FG02-96ER45557. Portions of this work were performed as a User Project at the Molecular Foundry and the Advanced Light Source, both of which are supported by the Office of Science, Office of Basic Energy Sciences, of the US DOE under Contract DE-AC02-05CH11231. The work performed at the Molecular Foundry and Advanced Light Source was funded by the Defense Threat Reduction Agency under Contract IACRO-B1144571.
Footnotes
The authors declare no conflict of interest.
This article contains supporting information online at www.pnas.org/lookup/suppl/doi:10.1073/pnas.1414843111/-/DCSupplemental.
References
- 1.Butler SZ, et al. Progress, challenges, and opportunities in two-dimensional materials beyond graphene. ACS Nano. 2013;7(4):2898–2926. doi: 10.1021/nn400280c. [DOI] [PubMed] [Google Scholar]
- 2.Zhang K-D, et al. Toward a single-layer two-dimensional honeycomb supramolecular organic framework in water. J Am Chem Soc. 2013;135(47):17913–17918. doi: 10.1021/ja4086935. [DOI] [PubMed] [Google Scholar]
- 3.Baek K, et al. Free-standing, single-monomer-thick two-dimensional polymers through covalent self-assembly in solution. J Am Chem Soc. 2013;135(17):6523–6528. doi: 10.1021/ja4002019. [DOI] [PubMed] [Google Scholar]
- 4.Moll D, et al. S-layer-streptavidin fusion proteins as template for nanopatterned molecular arrays. Proc Natl Acad Sci USA. 2002;99(23):14646–14651. doi: 10.1073/pnas.232299399. [DOI] [PMC free article] [PubMed] [Google Scholar]
- 5.Olivier GK, et al. Antibody-mimetic peptoid nanosheets for molecular recognition. ACS Nano. 2013;7(10):9276–9286. doi: 10.1021/nn403899y. [DOI] [PubMed] [Google Scholar]
- 6.Palma C-A, Samorì P. Blueprinting macromolecular electronics. Nat Chem. 2011;3(6):431–436. doi: 10.1038/nchem.1043. [DOI] [PubMed] [Google Scholar]
- 7.Whittell GR, Hager MD, Schubert US, Manners I. Functional soft materials from metallopolymers and metallosupramolecular polymers. Nat Mater. 2011;10(3):176–188. doi: 10.1038/nmat2966. [DOI] [PubMed] [Google Scholar]
- 8.Tang Z, Kotov NA, Magonov S, Ozturk B. Nanostructured artificial nacre. Nat Mater. 2003;2(6):413–418. doi: 10.1038/nmat906. [DOI] [PubMed] [Google Scholar]
- 9.Sakamoto J, van Heijst J, Lukin O, Schlüter AD. Two-dimensional polymers: Just a dream of synthetic chemists? Angew Chem Int Ed Engl. 2009;48(6):1030–1069. doi: 10.1002/anie.200801863. [DOI] [PubMed] [Google Scholar]
- 10.Colson JW, Dichtel WR. Rationally synthesized two-dimensional polymers. Nat Chem. 2013;5(6):453–465. doi: 10.1038/nchem.1628. [DOI] [PubMed] [Google Scholar]
- 11.Bauer T, et al. Synthesis of free-standing, monolayered organometallic sheets at the air/water interface. Angew Chem Int Ed Engl. 2011;50(34):7879–7884. doi: 10.1002/anie.201100669. [DOI] [PubMed] [Google Scholar]
- 12.Zheng Y, et al. Supramolecular thiophene nanosheets. Angew Chem Int Ed Engl. 2013;52(18):4845–4848. doi: 10.1002/anie.201210090. [DOI] [PubMed] [Google Scholar]
- 13.Nam KT, et al. Free-floating ultrathin two-dimensional crystals from sequence-specific peptoid polymers. Nat Mater. 2010;9(5):454–460. doi: 10.1038/nmat2742. [DOI] [PubMed] [Google Scholar]
- 14.Kudirka R, et al. Folding of a single-chain, information-rich polypeptoid sequence into a highly ordered nanosheet. Biopolymers. 2011;96(5):586–595. doi: 10.1002/bip.21590. [DOI] [PubMed] [Google Scholar]
- 15.Sanii B, et al. Shaken, not stirred: Collapsing a peptoid monolayer to produce free-floating, stable nanosheets. J Am Chem Soc. 2011;133(51):20808–20815. doi: 10.1021/ja206199d. [DOI] [PubMed] [Google Scholar]
- 16.Sun J, Zuckermann RN. Peptoid polymers: A highly designable bioinspired material. ACS Nano. 2013;7(6):4715–4732. doi: 10.1021/nn4015714. [DOI] [PubMed] [Google Scholar]
- 17.Payamyar P, et al. Synthesis of a covalent monolayer sheet by photochemical anthracene dimerization at the air/water interface and its mechanical characterization by AFM indentation. Adv Mater. 2014;26(13):2052–2058. doi: 10.1002/adma.201304705. [DOI] [PubMed] [Google Scholar]
- 18.Conboy JC, Messmer MC, Richmond GL. Investigation of surfactant conformation and order at the liquid-liquid interface by total internal reflection sum-frequency vibrational spectroscopy. J Phys Chem. 1996;100(18):7617–7622. [Google Scholar]
- 19.Richmond GL. Molecular bonding and interactions at aqueous surfaces as probed by vibrational sum frequency spectroscopy. Chem Rev. 2002;102(8):2693–2724. doi: 10.1021/cr0006876. [DOI] [PubMed] [Google Scholar]
- 20.Zuckermann RN, Kerr JM, Kent SBH, Moos WH. Efficient method for the preparation of peptoids [oligo(n-substituted glycines)] by submonomer solid-phase synthesis. J Am Chem Soc. 1992;114(26):10646–10647. [Google Scholar]
- 21.Goates JR, Sullivan RJ, Ott JB. Heats of mixing in the system carbon tetrachloride-cyclohexane-benzene. J Phys Chem. 1959;63(4):589–594. [Google Scholar]
- 22.Anderson R, Prausnitz JM. Spectroscopic evidence for complex formation between carbon tetrachloride and aromatic hydrocarbons. J Chem Phys. 1963;39(5):1225–1226. [Google Scholar]
- 23.McGlashan ML, Stubley D, Watts H. Enthalpies of mixing and complex formation of carbon tetrachloride with benzene, toluene, p-xylene, and mesitylene. J Chem Soc A. 1969:673–678. [Google Scholar]
- 24.Ahmed A. Complex-formation between carbon tetrachloride and alkyl-substituted benzenes. J Chem Soc, Faraday Trans. 1973;69(3):540–545. [Google Scholar]
- 25.Hwang C-A, Elkabule AS, Whitman DL, Miller RC. Excess molar enthalpies of (benzene + cyclohexane + n-hexane) J Chem Thermodyn. 1987;19:1031–1036. [Google Scholar]
- 26.Mitsui K, Ukaji T. 1977. Infrared spectra of some aqueous solutions. Res Rep Ikutoku Tech Univ B-2:77–82.
- 27.Lin-Vien D. The Handbook of Infrared and Raman Characteristic Frequencies of Organic Molecules. San Diego: Academic; 1991. [Google Scholar]
- 28.Ong SW, Zhao XL, Eisenthal KB. Polarization of water-molecules at a charged interface - 2nd harmonic studies of the silica water interface. Chem Phys Lett. 1992;191(3-4):327–335. [Google Scholar]
- 29.McFearin CL, Beaman DK, Moore FG, Richmond GL. From Franklin to today: Toward a molecular level understanding of bonding and adsorption at the oil-water interface. J Phys Chem C. 2009;113(4):1171–1188. [Google Scholar]
- 30.Murnen HK, Rosales AM, Dobrynin AV, Zuckermann RN, Segalman RA. Persistence length of polyelectrolytes with precisely located charges. Soft Matter. 2013;9(1):90–98. [Google Scholar]
- 31.Beaman DK, Robertson EJ, Richmond GL. From head to tail: Structure, solvation, and hydrogen bonding of carboxylate surfactants at the organic-water interface. J Phys Chem C. 2011;115(25):12508–12516. [Google Scholar]
- 32.Tang CY, Allen HC. Ionic binding of Na+ versus K+ to the carboxylic acid headgroup of palmitic acid monolayers studied by vibrational sum frequency generation spectroscopy. J Phys Chem A. 2009;113(26):7383–7393. doi: 10.1021/jp9000434. [DOI] [PubMed] [Google Scholar]
- 33.Tang CY, Huang Z, Allen HC. Binding of Mg(2+) and Ca(2+) to palmitic acid and deprotonation of the COOH headgroup studied by vibrational sum frequency generation spectroscopy. J Phys Chem B. 2010;114(51):17068–17076. doi: 10.1021/jp105472e. [DOI] [PubMed] [Google Scholar]
- 34.Tamada JA, King CJ. Extraction of carboxylic-acids with amine extractants. 2. Chemical interactions and interpretation of data. Ind Eng Chem Res. 1990;29(7):1327–1333. [Google Scholar]
- 35.Hwang YS, Lenhart JJ. Adsorption of C4-dicarboxylic acids at the hematite/water interface. Langmuir. 2008;24(24):13934–13943. doi: 10.1021/la801793p. [DOI] [PubMed] [Google Scholar]
- 36.McFearin CL, Richmond GL. The role of interfacial molecular structure in the adsorption of ions at the liquid-liquid interface. J Phys Chem C. 2009;113(50):21162–21168. [Google Scholar]
Associated Data
This section collects any data citations, data availability statements, or supplementary materials included in this article.