

Abstract
Deficiency of IQGAP2, a scaffolding protein expressed primarily in liver leads to rearrangements of hepatic protein compartmentalization and altered regulation of enzyme functions predisposing development of hepatocellular carcinoma and diabetes. Employing a systems approach with proteomics, metabolomics and fluxes characterizations, we examined the effects of IQGAP2 deficient proteomic changes on cellular metabolism and the overall metabolic phenotype. Iqgap2−/− mice demonstrated metabolic inflexibility, fasting hyperglycemia and obesity. Such phenotypic characteristics were associated with aberrant hepatic regulations of glycolysis/gluconeogenesis, glycogenolysis, lipid homeostasis and futile cycling corroborated with corresponding proteomic changes in cytosolic and mitochondrial compartments. IQGAP2 deficiency also led to truncated TCA-cycle, increased anaplerosis, increased supply of acetyl-CoA for de novo lipogenesis, and increased mitochondrial methyl-donor metabolism necessary for nucleotides synthesis. Our results suggest that changes in metabolic networks in IQGAP2 deficiency create a hepatic environment of a ‘pre-diabetic’ phenotype and a predisposition to non-alcoholic fatty liver disease (NAFLD) which has been linked to the development of hepatocellular carcinoma.
Introduction
IQGAPs are multi-domain scaffolding proteins named for the IQ motifs and GTPase activating protein (GAP) related domains but do not stimulate GTP hydrolysis [1]. Three IQGAP isoforms have been identified at present and have been shown to regulate numerous cellular processes including adhesion, motility, signaling, exocytosis, cytokinesis [2, 3]. They are also putative targets for CDC42 and Rac GTPase binding proteins [4–7]. Tissue expression levels of IQGAP proteins are quite diverse. While IQGAP1 is ubiquitous[8], IQGAP2 is present predominantly in liver and to some extent in prostate, kidney, thyroid, stomach, testis, platelets and salivary glands with reasonable expression of IQGAP2 also in white adipose, adrenal glands, pancreas and pancreatic islets [9]; and IQGAP3 is reported to be present in brain, lung, testis, small intestine and colon [10, 11].
IQGAP proteins have been implicated in cancer. IQGAP1 and several of its binding partners have been shown to promote metastasis and tumorigenesis causing IQGAP1 to be labeled as an oncogene [10]. IQGAP2 on the other hand is a tumor suppressor [12, 13]. IQGAP2 was originally shown in the regulation of thrombin-induced platelet cytoskeletal actin reorganization [14]. Later efforts showed that IQGAP2 exists in two pools; i) as an integral component of a huge multi-protein scaffolding complex consisting of IQGAP1, IQGAP2, β-catenin and Ecadherin, and ii) as part of the β-catenin destruction complex consisting of GSK3β kinase, Axin and Adenomatous polyposis coli (APC)[12]. Loss of IQGAP2 in SV129J mice led to an IQGAP1 dependent development of hepatocellular carcinoma (HCC) around 12 months of age [12]. IQGAP2 has also been identified as one of the potential molecular targets of HCC in human liver biopsy samples [15].
Scaffolding function of IQGAPs has been previously shown to involve the MAP kinase signaling pathway [16]. The participation of IQGAP2 in several pathways of mammalian cellular signaling, namely Wnt signaling, (GSK3β) and cAMP-PKA signaling (AKAPs) suggests the possibility that IQGAP2 might play a role in cellular energy homeostasis. This notion was supported by the observations [17] that IQGAP2 deficient murine models on a SV129J background displayed enhanced insulin sensitivity and were protected against high fat diet induced hepatic steatosis. Ca2+/calmodulin signaling plays a well-known and crucial role in modulating insulin release by the pancreatic β-cells [18–20]. Interestingly the IQ motifs in IQGAP interact and bind calmodulin [21, 22]. Further, IQGAP2 has been identified as a substrate for PKA phosphorylation and the binding partner for the AKAP220 forming a ternary complex together with PKA [23]. Recent findings by Hinke et al [24], highlight the importance of protein anchoring in insulin secretion and glucose homeostasis. We report here that whole body genetic ablation of Iqgap2−/− on a C57BL/6J background presents with an obese, glucose intolerant and metabolically inflexible phenotype. Since cellular metabolic regulation is sensitive to alteration of scaffolding protein compartmentalization and alterations of changes in enzyme functions, we have employed a systems approach to examine proteomic and metabolomic changes in IQGAP2 deficiency. Since proteomic changes reflect adaptive mechanisms in metabolic networks, we were able to identify the systems-level metabolic changes associated with IQGAP2 deficiency by combining hepatic proteomics, metabolomics and metabolic flux measurements.
Our principal findings include a) parallel accelerations of both glycolysis and gluconeogenesis inducing futile hepatic carbon cycling, b) augmented malate-aspartate shuttle (anaplerosis), and c) enhanced de novo lipogenesis. These metabolic derangements together with IQGAP2 scaffolding function in intracellular signaling, implicate IQGAP2 as more than just a casual participant in the modulation of cellular homeostasis. Our results suggest that changes in metabolic networks resulting from IQGAP2 deficiency create a hepatic environment congenial for neoplastic transformation.
Materials and Methods
Ethics Statement
All animal studies were performed under approved institutional protocols and according to guidelines established in the Guide for the Care and Use of Laboratory Animals.
Animals
Iqgap2 −/− mice on a C57BL/6J background were a generous gift from Dr. Schmidt VA (SUNY, Stony Brook). Age matched C57BL/6J obtained from The Jackson Laboratory (Bar Harbor, Maine, USA.) were used as controls. All animals were males, 4–5 months of age, and fed standard laboratory chow diet (PICOLab Rodent Diet 20; 5058). Animals were maintained under 12-h light/dark conditions (0700 h/1900 h) for all studies. Animals from each group for calorimetry experiments (n=4) (REF) were also used for body composition analyses (n=5) and stable isotope glucose tolerance test (n=10) (REF) and were finally sacrificed after [U-13C6]-glucose infusions using Alzet osmotic mini-pump experiments.
Body Composition
Body composition was determined by low resolution NMR. Percent lean mass and fat mass were calculated as a proportion of body weight. Iqgap2−/− mice and age matched control mice were examined.
Indirect Calorimetry
Measurements of oxygen consumption (VO2) and respiratory quotient (RER) were performed using an Oxymax indirect calorimetry system (Columbus Instruments, Columbus, OH). Mice (n=8/genotype) were housed individually in the chamber for 48 h with lights on from 0700 to1900 h in an ambient temperature of 22–24°C. Food and water was available adlib. Gas exchange measurements were made under Oxymax system settings as follows: air flow, 0.6 l/min; sample flow, 0.5l/min; settling time, 6 min; and measuring time, 3 min. Ambulatory activity was determined simultaneously using an Opto-Varimetrix-3 sensor system. Consecutive adjacent infrared beam breaks in either the x- or y-axes were scored as an activity count.
Fast/Refed studies
In order to evaluate metabolic flexibility, proteomic and metabolomic samples were collected from animals according to the fast/refed paradigm. Animals had access to food and were allowed to eat for an hour and half after the beginning of the dark cycle (1900 h). Fasting was initiated by removing the food at 2030 h. Animals (n=5) for each group (Iqgap2−/− and control) were sacrificed the next day either at the end of 18 hours fast (1430 h) or refed for 5 hours (13 hours over-night fast and refed for 5hrs beginning 0930h to 1430h). Liver and skeletal muscle (whole quadriceps) were harvested, snap-frozen in liquid N2 and stored at −80° C until further analysis. Livers from the fast and refed experiments performed without tracer were used for hepatic metabolite profiling, immunoblot, glycogen, lipid TLC, acetyl CoA, and proteome (n=3) analyses. Short term fast studies were done for estimating glycogenolysis and de novo lipogenesis. For analyses of glycogen (liver and muscle), and de novo lipogenesis fast was initiated by removing food at the beginning of the light cycle (0700 h) for 4 h (1100 h). At the end of 4 hour fast, 3 groups of 5 animals were sacrificed after an additional 30, 60, and 150 minutes. Plasma, liver and skeletal muscle (whole quadriceps) were harvested snap-frozen in liquid N2 and stored at −80°C until further analysis.
Stable Isotope Flux Phenotyping (SIPHEN)
SIPHEN studies included [U-13C6]-glucose infusions delivered using Alzet mini-osmotic pumps was used to determine glucose turnover [25] and glucose re-cycling and (SipGTT) stable isotope labeled glucose tolerance test ([6,6-2H2]-glucose) to evaluate insulin sensitivity [26]. All stable isotopes were purchased from Cambridge Isotope Laboratories (Andover, MA, USA.) and were pyrogen tested before use. Blood samples were analyzed on a GC/MS after compound isolation and derivatization. For details see our previous studies [25–27]. Lipogenesis was measured using deuterated water [2H2O], tracing the enrichment of deuterium in stearate and cholesterol [28]. Mice were fasted at 0700 h for 4h. At 1100 h, mice received an intraperitoneal injection of deuterated water (2H2O, at a concentration of 4% lean body mass) containing 0.9% sodium chloride and were maintained on 4% 2H2O as drinking water till the end of the experiment. Mice were sacrificed at the end of each time point (30, 60 and 150 minutes) following the 4 h fast (0700–1100 h). Blood was collected from the retro-orbital sinus. Liver and skeletal muscles (quadriceps) were removed and snap frozen in liquid nitrogen. Plasma was used for measuring body deuterium enrichment. Fatty acids were analyzed as its trimethylsilyl derivative using gas chromatography (GC) -electron impact ionization mass spectrometry (MS) as previously described [29].
Hepatic Metabolite Profiling
Metabolite measurements for fast/refed Iqgap2−/− mice and control mice liver samples were performed using freeze clamped liver samples from fasted/re-fed experiments that were extracted in ice-cold methanol/water(1:1) spiked with internal standards (U-13C4 succinate and U-13C6 citric acid, (150 n moles/gm liver). The aqueous phase was lyophilized, derivatized as previously described [30], GC-MS analysis performed using an Agilent 7890a GC with a Gerstel automatic liner exchange cooled injection system CIS 4 PTV injector. Both split and large volume injections (LVI) of the sample were made. GC-MS conditions and metabolite identification was done as described [31] and metabolites were identified using using NIST 11 and Fiehn mass spectral libraries.
For hepatic mass isotopomer analysis freeze clamped liver samples from [U-13C6]-glucose infusion experiments was extracted in ice-cold methanol. Extracts were lyophilized and analysed on GCMS as trimethyl silyl esters under chemical ionization conditions with 20% methane as reagent gas under GC oven conditions as described in [31]. Selective ion monitoring of (m/z 218 for alanine, m/z350 for aspartate, m/z348 for glutamate) and their respective isotopomers (m+n) ions were monitored.
LCMS analysis was performed in a Waters Acquity UPLC system attached to a Xevo Triple Quadrupole mass spectrometer equipped with an electrospray ionization source (ESI) (Waters Corp., Milford, MA) for acylcarnitines in plasma [32] and hepatic acetyl CoA [33] with slight modifications for sample preparation as described in Supplemental notes.
A detailed description for any modifications and metabolites measurements using GCMS analysis is described in Supplemental Notes.
Thin Layer Chromatography, Glycogen and Immunoblot Analysis
Lipid content analysis using thin layer chromatography (TLC), glycogen content, and immunoblotting were performed as described previously [34, 35]. Detailed procedure is described in the supplemental notes.
Serum Analysis
Plasma glucose levels were determined by COBAS MIRA analyzer (Roche, Montclair, NJ) using the Glucose UV Reagent (catalog no. 80017, Raichem, San Diego, CA, USA.). Plasma insulin was determined using an ultra-sensitive rat/mouse Insulin ELISA Kit (Crystal Chem. Inc., Cat# 90060, USA.).
Statistical Analyses
Data are expressed as the mean ± SEM. Analyses for the significance of differences were performed using the Student’s t-test and Anova using GraphPad Prism version 5.00 for Windows, GraphPad Software, San Diego California USA, www.graphpad.com.
Quantitative Proteomic Analysis by Liquid Chromatography-Mass Spectrometry (LC-MS)
Protein digestion and desalting
Liver proteins from fast/refed animals were extracted in ice-cold RIPA buffer containing suitable protease and phosphatase inhibitors (Roche diagnostic cocktail tablets, Indianapolis, USA.). Proteins were precipitated with acetone, followed by centrifugation at 22,000g for 10 minutes. The resulting pellet was rinsed twice with cold acetone to remove residual salts, resuspended in 50mM NH4HCO3 (pH 8.5). Protein extracts from three biological replicates per condition (total number of samples = 12) were digested, desalted, and analyzed in triplicates (36 MS measurements) as follows: Protein pellets were resuspended in 100 mM ammonium bicarbonate (pH 7.8). Total protein concentration was determined with Bio-Rad Protein Assay Dye Reagent using manufacturer’s instructions (Bio-Rad, Hercules, CA, USA.). Protein samples (60 μg) were reduced with 10 mM dithiothreitol for 45 min, then alkylated with 20 mM iodoacetamide for 45 min in the dark and then digested with Sequencing Grade Modified trypsin (Promega, Madison, WI) at a ratio of 1:50 (trypsin to protein) for 18 hours at 37°C. After digestion, peptides were desalted and concentrated using Waters Sep-Pak C18 1 cc solid phase extraction (SPE) cartridges (Waters Corp, Milford, MA, USA.) as per the manufacturer’s recommendations. Briefly, peptide digests (pH < 3) were loaded on a pre-conditioned C18 column and subsequently washed/desalted three times using deionized water with 0.1% TFA. In the final concentration step, the peptides were eluted in 250 μL of 70% acetonitrile:0.1% TFA and then dried by vacuum centrifugation. The digests were reconstituted in 50 μL of 0.1% formic acid in water and peptide concentrations were determined by BCA assay (Pierce, Rockford, IL, USA.). These stock digests were stored at −80°C until use. The stock digests were thawed and a 500 μg/mL of working solution of peptide digests were prepared in solvent A (water containing 0.1% formic acid), prior to the LC-MS analysis.
LC-MS analysis
The peptide samples (500 μg/mL) were analyzed in triplicate using a nanoAcquity UPLC (Waters, Milford, MA) coupled to a custom Velos-FTICR Ultra hybrid mass spectrometer [36], (Thermo Scientific, Waltham, MA, USA.). Please refer to the Supplemental Notes for details of LC-MS analysis method.
Data processing and relative quantitation of proteins by Normalized Spectral Counting (SIN)
The raw mass spectrometry data was converted to mzXML format using ReAdW (Ver. 4.3.1). An in-house script was implemented to generate MS2 files from the individual mzXMLs to store MS/MS ion intensities information. The mzXML files were subjected to SEQUEST (version UWPR2012.01.3) to search the data against the UniProt/SwissProt/TrEMBL Mouse protein database containing both forward and reverse protein sequences, containing 85,714 total protein sequences. The SEQUEST search parameters used were as follows: digesting enzyme trypsin with up to 3 missed cleavages; fixed post-translation medication of carbamidomethylation (57.021464 Da) on Cysteine and variable modification of oxidation (15.9949 Da) on Methionine. The SEQUEST output file pepXML and the corresponding MS2 file for each sample were then submitted to a software toolkit called ‘Crux’ [37], for calculating spectral counts for the identified proteins from each sample by Normalized Spectral Index (SIN) method [38]. A PeptideProphet [39], cut off of 0.90 (corresponding to False Discovery Rate (FDR) ≤ 1%) was used to filter out low confidence peptide spectrum matches (PSMs) and calculate SIN for the proteins of the remaining PSMs. The Crux spectral count output files containing a list of proteins and corresponding SIN values were subjected to statistical analysis.
Statistical Analysis for Proteomics Studies
The SIN values were first transformed to Log2. The Log2(SIN) values for individual proteins identified from the three MS measurements per each of the three biological replicates per condition were combined to obtained a master list per condition. Proteins that were not detected in at least six out of nine MS measurements (SIN ≤ 6) were removed from the master lists. The two masters lists corresponding to 18 hr fast and refed Iqgap2−/− mice were combined with their respective controls in order to obtain 18 SIN values (9 for control, 9 for Iqgap2−/− mice samples), and one-way Analysis of Variance (ANOVA) test was performed to identify changes in protein levels between the two conditions that appeared statistically significant. A nominal P-value cut off of 0.05 was used to compute a list of significantly changing proteins between control vs Iqgap2−/− mice.
Results
Iqgap2−/− mice were generally obese and hyperglycemic. General body composition, plasma glucose and insulin measurements for Iqgap2−/− and control mice following an overnight fast are given in Supplemental Table 1. Food intake was similar between both groups of mice. Iqgap2−/− mice were heavier and showed a significantly altered body composition compared to control mice. Iqgap2−/− mice had >8 times body fat mass percentage and significantly lower lean body mass (P<0.001) than the control mice. These changes readily suggest alterations in fuel substrate metabolism which were investigated further using indirect calorimetry, metabolomics and proteomics.
Metabolic inflexibility in Iqgap2−/− mice - Indirect calorimetry analyses
Figure 1 shows indirect calorimetric measurements on Iqgap2−/− and control mice made during three different nutritional challenges namely adlib, overnight fast for 12 h and refed for 5 hours. During the adlib feeding period, RER (respiratory exchange ratio) for Iqgap2−/− mice were consistently lower than those of the control (<0.9 vs >0.90, p<0.05). During an overnight fast, RER of both Iqgap2−/− and control mice were similar at about 0.75 suggesting fatty acids being the major fuel. Upon, refeeding, RER for the control mice approached 1.0 and about 0.90 for the Iqgap2−/− mice. Oxygen consumption (VO2) normalized to total body mass, to lean body mass and ambulatory activity were all observed to be comparable between the groups (Supplemental Figure S1). RER measurements represent fuel utilization by the skeletal muscle. Therefore, lower RER despite comparable oxygen consumption with IQGAP2 deficiency implies a substrate preference toward amino acid and fatty acid oxidation by the skeletal muscle of Iqgap2−/− mice as compared to the control mice in the fed state.
Figure 1.

Indirect Calorimetry: Respiratory exchange ratio (RER) for Iqgap2−/− and control mice were determined during the diurnal cycle and fasted to refed transitions. Day (light cycle) and night (dark cycle) 12 hours, (over)night fast – 15hrs, day refed - 5hrs in duration. n=8, Data are mean ±SEM. Error bars are represented only in one direction for clarity.
Plasma amino acid profile for Iqgap2−/− and control mice during overnight fast/refed experiments are shown in Supplemental Table S2. Amino acids constitute a significant segment of fuel substrates and their levels fluctuate between fast and refed states. The Fast/refed ratio indicates the periods when the plasma amino acids are most consumed or replenished. Ratios less 1 than indicates that the amino acid is replenished by refeeding and ratios greater than 1 indicates that the amino acid is better used during the fed period. For example, Fast/refed ratios of the two gluconeogenic amino acids alanine and glutamic acid, were below one for both Iqgap2−/− and control mice, indicating that these amino acids were replenished after refeeding. Metabolic inflexibility is expected to affect utilization of amino acids. Results in Table S2 demonstrate not only that fasting amino acid profiles were different between Iqgap2−/− and control mice (last column of Table S2), but the dynamic changes within and between fast/refed two conditions was also different. Notably, Iqgap2−/− mice synthesized and consumed the branched chain amino acids (BCAA) valine, leucine differently (also see Supplemental Figure S2). Iqgap2−/− mice also demonstrated abnormality in plasma profiles of serine, threonine and glycine, the amino acids involved in one-carbon metabolism. Serine and glycine are products of glucose and precursors for gluconeogenesis. The serine-glycine pathway is energy producing and a source of substrates for nucleotide base synthesis and methyl donor generation. It can be seen from Table S2 that in the fasted Iqgap2−/− mice, levels of serine were increased over twofold (fast/re-fast: 2.28, P <0.05; Fast Iqgap2−/−/control: 2.24, P <0.05) while glycine levels were decreased by ~20 to 25% in both comparisons. Observations of increased levels of 3-phosphoglycerate (see below), a glycolytic and also an intermediate of serine biosynthetic pathway during the 18hr fast reflects the altered plasma profile of serine and glycine in fasted Iqgap2−/− mice.
Abnormal central glucose metabolism in Iqgap2−/− mice
Glycolytic intermediates as expected were generally higher for control mice after refeeding compared to those of the fasted state. But the glycolytic intermediates of Iqgap2−/− mice in the fasted state were in the same order of magnitude as those after refeeding and were statistically higher than those of the fasted control mice (Figure 2a and 2c). It is important to note that glycolytic intermediates are also intermediates of the pentose cycle. Consequently, pentose cycle intermediates were also elevated (discussed below) in Iqgap2−/− mice during the 18hr fast. Metabolic intermediates of the TCA cycle did not fluctuate between fasting and refeeding between the groups; while citrate and isocitrate were significantly increased in Iqgap2−/− mice during the18hr fast (Figure 2b and 2d).
Figure 2.

Hepatic metabolomic analysis of glycolytic and the TCA cycle intermediates following an 18hr fast (panels a and c) and 5hr refed (panels b and d) experiments are illustrated. Intermediates are separated according to the cytosolic (left panel) and mitochondrial (right panel) compartments. Data are mean ± SEM for n=5, *p<0.05, **p<0.01 control and Iqgap2−/− mice. G6P-glucose-6-phosphate, F6P-fructose-6-phosphate, DHAP-dihydroxyacetone phosphate, α-GlyP-α-glycerophosphate, 3-PG- 3 phosphoglycerate, PEP-phosphoenol pyruvate, PYR-pyruvate, LAC-lactate, AMP- adenosine mono phosphate. SUC-succinate, FUM-fumarate, MAL-malate, CIT-citrate, ISOCIT-isocitrate.
Figure 3 illustrates glucose, glycogen and insulin measurements from Iqgap2−/− mice compared to control mice. The observed elevation of glycolytic intermediates in Iqgap2−/− mice could be the result of increase glycolytic flux or metabolic compensation for ineffective glycolysis. If glycolytic flux were responsible, one would also expect to observe rapid disappearance of plasma glucose and hepatic glycogen. However during a short-term fast, the decrease in blood glucose (Figure 3a) liver glycogen (Figure 3b) in Iqgap2−/− mice appears much slower than those in control mice. This suggests impaired glycogenolysis and ineffective glycolysis as compared to pentose cycle metabolism with IQGAP2 deficiency. Associated with changes in glycolytic and pentose cycle pathways was the development of hyperglycemia (Figure 3c) and hyperinsulinemia (Figure 3d) in the Iqgap2−/− mice compared to the control. Iqgap2−/− mice were both hyperinsulinemic and hyperglycemic demonstrating 38% higher plasma glucose, despite a 3-fold increase in plasma insulin (also Supplemental Table S1). Figure 3e illustrates mass isotopomers during stable isotope [U-13C6]-glucose (M+6) infusion studies to evaluate hepatic glucose production. Mi/Σm is the mass isotopomers from infusion and recycling of [U-13C6]-glucose (M+6) with i number’13C substitutions as a fraction of the total labeled molecules [Σm=1-(m+0)]. The fraction of M+6/Σm was lower for Iqgap2−/− mice. However, hepatic glucose production (Supplemental Figure S3a, 19.5±1.6 mg/kg/min for Iqgap2−/− mice, 20.4±2.5 mg/kg/min for the control mice) was comparable between the groups. Liver produces glucose (hepatic glucose production) during the fasted state by gluconeogenesis and glycogenolysis. [U-13C6]-glucose molecules can also be taken up and metabolized in the muscle to lactate and alanine producing m+3 lactate and alanine. These labeled metabolites are subsequently recycled into glucose in the liver (gluconeogenesis). Since the probability of two labeled lactate species coming together is low, the new glucose is labeled as m+1, m+2 and m+3. Gluconeogenesis from lactate consumes energy. The process of glucose becoming lactate and then glucose again is known as the Cori cycle and is a futile process where energy is expended to complete the cycle [40]. As was seen earlier from Figure 3b, glycogenolysis was impaired in Iqgap2−/− mice. The fraction of infused [U-13C6]-glucose molecules that recycled as M1/Σm, M2/Σm, M3/Σm was significantly higher for Iqgap2−/− mice (Figure 3e). The sum of mass isotopomers (M1/Σm+M2/Σm+M3/Σm) represented as ‘F’ which is the fraction of molecules contributed by Cori cycling and is also the percent contribution to hepatic glucose production from Cori cycling [41], was significantly higher in Iqgap2−/− mice (58.0±3.4%) compared to control mice (49.5±2.7%, p<0.002) (Supplemental Figure S3b). These results demonstrate that despite impaired glycogenolysis, increased glucose carbon recycling through gluconeogenesis (Cori cycle) maintains the hepatic glucose production in Iqgap2−/− mice, which is a factor contributing to hyperglycemia observed with IQGAP2 deficiency.
Figure 3.

Experiments illustrating glucose homeostasis for Iqgap2−/− versus control mice. Top panel illustrates glycogenolysis with (a) represents plasma glucose disappearance (b) represents glycogen break down, after 30, 60 and 150 minutes following a short term fast; Each point represents the mean ± SEM, n=5. *p<0.05, ** p <0.01 for Iqgap2−/− vs. control mice. Center panel illustrates levels of plasma glucose (c), plasma insulin (d) after 18 hrs fast/re-feeding; Data is mean ± SEM, n=5. Bottom panel illustrates glucose clearance measured during stable isotope studies (e) represents Cori cycling during [U-13C6]-glucose infusion studies, mi/Σm is the mass isotopomers with i number’13C substitutions as a fraction of the total labeled molecules. Since there are no 13C enriched molecules before the infusion, F is a fraction of (new) plasma glucose derived from U13C-glucose infused as well as 13C glucose from Cori cycle recycling. Plotted data points indicate the mean value ± SEM, n=5, *p<0.05, ** p <0.01 for Iqgap2−/− vs. control mice; and (f) represents peripheral glucose utilization during SipGTT for overnight fasted, Iqgap2−/− vs. control mice. Time course of plasma [6, 6-2H2]-glucose after the bolus i.p injection of [6, 6-2H2]-glucose is shown. Each point shown represents the mean ± SEM, n=5. *p<0.05, ** p <0.01 for Iqgap2−/− vs. control mice.
Peripheral glucose utilization in Iqgap2−/− mice was further evaluated by a stable isotope glucose tolerance test (SiGTT) using [6,6-2H2]-glucose. Peripheral glucose utilization was calculated as the rate of disappearance of stable isotope labeled [6,6-2H2]-glucose and was significantly slower for the Iqgap2−/− mice as indicated by the increased levels of D2-glucose observed in mutant mice at 30 minutes (Figure 3f). Integrated response for the time course calculated as area under the curve (AUC) for [6,6-2H2]-glucose was high in Iqgap2−/− mice (4988+3.1 vs 3788+5.3) accompanied by a significantly high insulin response (AUC) compared to the control mice (93.4+0.12 vs 38.88+0.06) suggesting insulin resistance. Impaired glucose tolerance in the face of obesity predisposes Iqgap2−/− mice for the development of Type II diabetes [34].
Anaplerosis (Truncated TCA cycle) and fatty acid metabolism
Effects of anaplerosis (truncated TCA cycle) on lipid homeostasis in Iqgap2−/− mice are illustrated in Figure 4. Metabolites pertaining to fatty acid synthesis and oxidation are represented as left and right panels respectively. Mitochondrial function is characterized by a balance between anaplerosis, oxidation and use as precursors, two critical processes that control the entry and exit of metabolites into the TCA cycle [42]. Increased anaplerosis implies truncated TCA cycle which is a mechanism for gluconeogenesis, malate shuttle and citrate cycle. These processes regenerate gluconeogenic amino acids, acetyl-CoA and reducing equivalents. Increased anaplerosis with IQGAP2 deficiency was also evident from hepatic mass isotopomer distributions of aspartate and glutamate analysed by [U-13C6]-glucose infusion experiments (Supplemental Table S6). During anaplerosis, substrate flux of the individual TCA cycle intermediates exceeds that of the TCA cycle flux in support of gluconeogenesis, amino acid synthesis and nucleic base synthesis. Functionally it oprates as if TCA cycle is truncated. These metabolic changes were clearly evident with IQGAP2 deficiency and are illustrated by the different panels in the Figure 4. An increased level of pentose intermediates indicative of increased pentose cycle activity provides reducing equivalents (NADPH) for the increased de novo lipogenesis. Accordingly it can be noted that the increase in hepatic pentose intermediates during the 18hr fast in Iqgap2−/− mice (Figure 4a) was associated with increased hepatic acetyl-CoA concentration (Figure 4b) and an increase in hepatic de novo lipogenesis (Figure 4c). In inborn errors of metabolism wherein oxidation of fatty acids or branch chain amino acids are compromised, plasma short chain (C2, C3, C4) acylcarnitine levels are increased reflecting increased intracellular acylcarnitine pool. Figure 4d illustrates plasma acylcarnitine profile in Iqgap2−/− and control mice during a short term fast. It can be noted that acylcarnitine levels of medium and long chain fatty acids (C6–C16) were significantly decreased, whilst short chain (C2, C3, C4) had a tendency to increase in Iqgap2−/− mice compared to those of control suggesting increased fatty acid β oxidation. The decreased plasma acylcarnitine in Iqgap2−/− mice was associated with elevated free fatty acid levels both in the fast (Figure 4e) and fed (Figure 4f) states. Despite signs of elevated fatty acid oxidation, plasma β-hydroxybutyrate levels were lower in the Iqgap2−/− mice compared to the control (0.55±0.05 vs 0.87±0.06 ug/uL, p<0.01). Plasma cholesterol was increased both during 18hr fast and refeeding in Iqgap2−/− mice. Acetoacetate is the common substrate for the ketone body, cholesterol and fatty acid synthesis and can be reduced to β-hydroxybutyrate depending on the NAD pool of the cell. Decreased plasma β-hydroxybutyrate levels in Iqgap2−/− mice reflect abnormal regulation of ketone body synthesis in light of the suspected increased fatty acid oxidation. A 6-fold increase in HMG-CoA synthase, enzyme involved in cholesterol biosynthetic pathway reflects the above observation (Table 1, discussed below).
Figure 4.
Metabolomic analyses for lipid homeostasis comprising fatty acid synthesis (left panel) and fatty acid oxidation (right panel). (a) represents hepatic pentose intermediates during 18hr fast. 6-P-glucontate - 6-phospho gluconic acid, Ribulose-5-p – ribulose-5-phosphate, Ribose-5-p – ribose-5-phosphate. (b) represents hepatic acetyl CoA concentrations during 18hr fast and refed states. (c) represents hepatic de novo lipogeneic flux assessed as deuterium incorporation from 2H2O. Each point shown represents the mean ± SEM for fatty acid deuterium enrichment, n=5. *p<0.05, **p <0.01 for Iqgap2−/− vs. control mice. d) represents plasma acylcarnitine profile at (150mins) at the end of a short-term fast experiment. e) represents plasma lipid metabolites during 18hr fast, (f) represents plasma lipid metabolites during 5hr re-feeding experiment. All plotted data points indicate the mean value ± SEM, n=5, *p<0.05, **p <0.01, ***p <0.001 for Iqgap2−/− vs. control mice.
Table 1.
List of critical metabolic proteins showing significantly increased level
| Protein ID | Fast Iqgap2−/−/Fast Control | Proteome category | p value | FC → |
|---|---|---|---|---|
| Cytosolic | ||||
| Q8QZR5** | Alanine aminotransferase 1 (ALT1) | TCA cycle | 4.30E-03 | 6.6 |
| Q60648 | Ganglioside GM2 activator | Lipid Homeostasis | 2.24E-02 | 3.5 |
| P53657 | Pyruvate kinase isozymes R/L (L-PK) | Glucose Homeostasis | 1.80E-02 | 4.9 |
| Q9QUH0 | Glutaredoxin-1 | Hepatocellular energetics | 5.30E-07 | 4.3 |
| P30115 | Glutathione S-transferase A3 | Hepatocellular energetics | 1.10E-03 | 3.4 |
| Q91YI0 | Argininosuccinate lyase (ASAL) (Arginosuccinase) | Urea/TCA cycle | 2.00E-02 | 3.1 |
| Q8R0Y6 | Cytosolic 10-formyltetrahydrofolate dehydrogenase (FDH) | Methyl Donor metabolism | 3.10E-03 | 3.1 |
| O09174 | Alpha-methylacyl-CoA racemase | Lipid Homeostasis | 9.80E-03 | 2.9 |
| Q9JII6 | Alcohol dehydrogenase [NADP(+)] | Hepatocellular energetics | 9.70E-03 | 2.8 |
| Q9QXF8 | Glycine N-methyltransferase | Urea/TCA cycle, Methyl Donor metabolism | 6.90E-03 | 2.8 |
| P16858 | Glyceraldehyde-3-phosphate dehydrogenase (GAPDH) | Glucose Homeostasis, Hepatocellular energetics | 1.40E-02 | 2.6 |
| Q91Y97 | Fructose-bisphosphate aldolase B | Glucose Homeostasis | 1.10E-02 | 2.6 |
| P14152 | Malate dehydrogenase, cytoplasmic | Hepatocellular energetics, TCA cycle | 1.80E-02 | 2.3 |
| Mitochondrial | ||||
| P97807 | Fumarate hydratase, mitochondrial (Fumarase) | Urea/TCA cycle | 1.00E-03 | 4.2 |
| Q9WTP6 | Adenylate kinase 2, mitochondrial (AK 2) | Hepatocellular energetics | 1.00E-04 | 3.5 |
| Q8R4N0 | Citrate lyase subunit beta-like protein, mitochondrial | Glucose Homeostasis | 1.90E-04 | 3.3 |
| P62075 | Mitochondrial import inner membrane translocase Tim13 | Malate aspartate shuttle | 3.90E-02 | 3.1 |
| Q03265 | ATP synthase subunit alpha, mitochondrial | Hepatocellular energetics | 1.00E-04 | 3.1 |
| P05202 | Aspartate aminotransferase, mitochondrial (mAspAT) | Urea/TCA cycle | 4.50E-03 | 2.9 |
| P99029 | Peroxiredoxin-5, mitochondrial (Thioredoxin reductase) | Hepatocellular energetics | 3.20E-03 | 2.8 |
| Q8BH95 | Enoyl-CoA hydratase, mitochondrial (SCEH) | Lipid Homeostasis | 2.70E-02 | 2.6 |
| Protein ID | Refed Iqgap2−/−/Refed Control | p value | FC → | ||
|---|---|---|---|---|---|
| Cytosolic | |||||
| D3YXK2 | Scaffold attachment factor B1 (SAF-B1) | Cellular Transcription | 4.70E-02 | 8 | |
| P09813 | Apolipoprotein A-II (Apo-AII) | Lipid Homeostasis | 3.80E-02 | 5.2 | |
| Q60864 | Stress-induced-phosphoprotein 1 (Hop) | Cellular stress | 8.00E-04 | 2.7 | |
| Q9WUK2 | Eukaryotic translation initiation factor 4H (eIF-4H) | Cellular Transcription | 1.60E-03 | 2.6 | |
| Mitochondrial | |||||
| Q91W43** | Glycine dehydrogenase (Glycine cleavage system P protein) | Methyl Donor metabolism | 2.70E-02 | 6.8 | |
| P52825 | Carnitine O-palmitoyltransferase 2, mitochondrial (CPT II) | Lipid Homeostasis | 6.90E-03 | 5.9 | |
| P56395 | Cytochrome b5 | Hepatocellular energetics | 2.00E-06 | 3.8 | |
| Q91WK5 | Glycine cleavage system H protein, mitochondrial | Methyl Donor metabolism | 1.00E-02 | 2.7 | |
| Q8C196 | Carbamoyl-phosphate synthase [ammonia], mitochondrial | Urea/TCA cycle | 1.80E-04 | 2.7 | |
| Q99LC5 | Electron transfer flavoprotein subunit alpha, mitochondrial (Alpha-ETF) | Hepatocellular energetics | 4.90E-05 | 2.6 | |
| Q9CR68 | Cytochrome b-c1 complex mitochondrial (Complex III subunit 5) | Hepatocellular energetics | 2.40E-02 | 2.6 | |
| Protein ID | Fast Iqgap2−/−/Refed Iqgap2−/− | p value | FC → | |
|---|---|---|---|---|
| Cytosolic | ||||
| Q60648 | Ganglioside GM2 activator | Lipid Homeostasis | 1.50E-04 | 6.5 |
| P54869 | Hydroxymethylglutaryl-CoA synthase, mitochondrial (HMG-CoA synthase) | Lipid Homeostasis | 5.70E-06 | 6.1 |
| P19639 | Glutathione S-transferase Mu 3 | Hepatocellular energetics | 2.10E-02 | 3.7 |
| P70699 | Lysosomal alpha-glucosidase (Acid maltase) | Glucose Homeostasis | 7.10E-03 | 2.9 |
| Mitochondrial | ||||
| Q8BGD8 | Cytochrome c oxidase assembly factor 6 homolog | Hepatocellular energetics | 9.80E-05 | 5.6 |
| Q05920 | Pyruvate carboxylase, mitochondrial | Glucose Homeostasos. TCA Cycle | 4.30E-03 | 4.5 |
| Q8BKZ9 | Pyruvate dehydrogenase protein X component. Mitochondrial | Glucose Homeostasis, TCA cycle | 3.80E-03 | 3.6 |
| O09174 | Alpha-methylacyl-CoA racemase | Lipid Homeostasis | 1.70E-03 | 3.2 |
A list of critical metabolic proteins which showed significant (P-value ≤ 0.05) fold changes (FC) in Iqgap2−/− mice (Fast or Refed) as compared to their respective age-matched control mice (Fast or Refed), as calculated by the Spectral Indexing (SIN) methods of quantitation. Two proteins (Q8QZR5 & Q91W43) with Uniprot accession number marked with ** showed more than 6-fold change and were retained in the analysis despite of being detected in fewer than 6 LC-MS/MS runs per sample.
Proteomics metabolomics correlation
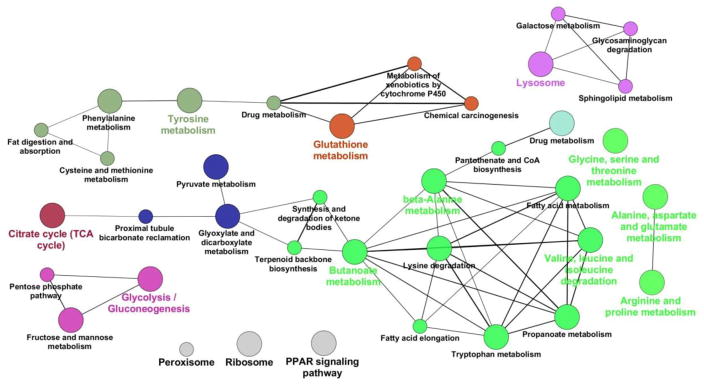
Since IQGAP2 is primarily expressed in the liver, we profiled the hepatic proteome and metabolome to examine phenotypic changes of IQGAP2 deficiency. Accordingly hepatic proteome and metabolome analyses were done on 1iver tissues from 18hr fast/refed Iqgap2−/− and control mice. Table 1 shows a list of metabolic proteins critical to major biochemical pathways distributed in the cytosol and mitochondria showing ≥ 2.5-fold differential expression that helped to explain the Iqgap2−/− phenotype. A complete list of identified proteins with statistically significant differential abundance levels (P<0.05) is given in the Supplemental Table S3. Critical proteins were validated by immunoblots (Supplemental Figure S4a) and quantified (Supplemental Figure S4b). A total of 176 proteins were showed statistically significant (P<0.05) altered levels with 91, 48, and 72 proteins showing ± 2.5-fold changed levels in the fasted Iqgap2−/− compared to the fasted control, refed Iqgap2−/− compared to refed control, and in the fasted Iqgap2−/− compared to the refed Iqgap2−/−, respectively [Supplemental Table S3]. Several of these proteins include known IQGAP-related proteins involved in cytoskeleton, motility and proliferation. Proteins with critical enzyme functions regulating major metabolic pathways governing fuel homeostasis, including glycolysis, gluconogenesis, lipogenesis and cellular stress response pathways mostly showed increased levels. Nuclear proteins, RNA binding proteins, calcium binding proteins and major urinary proteins all showed decreased levels. Pathways were enriched using Benjamini-Hochberg corrected P-value cut off of ≤0.05 for significance. A cytoscape image for the KEGG pathways of all statistically significant proteins (± 2.5-fold change) in the fasted and refed comparisons were colored according to overlapping terms (proteins shared by related KEGG groups) and node size based on adjusted p-value for enrichment [43], is summarized in Figure 5 and the list of proteins that map to each node is given as Supplemental Table S3b. The combination of differential protein levels given with respective metabolic intermediate levels and flux can help explain the IQGAP2 deficient metabolic compensations to maintain cellular homeostasis as follows.
Figure 5.

The Cytoscape ClueGO plugin was used to identify enriched KEGG pathways amongst all statistically significant proteins in the fasted and refed comparisons. Nodes containing proteins from related KEGG terms are colored the same, with node size indicating the associated Benjamini-Hochberg corrected p-value for enrichment (smaller p-values are indicated by larger node size), and line width indicating the level of overlap between related nodes (thicker lines indicate a greater overlap).
Proteome of impaired glucose homeostasis
IQGAP2 deficiency results in increased glycolytic intermediates (Figure 2) and amino acids (Supplemental Figure S2) during 18 hr fast. As seen from Table 1, glycolytic enzymes that were elevated in the fasted Iqgap2−/− compared to the fasted control include fructose-bisphosphate aldolase B (2.6-fold increase), glyceraldehyde-3-phosphate dehydrogenase (GAPDH) (2.6-fold increase), (R/L) pyruvate kinase (PK) (4.9-fold increase). Since the plasma levels of serine and glycine (gluconeogenic amino acids) from Iqgap2−/− mice exhibited changes in the opposite directions as discussed before with the 2-fold increased levels of serine (Supplemental Figure S2), we anticipated an increase in the levels of serine hydroxymethyltransferase (Shmt1) which is involved in the synthesis of serine from glycine. Our proteomics data identified > 5 peptides of Shmt1 and showed an increase of 1.6-fold (nominal P-value = 0.16) by spectral counting method in the fasted Iqgap2−/− mice as compared to their fasted controls (Supplemental Table S4). Peptide level MS1 intensity quantitation using the 5 identified peptides of Shmt1 showed an average increase of ~ 2.8-fold with nominal P-values ranging from <0.05 to >0.15. Although the P-values (>0.05) corresponding to these fold changes were high, the observed increase in Shmt1 enzyme is consistent with the changes in serine and glycine levels. Also mitochondrial citrate lyase subunit beta-like protein (3.3-fold increase) was elevated during 18hr fast in Iqgap2−/− livers. Such proteomic changes were also directly corroborated by metabolites changes respectively in Iqgap2−/− livers. For example increased level of aldolase B was reflected by increase in DHAP levels, and pyruvate kinase by pyruvate levels. Concentrations of glycolytic intermediates are affected by glucose influx and efflux. Glucose influx into the glucose-6-phosphate pool includes glucose uptake and phosphorylation, gluconeogenesis and glycogenolysis. Glucose efflux includes glycogen synthesis, pentose cycle and TCA cycle. The initial step for pyruvate to enter the TCA cycle is through pyruvate dehydrogenase action. Mitochondrial pyruvate dehydrogenase protein X component (PDH) regulates pyruvate oxidation to acetyl CoA (glucose oxidation and fatty acid synthesis); while pyruvate carboxylase (PC) regulates anaplerosis (gluconeogenesis) respectively. Both the enzymes were identified to be simultaneously increased (4.5-fold increase for PC and 3.6-fold increase for PDH) only in fasted Iqgap2−/− mice but not in control mice (see supplemental notes for detailed description). The observed increase in levels of the mitochondrial citrate lyase subunit beta-like protein in Iqgap2−/− livers may be important for cleaving citrate to oxaloacetate and acetyl CoA in Iqgap2−/− livers. Hepatic metabolite measurements indicating significant increases in intermediates common for glycolysis and gluconeogenesis such as fructose-6-phosphate and 3 phospho glycerate, PEP, pyruvate, citrate (Figure 2) and acetyl CoA (Figure 4b) in Iqgap2−/− liver during the 18hr fast corroborates the proteomic observations. The results are also supportive of increased glucose carbon recycling and illustrate the aberrant regulation of glucose metabolism in Iqgap2−/− livers. It is possible that in Iqgap2−/− livers, increased acetyl CoA (Figure 4b) can be transported to cytosol via the acetoacetate shuttle leading to increased de novo lipogenesis (Figure 4c) that impaired lipid homeostasis in Iqgap2−/− mice as discussed below.
Proteome of altered lipid homeostasis
Several critical proteins pertaining to lipid metabolism showed increased levels (Table 1). Aldolase B, lysosomal ganglioside GM2 activator (GM2AP) and peroxisomal alpha methyl acyl coA racemase (AMACR) were increased in 18hr fasted Iqgap2−/− mice compared to fasted control. Apolipoprotein A-II (apoA-II) was increased in refed Iqgap2−/− mice compared to refed control. AMACR, and HMG-CoA synthase were increased in 18hr fasted Iqgap2−/− mice compared to fasted control mice. Also, immunoblots (Supplemental Figure S5) confirmed increased levels of major enzymes [acetyl CoA carboxylase (ACC), fatty acid synthase (FAS), ATP citrate lyase, DGAT1] involved in lipogenesis suggesting aberrant channeling of glycolytic flux to an increased lipid synthesis. TLC for lipids (Supplemental Figure S6) confirmed accumulation of triglycerides in Iqgap2−/− livers both during fast and refed states. Increased lipogenic precursor metabolites dihydroxyacetone -P (DHAP), α-glycero-P (Figure 2), pentose intermediates and acetyl CoA (Figure 4) that are critical for de novo lipogenesis and triglyceride synthesis support our proteome observation. Changes in proteins pertaining to peroxisomal function were also observed. The 3-fold increase in peroxisomal β-oxidative AMACR observed in Iqgap2−/− compared to control mice might be associated with increased oxidation of branched chain fatty acids in these mice, the products of which have carcinogenic potential [44]. Lysosomal GM2AP is an adipokine that binds and transports a broad spectrum of lipids including phosphatidylcholine; serum levels of GM2AP is found to be increased in obese mice, human and is implicated with hepatic and pancreatic dysfunction through impairment of insulin signaling [45]. Given Iqgap2−/− mice are obese, the observed increase GM2AP suggests altered phospholipid metabolism with IQGAP2 deficiency. A 6-fold increase in HMG-CoA synthase which catalyses the formation HMG-CoA, a critical substrate in cholesterol biosynthesis reflects abnormal regulation of cholesterogenesis in Iqgap2−/− livers.
Proteome of urea/TCA cycle metabolism
Urea is the principal end-product of protein metabolism in mammals. Urea cycle is inextricably intertwined to TCA cycle and spans both mitochondrial and cytosolic compartments. Mitochondrial carbamoyl-phosphate synthase catalyzing the first committed step in urea synthesis was increased (2.7- fold) in Iqgap2−/− mice during the refed state. Cytosolic arginosuccinase, the enzyme catalyzing the third step of the urea cycle cleaving arginosuccinate to fumarate and arginine indicated a 3.1- fold increase during 18hr fast in Iqgap2−/− mice. Fumarate and aspartate link urea cycle and TCA cycle through transamination of oxaloacetate (OAA) an important gluconeogenic precursor and TCA intermediate. Interestingly, the respective enzymes fumarase (4.7- fold increase), and mitochondrial aspartate aminotransferase (mAspAT) (2.9-fold increase) both showed altered levels during 18hr fast in Iqgap2−/− livers. Glycine N-methyltransferase is found predominantly in periportal cells which is the major site of gluconeogenesis, methyl-donor formation and urea biosynthesis [46]. Glycine N-methyltransferase, also showed 2.7-fold increase with IQGAP2 deficiency during 18hr fast. Increased levels of glycine N-methyltransferase and urea cycle enzymes indicate active metabolism in Iqgap2−/− livers to effectively remove ammonia resulting from increased gluconeogenesis. Also, alanine amino transaminase (ALT) which catalyzes the reversible transamination of alanine to pyruvate demonstrated a 6.6- fold increase during the 18hr fast with IQGAP2 deficiency. Increase of ALT was reflected by decreased hepatic alanine levels (Supplemental Table S5) and concomitantly increased hepatic pyruvate (Figure 2) levels. Thus these results strongly corroborated and support increased gluconeogenesis from amino acids with IQGAP2 deficiency.
Proteome of impaired hepatocellular energetics
As seen from Table 1 i) Critical cytosolic dehydrogenases [GAPDH, malate dehydrogenase (MDH) and alchohol dehydrogenase (ADH)], ii) redox proteins (glutaredoxin-1, glutathione –s-transferease and peroxiredoxin-5, thiredoxin reductase), iii) proteins associated with malate-aspartate shutte (MAS) namely the inner mitochondrial translocase protein TIM13, mitochondrial aspartate aminotransferase, fumarate hydratase; iv) proteins associated with mitochondrial ATP production namely mitochondrial adenylate kinase 2, (AK2) and ATP synthase subunit α (complex V) were found to be increased during the 18hr fast in Iqgap2−/− mice. Interestingly AMP was also increased in found to be increased in Iqgap2−/− mice compared to controls (Figure 2a). Electron carrier proteins from electron transport chain [(cytochromes b5, C-III) and electron transfer flavoprotein] were found to be increased during the refed state in Iqgap2−/− livers compared to the refed control. Antioxidant metabolites (Supplemental Figure S7) hypotaurine, ascorbic acid and glutathione were decreased in Iqgap2−/− mice. Also, Iqgap2−/− mice demonstrated a 3-fold increase in TIM13 the inner mitochondrial translocase protein which regulates the mitochondrial aspartate/glutamate carriers (AGC) [47]; AGC plays key role in transferring the cytosolic NADH to mitochondrial matrix. Mitochondrial malate-aspartate shuttle, a primary cytoplasmic NADH electron shuttle [48], is activated by high cytosolic NADH. Thus observed hepatic increases of critical cytosolic dehydrogenases and increases in proteins linked to the malate-aspartate shuttle suggests augmentation of the shuttle and are signs of compromised redox equilibrium between cytosol and mitochondria in Iqgap2−/− mice.
Discussion
Signaling pathways and metabolic pathways constitute the cellular metabolic network. They work by the rule of balance of flux [49]. A balance between phosphorylation and dephosphorylation of signaling molecules, and between metabolites turnover is required to maintain cellular homeostasis. We present evidence that signaling pathways and metabolic pathways are highly integrated, by demonstrating that interruption of protein scaffolding in the Iqgap2−/− mice has significant impact on the metabolic network as reflected by the proteomic and metabolomic changes in the cytosolic and mitochondrial compartments. The scaffolding and tumor-suppressor protein IQGAP2 primarily expressed in liver is a PKA substrate and binds AKAP220, the featured anchoring protein in protein kinase A and GSK3β signaling. Proteomics changes corroborated by the observed metabolomic and flux changes in our study, demonstrated profound alterations in hepatic intermediary metabolism with IQGAP2 deficiency. Our integrative approach, lets us infer that IQGAP2 deficiency results in loss of reciprocal regulation of glycolysis/gluconeogenesis, metabolic inflexibility, and obesity which are common etiological factors for predisposition to diabetes and hepatocelluar carcinoma. Since phosphorylation of the bi-functional enzyme (6-phosphofructo-2-kinase/fructose 2,6–bisphosphatase [FK2/FBP2]) by PKA triggers the major switch between glycolysis and gluconeogenesis [50], erroneous hepatic regulations of PKA signaling regulated metabolic pathways [51, 52] in Iqgap2−/− mice implicates a putative role for IQGAP2 in cAMP-PKA signaling.
IQGAP2 deficiency and Diabetes
Insulin resistance, lipid accumulation, mitochondrial dysfunction and metabolic inflexibility have been implicated in the etiology of type 2 diabetes [53]. Increased hepatic glucose cycling has been associated with hyperglycemica [54] chronic persistence of which disrupts insulin-stimulated glucose utilization leading to insulin resistance [55]. Iqgap2−/− mice demonstrated higher plasma insulin levels with either higher or comparable glucose levels. This indicates a prevailing degree of insulin resistance with IQGAP2 deficiency. Employing stable isotope glucose analyses (SiGTT and mass isotopomers (m1/Σm+m2/Σm+m3/Σm) of glucose) in our study we show that IQGAP2 deficiency leads to increased hepatic glucose recycling and gluconeogenesis that contributed to hyperglycemia in Iqgap2−/− mice. Based on proteomics results, it can be deduced that the seemingly parallel inductions of glucose oxidizing (PK, PDH) and glucose synthesizing (gluconeogenic) enzymes (PC), also corroborated by increased levels of the respective metabolites (pyruvate, acetyl coA, PEP) contributed to futile glucose carbon cycling seen in Iqgap2−/− mice. PC a major anaplerotic enzyme, catalyzes the formation of the gluconeogenic intermediate oxaloacetate from pyruvate. PC was increased 4.5-fold in Iqgap2−/− livers. Enhanced urea cycle activity observed in Iqgap2−/− livers during the 18hr fast, confirms the high anaplerotic flux linked to increased gluconeogenesis. Increased anaplerotic flux redirects the TCA intermediate citrate towards lipid synthesis. Mitochondrial citrate lyase beta like protein that can cleave citrate to oxaloacetate and acetyl CoA was seen to be increased Iqgap2−/− livers. Acetyl CoA was also increased in Iqgap2−/− livers. It has been shown that formation of acetoacetate in the mitochondria and its utilization in the cytosol is a secondary pathway of acetyl group translocation operating concurrently with the predominant citrate cleavage pathway [56] and mitochondrial acetyl-CoA contributes about 36% to de novo lipogenesis [57]. Since plasma levels of β-OH butyrate in Iqgap2−/− mice were decreased despite increased fatty acid oxidation, it can be speculated that excess mitochondrial acetyl CoA formed in Iqgap2−/− liver fueled mitochondrial steroid synthesis or got shuttled to cytosol (acetoacetate shuttle/carnitine shuttle) to fuel de novo cholesterol and fatty acid synthesis.
Since we observed that glycogenolysis was impaired in Iqgap2−/− mice, consequential use of glucogenic amino acids to feed pyruvate (gluconeogenesis), and lipid synthesis accelerates protein turnover, resulting in increased lipid accumulation and obesity. Both proteomic and metabolomic results in our study confirms abnormal regulation of lipid homeostasis in Iqgap2−/− mice. We found critical enzymes from lipid metabolism, lipogenic metabolites like α-glycero phosphate, acetyl CoA and pentose intermediates all to be significantly increased in Iqgap2−/− livers. We also demonstrated that de novo lipogenesis was increased with IQGAP2 deficiency. TLC results confirmed increased accumulation of lipids in both liver and muscle of Iqgap2−/− mice. A truncated TCA cycle impacts the overall function of the cycle resulting in incomplete oxidation of substrates [58]. Hepatic accumulation of lipids also leads to TCA overload, incomplete/excessive oxidation of fatty acids and eventual accumulation of ROS linked to mitochondrial dysfunction [59]. We observed increases in apoA-II and peroxisomal alpha-methyl coA racemase (AMACR) in Iqgap2−/− livers during fasting. The apolipoprotein apoA-II is a major protein constituent of HDL cholesterol and is known to modulate cellular cholesterol efflux [60]. Over expression of mouse apoA-II has been shown to induce fatty lesions even on a chow diet through alterations in oxidized lipoprotein metabolism and induction of inflammation [61]. AMACR is a peroxisomal and mitochondrial enzyme involved in the β-oxidation of branched fatty acids. AMACR has been recently identified as a cancer biomarker [62] with a mechanism involving FXR and PPAR activity and expression of cyclooxygenase-2 (COX-2). Peroxisomes play a specialized role in the metabolism of VLCFAs, long-chain dicarboxylic acids, branched-chain fatty acids, eicosanoids, and bile acids which both generates and scavenges lipid peroxides involved in the oxygen radical homeostasis [63]. Thus increases in apoA-II and AMACR seen in Iqgap2−/− mice may suggest oxidative degradation of lipids sources for lipid peroxides which can severely impact mitochondrial function. Obesity combined with oxidized lipid species compromises mitochondrial function through nonspecific modification of proteins, lipids, and nucleic acids [64]. Impaired mitochondrial function may be a primary cause for metabolic inflexibility [53, 65]. Indirect calorimetry results from our study clearly indicated that Iqgap2−/− mice were metabolically inflexible during the fast to refed transition. Iqgap2−/− mice were unable to switch from fat to carbohydrate oxidation as seen from the lower RER during the refed period.
The results presented so far highlight that IQGAP2 deficiency presented with metabolic dysregulations that underlie the pathology associated with the development of diabetes. Most of these metabolic alterations share commonalties with metabolic reprogramming during carcinogenesis. Chronic hyperinsulinemia results and leads to a chain of metabolic responses, including changes in insulin and IGF binding proteins which play a key role in cell growth and differentiation[66]. Also obesity is considered a major risk factor for cancer [67]. Alterations in glycolytic flux, truncated TCA cycle, shunting of glucose-derived carbon for macromolecular synthesis, increased de novo lipogenesis are hallmarks for cancer metabolism [58]. We discuss the IQGAP2 deficient proteomic and metabolomic changes in the following section that might predispose to the development of HCC in light of hyperinsulinemia and obesity seen in Iqgap2−/− mice.
IQGAP2 deficiency and Cancer
M2-PK is characteristic isoform of pyruvate kinase expressed in highly proliferative cells, and, a shift in the isoenzyme composition takes place such that the tissue specific isoenzyme, or L-PK in the liver, disappears and M2-PK is expressed during tumor formation [68]. Interestingly, we detected increased levels of both regular (R/L) and M2-PK isoforms of pyruvate kinase in Iqgap2−/− mice (see supplemental notes and Supplemental Figure S8, Supplemental Table S4) in our study. We also detected increased levels of critical enzymes from glycine cleavage system (H and P proteins) in Iqgap2−/− livers. The observation was reflected by significantly altered plasma fast and fast/refed ratios for serine (increased) and glycine (decreased) that suggests glycine consumption, characteristic feature for both cancer and rapidly proliferating non-cancer cells for nucleotide synthesis [69]. Also 3-phosphoglycerate a critical intermediate at the branch point of glycolysis and serine biosynthesis was found to be also significantly increased in Iqgap2−/− livers during fasting. We also detected increased levels of glycine methyl transferase and 10-formyltetrahydrofolate dehydrogenase which are enzymes involved in methyl group and folate metabolism important for nucleotide biosynthesis. The proteomics results suggesting metabolism favoring nucleotide synthesis in 18hr fast Iqgap2−/− livers was supported by the observation of significantly increased pentose intermediates critical for de novo purine biosynthesis. Thus these results strongly presage a hepatic environment conducive for cell proliferation with IQGAP2 deficiency.
Increased levels of critical redox-related ROS quenching enzymes (thioredoxins), enzymes from oxidative lipid metabolism (discussed earlier), antioxidant enzymes from glutathione metabolism (Table 1) and decreased antioxidant metabolites observed in our study is suggestive of deteriorating mitochondrial function. Studies have previously shown that adenylate kinase 2 (AK2), isoform of adenylate kinase present in the mitochondrial inter membrane space, can meet cellular ATP demands under conditions of diminished oxidative phosphorylation [70]. Also, oxidative stress can lead to elevated levels of mitochondrial transcription factors or other proteins of oxidative-phosphorylation [71, 72]. We found that Iqgap2−/− mice demonstrated more than 3-fold increases in AK2 and complex V (ATP synthase α-subunit) during the 18hr fast; mitochondrial proteins from OXPHOS machinery namely cytochromes (b5, complex III), were increased by 2.5-fold during the refed experiments, suggesting an increased cellular demand for ATP. Re-direction of glycolytic carbons towards lipogenesis, and increased pentose flux towards biosynthesis with IQGAP2 deficiency drives a Warburg-like metabolism and aides cell proliferation. Warburg effect is characterized by aerobic glycolysis through increased pentose cycle activity, and increased anaplerosis in the mitochondria. These features enable cancer cells to increase macromolecules synthesis and proliferation. Thus persistence of futile substrate cycling can make Iqgap2−/− livers susceptible to ‘hypoxia’ a late occurring cellular event known to promote neoplastic transformation [73].
Conclusion
Our study highlights the importance of scaffolding proteins like IQGAP2 in cellular intermediary metabolism. Using an integrative approach we were able to demonstrate that IQGAP2 deficiency in liver leads to altered balance of flux (homeostasis) in glucose and protein metabolism that predispose to the development of hepatocellular carcinoma and diabetes. Whilst metabolomics and proteomics measurements in our study, clearly demonstrate that Iqgap2−/− mice exhibit significant changes in homeostatic states compared with controls; how exactly these changes come about warrants further studies with precise assessments of metabolite and protein turnover rates using specific tracers. Protein scaffolds are crucial for retaining the specificity of cellular signaling through temporal control and spatial fidelity of various proteins involved [74]. IQGAP2 is a multi-domain, scaffolding protein, a PKA substrate and plays a critical role in actin dynamics and cytoskeletal regulation [2]. Previous evidence supports the notion that the cytoskeleton is a ‘metabolic sensor’ which integrates and regulates activity of metabolic enzymes through enzyme-cytoskeleton interactions [75–78]. Our studies have demonstrated that IQGAP2 deficiency resulted in alterations in metabolic networks that compromise cellular homeostasis. It can be speculated that dysregulated cytoskeletal dynamics combined with aberrant spatial fidelity of PKA signaling contributed to IQGAP2 deficient metabolic phenotype. For example the glycolytic enzyme fructose bisphosphate aldolase which was observed to be increased by 2.6-fold in Iqgap2−/− livers in our study, has been shown to bind F-actin [79, 80] which is critical for localizing and proper compartmentalization of aldolase. On these lines it would be interesting to investigate whether the changes in glycolysis observed in Iqgap2−/− mice are due altered reorganization of cytoskeleton. Further in-depth signaling and protein-protein interaction studies would confirm the direct involvement of IQGAP2. The dual metabolic/tumorigenic function together with its scaffolding function makes IQGAP2 a potential protein linking etiology of carcinogenesis and diabetes. Understanding of the specific action of IQGAP2 on metabolic pathways may provide rational therapeutic targets for the treatment and prevention of cancer and diabetes.
Supplementary Material
Acknowledgments
Authors would sincerely like to thank Dr. Schmidt VA (SUNY, Stony Brook) for the kind gift of Iqgap2−/− mice for the study. Proteome research efforts (J.E.B, A.N, C.Z) were supported by grants 5R01GM086688, 1U19AI10777, 5R01AI101307, AND 5R01HL110879. I.J.K., was supported by DK58132-01A2 and Diabetes Research and Training Center (DRTC), NIH grant P60DK020541, I.J.K and C.G were supported by NIAID grant U19AI091175-01. L.W.N.P was supported by the biomedical mass spectrometry laboratory at Harbor-UCLA, partly supported by the Clinical and Translational Science Institute at UCLA (UL1 TR000124) and the Center of Excellence for Pancreatic Diseases (PO1 AT00396).
References
- 1.Brandt DT, Grosse R. Get to grips: steering local actin dynamics with IQGAPs. EMBO Rep. 2007;8(11):1019–23. doi: 10.1038/sj.embor.7401089. [DOI] [PMC free article] [PubMed] [Google Scholar]
- 2.Shannon KB. IQGAP Family Members in Yeast, Dictyostelium, and Mammalian Cells. Int J Cell Biol. 2012;2012:894817. doi: 10.1155/2012/894817. [DOI] [PMC free article] [PubMed] [Google Scholar]
- 3.Briggs MW, Sacks DB. IQGAP proteins are integral components of cytoskeletal regulation. EMBO Rep. 2003;4(6):571–4. doi: 10.1038/sj.embor.embor867. [DOI] [PMC free article] [PubMed] [Google Scholar]
- 4.Kuroda S, et al. Identification of IQGAP as a putative target for the small GTPases, Cdc42 and Rac1. J Biol Chem. 1996;271(38):23363–7. doi: 10.1074/jbc.271.38.23363. [DOI] [PubMed] [Google Scholar]
- 5.McCallum SJ, Erickson JW, Cerione RA. Characterization of the association of the actin-binding protein, IQGAP, and activated Cdc42 with Golgi membranes. J Biol Chem. 1998;273(35):22537–44. doi: 10.1074/jbc.273.35.22537. [DOI] [PubMed] [Google Scholar]
- 6.Wang S, et al. IQGAP3, a novel effector of Rac1 and Cdc42, regulates neurite outgrowth. J Cell Sci. 2007;120(Pt 4):567–77. doi: 10.1242/jcs.03356. [DOI] [PubMed] [Google Scholar]
- 7.Erickson JW, Cerione RA, Hart MJ. Identification of an actin cytoskeletal complex that includes IQGAP and the Cdc42 GTPase. J Biol Chem. 1997;272(39):24443–7. doi: 10.1074/jbc.272.39.24443. [DOI] [PubMed] [Google Scholar]
- 8.Brill S, et al. The Ras GTPase-activating-protein-related human protein IQGAP2 harbors a potential actin binding domain and interacts with calmodulin and Rho family GTPases. Mol Cell Biol. 1996;16(9):4869–78. doi: 10.1128/mcb.16.9.4869. [DOI] [PMC free article] [PubMed] [Google Scholar]
- 9.Wu C, et al. BioGPS: an extensible and customizable portal for querying and organizing gene annotation resources. Genome Biol. 2009;10(11):R130. doi: 10.1186/gb-2009-10-11-r130. [DOI] [PMC free article] [PubMed] [Google Scholar]
- 10.White CD, Brown MD, Sacks DB. IQGAPs in cancer: a family of scaffold proteins underlying tumorigenesis. FEBS Lett. 2009;583(12):1817–24. doi: 10.1016/j.febslet.2009.05.007. [DOI] [PMC free article] [PubMed] [Google Scholar]
- 11.Schmidt VA. Watch the GAP: Emerging Roles for IQ Motif-Containing GTPase-Activating Proteins IQGAPs in Hepatocellular Carcinoma. Int J Hepatol. 2012;2012:958673. doi: 10.1155/2012/958673. [DOI] [PMC free article] [PubMed] [Google Scholar]
- 12.Schmidt VA, et al. Development of hepatocellular carcinoma in Iqgap2-deficient mice is IQGAP1 dependent. Mol Cell Biol. 2008;28(5):1489–502. doi: 10.1128/MCB.01090-07. [DOI] [PMC free article] [PubMed] [Google Scholar]
- 13.Xie Y, et al. IQGAP2, A candidate tumour suppressor of prostate tumorigenesis. Biochim Biophys Acta. 2012;1822(6):875–84. doi: 10.1016/j.bbadis.2012.02.019. [DOI] [PubMed] [Google Scholar]
- 14.Schmidt VA, et al. IQGAP2 functions as a GTP-dependent effector protein in thrombin-induced platelet cytoskeletal reorganization. Blood. 2003;101(8):3021–8. doi: 10.1182/blood-2002-09-2807. [DOI] [PubMed] [Google Scholar]
- 15.Lee YY, et al. Subcellular tissue proteomics of hepatocellular carcinoma for molecular signature discovery. J Proteome Res. 2011;10(11):5070–83. doi: 10.1021/pr2005204. [DOI] [PubMed] [Google Scholar]
- 16.Sacks DB. The role of scaffold proteins in MEK/ERK signalling. Biochem Soc Trans. 2006;34(Pt 5):833–6. doi: 10.1042/BST0340833. [DOI] [PubMed] [Google Scholar]
- 17.Chiariello CS, et al. Ablation of Iqgap2 protects from diet-induced hepatic steatosis due to impaired fatty acid uptake. Regul Pept. 2012;173(1–3):36–46. doi: 10.1016/j.regpep.2011.09.003. [DOI] [PMC free article] [PubMed] [Google Scholar]
- 18.Bratanova-Tochkova TK, et al. Triggering and augmentation mechanisms, granule pools, and biphasic insulin secretion. Diabetes. 2002;51(Suppl 1):S83–90. doi: 10.2337/diabetes.51.2007.s83. [DOI] [PubMed] [Google Scholar]
- 19.Tomlinson S, Walker SW, Brown BL. Calmodulin and insulin secretion. Diabetologia. 1982;22(1):1–5. doi: 10.1007/BF00253860. [DOI] [PubMed] [Google Scholar]
- 20.Valverde I, et al. Calmodulin activation of adenylate cyclase in pancreatic islets. Science. 1979;206(4415):225–7. doi: 10.1126/science.225798. [DOI] [PubMed] [Google Scholar]
- 21.Atcheson E, et al. IQ-motif selectivity in human IQGAP2 and IQGAP3: binding of calmodulin and myosin essential light chain. Biosci Rep. 2011 doi: 10.1042/BSR20100123. [DOI] [PMC free article] [PubMed] [Google Scholar]
- 22.Pathmanathan S, et al. The interaction of IQGAPs with calmodulin-like proteins. Biochem Soc Trans. 2011;39(2):694–9. doi: 10.1042/BST0390694. [DOI] [PubMed] [Google Scholar]
- 23.Logue JS, et al. Anchored protein kinase A recruitment of active Rac GTPase. J Biol Chem. 2011;286(25):22113–21. doi: 10.1074/jbc.M111.232660. [DOI] [PMC free article] [PubMed] [Google Scholar]
- 24.Hinke SA, et al. Anchored phosphatases modulate glucose homeostasis. EMBO J. 2012;31(20):3991–4004. doi: 10.1038/emboj.2012.244. [DOI] [PMC free article] [PubMed] [Google Scholar]
- 25.Xu J, et al. Peroxisome proliferator-activated receptor alpha (PPARalpha) influences substrate utilization for hepatic glucose production. J Biol Chem. 2002;277(52):50237–44. doi: 10.1074/jbc.M201208200. [DOI] [PubMed] [Google Scholar]
- 26.Xu J, et al. Determination of a glucose-dependent futile recycling rate constant from an intraperitoneal glucose tolerance test. Anal Biochem. 2003;315(2):238–46. doi: 10.1016/s0003-2697(02)00709-1. [DOI] [PubMed] [Google Scholar]
- 27.Vaitheesvaran B, et al. Advantages of dynamic “closed loop” stable isotope flux phenotyping over static “open loop” clamps in detecting silent genetic and dietary phenotypes. Metabolomics. 2010;6(2):180–190. doi: 10.1007/s11306-009-0190-2. [DOI] [PMC free article] [PubMed] [Google Scholar]
- 28.Lee WN, et al. In vivo measurement of fatty acids and cholesterol synthesis using D2O and mass isotopomer analysis. Am J Physiol. 1994;266(5 Pt 1):E699–708. doi: 10.1152/ajpendo.1994.266.5.E699. [DOI] [PubMed] [Google Scholar]
- 29.Brunengraber DZ, et al. Influence of diet on the modeling of adipose tissue triglycerides during growth. Am J Physiol Endocrinol Metab. 2003;285(4):E917–25. doi: 10.1152/ajpendo.00128.2003. [DOI] [PubMed] [Google Scholar]
- 30.Roessner U, et al. Technical advance: simultaneous analysis of metabolites in potato tuber by gas chromatography-mass spectrometry. Plant J. 2000;23(1):131–42. doi: 10.1046/j.1365-313x.2000.00774.x. [DOI] [PubMed] [Google Scholar]
- 31.Kind T, et al. FiehnLib: mass spectral and retention index libraries for metabolomics based on quadrupole and time-of-flight gas chromatography/mass spectrometry. Anal Chem. 2009;81(24):10038–48. doi: 10.1021/ac9019522. [DOI] [PMC free article] [PubMed] [Google Scholar]
- 32.Ghoshal AK, et al. Rapid measurement of plasma acylcarnitines by liquid chromatography-tandem mass spectrometry without derivatization. Clinica chimica acta; international journal of clinical chemistry. 2005;358(1–2):104–12. doi: 10.1016/j.cccn.2005.02.011. [DOI] [PubMed] [Google Scholar]
- 33.Gilibili RR, et al. Development and validation of a highly sensitive LC-MS/MS method for simultaneous quantitation of acetyl-CoA and malonyl-CoA in animal tissues. Biomed Chromatogr. 2011;25(12):1352–9. doi: 10.1002/bmc.1608. [DOI] [PubMed] [Google Scholar]
- 34.Vaitheesvaran B, et al. Peripheral effects of FAAH deficiency on fuel and energy homeostasis: role of dysregulated lysine acetylation. PLoS One. 2012;7(3):e33717. doi: 10.1371/journal.pone.0033717. [DOI] [PMC free article] [PubMed] [Google Scholar]
- 35.Vaitheesvaran B, Leroith D, Kurland IJ. MKR mice have increased dynamic glucose disposal despite metabolic inflexibility, and hepatic and peripheral insulin insensitivity. Diabetologia. 2010 doi: 10.1007/s00125-010-1827-4. [DOI] [PMC free article] [PubMed] [Google Scholar]
- 36.Weisbrod CR, et al. Performance evaluation of a dual linear ion trap-Fourier transform ion cyclotron resonance mass spectrometer for proteomics research. J Proteomics. 2013 doi: 10.1016/j.jprot.2013.04.009. [DOI] [PMC free article] [PubMed] [Google Scholar]
- 37.Park CY, et al. Rapid and accurate peptide identification from tandem mass spectra. J Proteome Res. 2008;7(7):3022–7. doi: 10.1021/pr800127y. [DOI] [PMC free article] [PubMed] [Google Scholar]
- 38.Griffin NM, et al. Label-free, normalized quantification of complex mass spectrometry data for proteomic analysis. Nat Biotechnol. 2010;28(1):83–9. doi: 10.1038/nbt.1592. [DOI] [PMC free article] [PubMed] [Google Scholar]
- 39.Keller A, et al. Empirical statistical model to estimate the accuracy of peptide identifications made by MS/MS and database search. Anal Chem. 2002;74(20):5383–92. doi: 10.1021/ac025747h. [DOI] [PubMed] [Google Scholar]
- 40.Lee WN, Sorou S, Bergner EA. Glucose isotope, carbon recycling, and gluconeogenesis using [U-13C]glucose and mass isotopomer analysis. Biochem Med Metab Biol. 1991;45(3):298–309. doi: 10.1016/0885-4505(91)90034-i. [DOI] [PubMed] [Google Scholar]
- 41.Lee WN, Bergner EA, Guo ZK. Mass isotopomer pattern and precursor-product relationship. Biol Mass Spectrom. 1992;21(2):114–22. doi: 10.1002/bms.1200210210. [DOI] [PubMed] [Google Scholar]
- 42.Owen OE, Kalhan SC, Hanson RW. The key role of anaplerosis and cataplerosis for citric acid cycle function. J Biol Chem. 2002;277(34):30409–12. doi: 10.1074/jbc.R200006200. [DOI] [PubMed] [Google Scholar]
- 43.Bindea G, et al. ClueGO: a Cytoscape plug-in to decipher functionally grouped gene ontology and pathway annotation networks. Bioinformatics. 2009;25(8):1091–3. doi: 10.1093/bioinformatics/btp101. [DOI] [PMC free article] [PubMed] [Google Scholar]
- 44.Lloyd MD, et al. α-Methylacyl-CoA racemase – an ‘obscure’ metabolic enzyme takes centre stage. FEBS Journal. 2008;275(6):1089–1102. doi: 10.1111/j.1742-4658.2008.06290.x. [DOI] [PubMed] [Google Scholar]
- 45.Higashi K, et al. Adipokine ganglioside GM2 activator protein stimulates insulin secretion. FEBS Letters. 2011;585(16):2587–2591. doi: 10.1016/j.febslet.2011.07.012. [DOI] [PubMed] [Google Scholar]
- 46.Ogawa H, et al. Structure, function and physiological role of glycine N-methyltransferase. The International Journal of Biochemistry & Cell Biology. 1998;30(1):13–26. doi: 10.1016/s1357-2725(97)00105-2. [DOI] [PubMed] [Google Scholar]
- 47.Roesch K, et al. The calcium-binding aspartate/glutamate carriers, citrin and aralar1, are new substrates for the DDP1/TIMM8a-TIMM13 complex. Hum Mol Genet. 2004;13(18):2101–11. doi: 10.1093/hmg/ddh217. [DOI] [PubMed] [Google Scholar]
- 48.Barron JT, Gu L, Parrillo JE. Malate-aspartate shuttle, cytoplasmic NADH redox potential, and energetics in vascular smooth muscle. J Mol Cell Cardiol. 1998;30(8):1571–9. doi: 10.1006/jmcc.1998.0722. [DOI] [PubMed] [Google Scholar]
- 49.Ma D, et al. Inhibition of glycogen phosphorylation induces changes in cellular proteome and signaling pathways in MIA pancreatic cancer cells. Pancreas. 2012;41(3):397–408. doi: 10.1097/MPA.0b013e318236f022. [DOI] [PMC free article] [PubMed] [Google Scholar]
- 50.Pilkis SJ, Granner DK. Molecular physiology of the regulation of hepatic gluconeogenesis and glycolysis. Annu Rev Physiol. 1992;54:885–909. doi: 10.1146/annurev.ph.54.030192.004321. [DOI] [PubMed] [Google Scholar]
- 51.Lu M, Shyy JYJ. Sterol regulatory element-binding protein 1 is negatively modulated by PKA phosphorylation. American Journal of Physiology - Cell Physiology. 2006;290(6):C1477–C1486. doi: 10.1152/ajpcell.00374.2005. [DOI] [PubMed] [Google Scholar]
- 52.Duncan RE, et al. Regulation of lipolysis in adipocytes. Annu Rev Nutr. 2007;27:79–101. doi: 10.1146/annurev.nutr.27.061406.093734. [DOI] [PMC free article] [PubMed] [Google Scholar]
- 53.van de Weijer T, et al. Relationships between mitochondrial function and metabolic flexibility in type 2 diabetes mellitus. PLoS One. 2013;8(2):e51648. doi: 10.1371/journal.pone.0051648. [DOI] [PMC free article] [PubMed] [Google Scholar]
- 54.Vranic M. Banting Lecture: glucose turnover. A key to understanding the pathogenesis of diabetes (indirect effects of insulin) Diabetes. 1992;41(9):1188–206. doi: 10.2337/diab.41.9.1188. [DOI] [PubMed] [Google Scholar]
- 55.Reaven GM, Hollenbeck CB, Chen YD. Relationship between glucose tolerance, insulin secretion, and insulin action in non-obese individuals with varying degrees of glucose tolerance. Diabetologia. 1989;32(1):52–5. doi: 10.1007/BF00265404. [DOI] [PubMed] [Google Scholar]
- 56.Endemann G, et al. Lipogenesis from ketone bodies in the isolated perfused rat liver. Evidence for the cytosolic activation of acetoacetate. J Biol Chem. 1982;257(7):3434–40. [PubMed] [Google Scholar]
- 57.Goldberg RP, Brunengraber H. Contributions of cytosolic and mitochondrial acetyl-CoA syntheses to the activation of lipogenic acetate in rat liver. Adv Exp Med Biol. 1980;132:413–8. doi: 10.1007/978-1-4757-1419-7_41. [DOI] [PubMed] [Google Scholar]
- 58.DeBerardinis RJ, et al. The biology of cancer: metabolic reprogramming fuels cell growth and proliferation. Cell Metab. 2008;7(1):11–20. doi: 10.1016/j.cmet.2007.10.002. [DOI] [PubMed] [Google Scholar]
- 59.Garcia-Ruiz C, et al. Mitochondrial dysfunction in nonalcoholic fatty liver disease and insulin resistance: Cause or consequence? Free Radic Res. 2013 doi: 10.3109/10715762.2013.830717. [DOI] [PubMed] [Google Scholar]
- 60.Tailleux A, et al. Apolipoprotein A-II, HDL metabolism and atherosclerosis. Atherosclerosis. 2002;164(1):1–13. doi: 10.1016/s0021-9150(01)00751-1. [DOI] [PubMed] [Google Scholar]
- 61.Zhong S, et al. Human ApoA-II inhibits the hydrolysis of HDL triglyceride and the decrease of HDL size induced by hypertriglyceridemia and cholesteryl ester transfer protein in transgenic mice. J Clin Invest. 1994;94(6):2457–67. doi: 10.1172/JCI117614. [DOI] [PMC free article] [PubMed] [Google Scholar]
- 62.Lloyd MD, et al. alpha-Methylacyl-CoA racemase (AMACR): metabolic enzyme, drug metabolizer and cancer marker P504S. Prog Lipid Res. 2013;52(2):220–30. doi: 10.1016/j.plipres.2013.01.001. [DOI] [PubMed] [Google Scholar]
- 63.Dansen TB, Wirtz KW. The peroxisome in oxidative stress. IUBMB Life. 2001;51(4):223–30. doi: 10.1080/152165401753311762. [DOI] [PubMed] [Google Scholar]
- 64.Gutierrez J, et al. Free Radicals, Mitochondria, and Oxidized Lipids: The Emerging Role in Signal Transduction in Vascular Cells. Circulation Research. 2006;99(9):924–932. doi: 10.1161/01.RES.0000248212.86638.e9. [DOI] [PubMed] [Google Scholar]
- 65.Galgani JE, Moro C, Ravussin E. Metabolic flexibility and insulin resistance. Am J Physiol Endocrinol Metab. 2008;295(5):E1009–17. doi: 10.1152/ajpendo.90558.2008. [DOI] [PMC free article] [PubMed] [Google Scholar]
- 66.Pisani P. Hyper-insulinaemia and cancer, meta-analyses of epidemiological studies. Arch Physiol Biochem. 2008;114(1):63–70. doi: 10.1080/13813450801954451. [DOI] [PubMed] [Google Scholar]
- 67.Fair AM, Montgomery K. Energy balance, physical activity, and cancer risk. Methods Mol Biol. 2009;472:57–88. doi: 10.1007/978-1-60327-492-0_3. [DOI] [PubMed] [Google Scholar]
- 68.Mazurek S, et al. Pyruvate kinase type M2: a crossroad in the tumor metabolome. Br J Nutr. 2002;87(Suppl 1):S23–9. [PubMed] [Google Scholar]
- 69.Jain M, et al. Metabolite Profiling Identifies a Key Role for Glycine in Rapid Cancer Cell Proliferation. Science. 2012;336(6084):1040–1044. doi: 10.1126/science.1218595. [DOI] [PMC free article] [PubMed] [Google Scholar]
- 70.Burkart A, et al. Adenylate Kinase 2 Links Mitochondrial Energy Metabolism to the Induction of the Unfolded Protein Response. Journal of Biological Chemistry. 2011;286(6):4081–4089. doi: 10.1074/jbc.M110.134106. [DOI] [PMC free article] [PubMed] [Google Scholar]
- 71.Gong B, Chen Q, Almasan A. Ionizing radiation stimulates mitochondrial gene expression and activity. Radiat Res. 1998;150(5):505–12. [PubMed] [Google Scholar]
- 72.Li JM, et al. Effects of hydrogen peroxide on mitochondrial gene expression of intestinal epithelial cells. World J Gastroenterol. 2002;8(6):1117–22. doi: 10.3748/wjg.v8.i6.1117. [DOI] [PMC free article] [PubMed] [Google Scholar]
- 73.Vander Heiden MG, Cantley LC, Thompson CB. Understanding the Warburg Effect: The Metabolic Requirements of Cell Proliferation. Science. 2009;324(5930):1029–1033. doi: 10.1126/science.1160809. [DOI] [PMC free article] [PubMed] [Google Scholar]
- 74.Scott JD, Newton AC. Shedding light on local kinase activation. BMC Biol. 2012;10:61. doi: 10.1186/1741-7007-10-61. [DOI] [PMC free article] [PubMed] [Google Scholar]
- 75.Sipe JC, et al. Biomarkers of endocannabinoid system activation in severe obesity. PLoS One. 2010;5(1):e8792. doi: 10.1371/journal.pone.0008792. [DOI] [PMC free article] [PubMed] [Google Scholar]
- 76.Ingerson-Mahar M, et al. The metabolic enzyme CTP synthase forms cytoskeletal filaments. Nat Cell Biol. 2010;12(8):739–46. doi: 10.1038/ncb2087. [DOI] [PMC free article] [PubMed] [Google Scholar]
- 77.Barry RM, Gitai Z. Self-assembling enzymes and the origins of the cytoskeleton. Curr Opin Microbiol. 2011;14(6):704–11. doi: 10.1016/j.mib.2011.09.015. [DOI] [PMC free article] [PubMed] [Google Scholar]
- 78.An S, et al. Microtubule-assisted mechanism for functional metabolic macromolecular complex formation. Proc Natl Acad Sci U S A. 2010;107(29):12872–6. doi: 10.1073/pnas.1008451107. [DOI] [PMC free article] [PubMed] [Google Scholar]
- 79.Wang J, et al. The molecular nature of the F-actin binding activity of aldolase revealed with site-directed mutants. J Biol Chem. 1996;271(12):6861–5. [PubMed] [Google Scholar]
- 80.Wang J, Tolan DR, Pagliaro L. Metabolic compartmentation in living cells: structural association of aldolase. Exp Cell Res. 1997;237(2):445–51. doi: 10.1006/excr.1997.3811. [DOI] [PubMed] [Google Scholar]
Associated Data
This section collects any data citations, data availability statements, or supplementary materials included in this article.