

Abstract
Changes in microglial cell activation and distribution are associated with neuronal decline in the CNS, particularly under pathological conditions. Activated microglia converge on the initial site of axonal degeneration in human glaucoma, yet, their part in its pathophysiology remains unresolved. To begin with, it is unknown whether microglia activation precedes or is a late consequence of retinal ganglion cell (RGC) neurodegeneration. Here, we address this critical element in DBA/2J (D2) mice, an established model of chronic inherited glaucoma, using as a control the congenic substrain DBA/2J Gpnmb+/SjJ (D2G), which is not affected by glaucoma. We analyzed the spatial distribution and timecourse of microglial changes in the retina, as well as within the proximal optic nerve prior to and throughout ages when neurodegeneration has been reported. Exclusively in D2 mice, we detected early microglia clustering in the inner central retina and unmyelinated optic nerve regions, with microglia activation peaking by 3 months of age. Between 5 and 8 months of age, activated microglia persisted and concentrated in the optic disc, but also localized to the retinal periphery. Collectively, our findings suggest microglia activation is an early alteration in the retina and optic nerve in D2 glaucoma, potentially contributing to disease onset or progression. Ultimately, detection of microglial activation may have value in early disease diagnosis, while modulation of microglial responses may alter disease progression.
Indexing Terms: RGCs, optic nerve, DBA/2J, DBA/2J Gpnmb+/SjJ, Iba1
Introduction
Glaucoma is a prevalent neurodegenerative disorder characterized by progressive deterioration of the optic nerve axons, and slow decline and death of retinal ganglion cells (RGCs), which impairs vision and can lead to blindness. Although age and intraocular pressure (IOP) elevation constitute the main risk factors in glaucoma, all age groups and even patients with normal IOP can be affected by this neuropathy, suggesting that other conspiring events lead to the compartmentalized loss of RGC viability (John, 2005; Whitmore et al., 2005). To date, the exact mechanisms responsible for RGC degeneration in glaucoma remain unknown.
Accumulating evidence supports an active role of glial cells in glaucomatous RGC pathology. Glia resident in the retina and the optic nerve head (ONH) alter their gene expression profile during “activation”, likely exerting neuroprotective or damaging influences at different phases of disease progression (see Bolz et al., 2008; Cui et al., 2009; Hernandez et al., 2008; Langmann, 2007; Neufeld and Liu, 2003; Tezel and Wax, 2003). Altered crosstalk between RGCs and microglia, astrocytes or oligodendrocytes has been proposed as an early factor in the pathophysiology of glaucoma (reviewed by Johnson and Morrison, 2009; Nickells, 2007).
Microglia are CNS-resident innate immune cells, endowed with sensor and effector functions as well as with phagocytic capacity during physiological and pathological conditions (reviewed by Block et al., 2007; Hanisch and Kettenmann, 2007; Streit, 2005; Walter and Neumann, 2009). In response to various stimuli associated with aging, neurodegeneration or injury, microglia adopt a so-called activated state, in which they progress from a surveillance mode (usually called “resting”) to an activated effector phenotype, simplifying the complexity of their cell processes, sometimes migrating and even proliferating (reviewed by Tambuyzer et al., 2009). Microglia activation is triggered rapidly at a very low threshold and kept territorially restricted, and its outcome can be beneficial or detrimental to the local neurons, depending on their capacity to regulate microglia and the duration of the response (reviewed by Lucin and Wyss-Coray, 2009).
In the mature mouse retina, microglia localize within all layers except the outer nuclear layer (Santos et al., 2008). In human glaucoma, there is abnormal microglia reactivity and redistribution within the ONH, where optic nerve pathology is first detectable (Neufeld, 1999; Neufeld and Liu, 2003; Quigley et al., 1983; Yuan and Neufeld, 2001). Likewise, reactive microgliosis is detectable in retinas and severely damaged nerves from animal models of chronic glaucoma (Inman and Horner, 2007; Son et al., 2010) and of induced ocular hypertension (Chauhan et al., 2002; Johnson et al., 2007; Lam et al., 2003; Naskar et al., 2002; Wang et al., 2000). Other sources of RGC damage also trigger microglia activation, for instance axotomy (Garcia-Valenzuela et al., 2005; Sobrado-Calvo et al., 2007; Thanos, 1991; Zhang and Tso, 2003) and ischemia (Davies et al., 2006; Zhang and Tso, 2005). However, the mechanisms controlling microglial recruitment and activation in human glaucoma or animal models are not established, and it is unclear when during disease microglia undergo these changes.
The inbred mouse strain DBA/2J (D2) has emerged as an important model of pigmentary glaucoma (reviewed by Johnson et al., 2010; McKinnon et al., 2009). D2 mice carry recessive mutations in Gpnmb and Tyrp1b genes (Chang et al., 1999; Anderson et al., 2002), which are responsible for early iris atrophy and pigment dispersion that block aqueous outflow causing elevated intraocular pressure (John et al., 1998; reviewed by Libby et al., 2005). To identify changes specific to glaucoma, D2 mice are currently being compared with genetically matched control mice that carry a functional Gpnmb allele (D2G). These mice do not develop glaucoma at any age, as defined by the lack of nerve damage, although they suffer a minor iris disease due to the remaining Tyrp1b mutation, but lack IOP elevation (Howell et al., 2007b).
Evidence from multiple studies on RGC degeneration in D2 mice have contributed to two novel concepts: 1) that at the cell level, every RGC compartment is affected, namely dendrites, axon and soma, and 2) that as a population, RGCs degenerate and die in an asynchronous and progressive fashion, involving sectors within the retina, the optic nerve and the central targets. However, the sequence and relative impact of the decline of each RGC compartment remain unclear.
In the D2 mouse, iris atrophy and angle closure develops in the anterior segment of the eye between 1 and 3 months of age (Zhou et al., 2005; Schraermeyer et al., 2009). There is evidence for early degeneration changes in RGCs, including loss of post-synaptic areas in the dendrites within the retinal inner plexiform layer, which was detected in 5 month-old D2 mice (Stevens et al., 2007). In addition, there is progressive decline of anterograde axonal transport function from 3 to 10 months (Crish et al., 2010), as well as retrograde transport deficits (Buckingham et al., 2008; Jakobs et al., 2005; Soto et al., 2008) that precede frank axonal loss within the optic nerve (Soto et al., 2008). Many of these studies also report concurrent alteration in RGC gene expression. Notably, RGC apoptosis and somal loss is a relatively late event (12 months; Libby et al., 2005a,b; Reichstein et al., 2007; Schlamp et al., 2006). Spatially, RGC axonal decline is first detectable in the unmyelinated portion within the ONH and nerve laminar region (Howell et al., 2007a; Soto et al., 2008). Since there is evidence of RGC decline well before axonal or somal loss in the D2 model of glaucoma, there is an effort to examine the initial stages of disease and the pathogenic mechanisms at work early (i.e. Bosco et al., 2008; Crish et al., 2010; Fan et al., 2010; Inman et al., 2006; Saleh et al., 2007).
The decline of RGCs is associated with increased astrocyte and Müller glia reactivity and slow microglia proliferation (Buckingham et al., 2007; Crish et al., 2010; Howell et al., 2007a; Inman and Horner, 2007; Jakobs et al., 2005; Libby et al., 2005; Schlamp et al., 2006; Son et al., 2010; Stevens et al., 2007). Much effort has focused on elucidating the role of glia in D2 glaucoma, mostly on the relation of astrocyte gliosis and axonopathy within the proximal optic nerve (Du et al., 2007; Howell et al., 2007; Son et al., 2010; Sun et al., 2009). Regarding microglia, gene expression profiling studies of D2 mice link a retinal innate immune response to disease (Steele et al, 2006), and even suggest its involvement in disease onset (Fan et al., 2010). Furthermore, we observed a neuroprotective effect with improved RGC axonal integrity associated with early and chronic microglia deactivation during glaucoma progression (Bosco et al., 2008), implicating microglia in the pathogenesis of glaucoma in D2 mice.
Despite the relevance of microglia function in normal retina physiology and pathology, and their possible implication in D2 glaucoma, it is unclear where and when microglial activation occurs. Are microglia changes different near each RGC compartment, for example within the retina versus the optic nerve? Is microglia activation only a late event secondary to RGC degeneration, or is it evident at stages prior to overt neurodegeneration suggesting a response to more subtle changes within the retina? To define the spatial and temporal pattern of microglial changes during the progression of chronic glaucoma, we characterize the chronology and scope of microglial activation in the retina and unmyelinated optic nerve of D2 mice, as compared to non-glaucoma control D2 mice. We find that retinal microglia activation selectively arises in young D2 mice. By 3 months, microglia activation peaks within the central retina and proximal optic nerve, while later on activated microglia are found at the retinal periphery. These data demonstrate that microglia activation constitutes the earliest reported retinal alteration detected in this model of glaucoma, and provide the basis for further defining the functional role of microglia in the compartmentalized decline of RGCs during specific phases of glaucoma.
Materials and Methods
Mouse strains
All animal procedures were approved by the local Institutional Animal Care and Use Committee and followed ARVO guidelines for the use of animals in ophthalmic research. Mice purchased from Jackson Laboratory (Bar Harbor, ME) were bred and aged at the University of Utah in a pathogen-free barrier facility under a 12 hr light/dark cycle. To avoid genetic drift, new breeders from Jackson were introduced every 3 or 4 generations. Three different strains of adult mice were used in this study: 1) DBA/2J (D2) mice as model of inherited pigmentary glaucoma (Jackson, stock number 000671), 2) B6.129P-Cx3cr1tm1Litt/J mice (stock # 005582) homozygous for the Cx3cr1-GFP targeted mutation, in which brain microglia express GFP under the control of the fractalkine receptor locus (Jung et al., 2000), and 3) DBA/2J-Gpnmb+/Sj mice (here referred as D2G; stock # 007048), as a control substrain to D2, derived from founders kindly donated by Simon W. R. John (Jackson Laboratory).
Histology
Deeply anesthetized mice (Isoflurane) aged 1 to 12 months, were transcardially perfused with saline solution followed by 4% paraformaldehyde (EMS, Hatfield, PA) in 0.1M pH 7.4 phosphate saline buffer (PBS), using a peristaltic pump (Dynamax, Rainin, Oakland, CA). After removing the brain above the optic chiasm, the exposed optic nerves and eyes were post-fixed in situ for 2 hr at 4°C and rinsed in PBS. Before enucleation, the dorsal pole of each eye was marked by cautery to allow further orientation of the retina, and the nerve was sectioned anterior to the chiasm and freed of dura. After dissecting out the cornea and lens, the eyecups with attached optic nerves were embedded in a 7% gelatin (300 Bloom; Sigma-Aldrich) and 20% sucrose solution in 0.1M pH 7.4 phosphate buffer; the blocks were frozen in powdered dry ice, cryosectioned at 16 μm thickness, and mounted on Superfrost Plus slides (Fisher Scientific, Pittsburgh, PA) for storage at -80°C until use. Alternatively, whole neural retinas with intact ONH were isolated in ice-cold PBS and separated from their optic lamina and nerve to obtain a specimen of even thickness. Next, the retina was flattened by 4 radial cuts executed between quadrants, and used for immediate immunostaining.
Immunohistochemistry
Retinal flat mounts as well as cryosections were rinsed in PBS, treated for 5 min with 50 mM NH4Cl in PBS to reduce autofluorescence, washed three times (5 minutes) in cold PBS, and blocked/permeabilized for 1 hr at room temperature in a solution containing 0.2% Triton X-100, 1% bovine serum albumin and 5% donkey serum in PBS. Primary antibodies were diluted in the same solution, but without Triton and incubated for 3 days at 4°C. After 3 washes in PBS (10 minutes) with gentle rocking, the tissue was incubated for 2 hr at room temperature with secondary antibodies diluted (1:400) in 1% BSA in PBS. Slides were thoroughly rinsed in cold PBS, counterstained with Hoechst 33258 (Invitrogen, Carlsbad, CA), rinsed again, mounted in Fluoromount-G (Southern Biotech, Birmingham, AL) and cover slipped with 0.16-0.19 mm glass (VWR, West Chester, PA).
Antibody characterization
We summarized the specific information for each primary antibody used in Table 1.
Table 1. List of primary antibodies.
Common name, immunogen or clone, host species, dilution and source are indicated. Asterisks indicate antibodies already included in J Comp Neurol primary antibody's database.
| Polyclonal anti- | Immunogen, Host Species | Source, Catalog No. | Dilution, Titer (μg/ml) | |
|---|---|---|---|---|
| Iba1 (*) | Synthetic peptide corresponding to human Iba1 C-terminal amino acids 134-147, rabbit |
Wako (1), 019-19741 | 1:1,000 (0.5) | |
|
| ||||
| GFP | Full-length GFP (Aequorea victoria), goat | abcam (2), ab5450 | 1:2,000 (0.5) | |
|
| ||||
| Aquaporin-4 | Synthetic peptide corresponding to human AQP4 C-terminal amino acids 300-323, goat |
Santa Cruz (3), sc-9888 | 1:50 (4) | |
|
| ||||
| Brn3 (*) | Synthetic peptide corresponding to human Brn3b C-terminal amino acids 360-409, goat |
Santa Cruz (3), sc-6026 | 1:50 (4) | |
|
| ||||
| CRALBP (*) | Cellular retinaldehyde-binding protein isolated from bovine retina and RPE, rabbit |
John C. Saari (4) | 1:1,000 | |
|
| ||||
| Monoclonal anti- | Immunogen, Clone | Source, Catalog No. | Dilution | |
|
| ||||
| GFAP (*) | Porcine spinal cord GFAP, G-A-5 | Sigma (5), C9205 | 1:1,000 | |
| MAP1 | Rat brain MAPs, HM-1 | Sigma (5), M4278 | 1:300 | |
| Neurofilament | Human brain neurofilament, 2F11 | Dako (6), | M0762 1:50 | |
Antibodies listed in J Comp Neurol antibody's database.
1) Richmond, VA; 2) Cambridge, MA; 3) Santa Cruz, CA; 4) University of Washington, Seattle, WA; 5) Saint Louis, MO; 6) Carpinteria, CA.
The Iba1 antibody recognizes a single band of 17 kDa corresponding to Iba1 protein by immunoblot analysis of rat brain microglia cultures and several human monocytic cell lines (Imai et al., 1996). Iba1 is the ionized calcium-binding adaptor molecule 1 (reviewed by Imai and Kohsaka, 2002), also known as AIF1 (allograft inflammatory factor; Utans et al., 1995; Autieri, 1996). This Iba1 antibody is a pan-microglia and macrophage marker, which does not label neurons or astrocytes (Ito et al., 1998). This antibody stains mouse retinal and optic nerve microglia (Bosco et al., 2008; Inman and Horner, 2007; Johnson et al., 2007; Joly et al., 2009; Naskar et al., 2002; Santos et al., 2008; Saraswathy et al., 2006). Iba1 expression is constitutive in resting cells, and increases in connection with cytoskeletal remodeling and cell shape changes typical of cell activation (Ito et al., 1998; Imai and Kohsaka, 2002). The upregulation of Iba1 mRNA and/or protein expression are extensively used as readouts of microglia activation in the CNS (e.g. Nilsson et al., 2007).
The GFP antibody did not stain retinas or optic nerves derived from mice not expressing any form of GFP, such as D2 and D2G mice. Both cryosections and retinal whole mounts lacked GFP expression after application of identical immunofluorescence methods to those used for detecting eGFP expression under the control of the fractalkine receptor (Cx3cr1) locus. Double immunostaining of the optic nerve with anti-GFP and anti-Iba1 antibodies shows no immunoreactivity for GFP in microglia (Suppl. Fig. 1B), which are recognized by the Iba1 antibody (Suppl. Fig. 1C).
The aquaporin-4 (AQP4) antibody recognizes a 34 kDa-band by Western blot of rat and mouse kidney extracts (manufacturer's technical information, and see Marnetto et al., 2009). Quantitative analysis of AQP4 water channel mRNA and protein expression have shown their polarized distribution in adult Müller glial cells, as well as in retinal and optic nerve astrocytes (Nagelhus et al., 1998). In the adult mouse retina this AQP4 antibody stains Müller glia, whose end feet and inner process display the highest expression levels (Bosco et al., 2005). Double immunostaining of the central retina and proximal optic nerve region with antibodies against AQP4 and CRALBP shows the relative expressions of aquaporin-4 and CRALBP in Müller glia. The overlay of AQP4 and CRALBP stainings (Suppl. Fig. 1D) shows maximum overlap of their fluorescent signals within the Müller end feet and inner processes (notice the yellow areas). No colocalization is observed with the CRALBP-expressing oligodendrocytes within the optic nerve. The single channel view of AQP4 staining in the inner retina (Suppl. Fig. 1E) shows the intense labeling in the NFL and OPL, as well as around blood vessels localized to the INL and OPL (arrows), and the Müller cell somata located in the INL.
The Brn3 antibody (C-13) detects a single band at ∼50 kDa in mouse retinal extract (Elshatory et al., 2007). This antibody is routinely used as a nuclear marker of Brn3a and Brn3b-positive RGCs (Elshatory et al., 2007; Poché et al., 2008; Soto et al., 2008; Weishaupt et al., 2005).
The CRALBP (cellular-retinaldehyde protein) antibody yields a single band of ∼35 kDa on Western blots of mammalian retinal extracts (Anderson et al., 1986; Sarthy, 1996). This antibody has been broadly used to stain retinal Müller glia (Bunt-Milam and Saari, 1983; Eisenfeld et al., 1985; Kirsh et al., 2010), and within the optic nerve it also labels oligodendrocytes (Saari et al., 1997).
The GFAP (glial fibrillary acidic protein) antibody recognizes a single band of ∼51 kDa by Western blot of extracts of human glioma cell line U33CG/343MG (Debus et al., 1983). This antibody, conjugated to Cy3, recognizes astrocytes as confirmed by staining of cells expressing GFP under the GFAP promoter (Platel et al., 2009). In the retina, this antibody labels retinal and optic nerve astrocytes (Bosco et al., 2008; Kerr et al., 2010). Millipore (MAB3402) also produces this monoclonal antibody.
The MAP1 (microtubule-associated protein 1) antibody recognizes a 350-kDa band, corresponding to the MAP1a isoform on immunoblots of whole rat brain homogenates (Huber and Matus, 1984; Douglas et al., 2006). In the rodent retina, this antibody selectively labels RGC dendritic arbors and post-synaptic terminals (Mojumder et al., 2008a, b; Okabe et al. 1989; Sherry et al., 2006). Millipore (MAB362) also produces this monoclonal antibody.
The neurofilament antibody recognizes bands at 68 and 200 kDa by immunoblot analysis of bovine brain, which corresponds to respective subunits of phosphorylated neurofilament, and specifically labels neurons (Klück et al., 1984). In the mouse retina and optic nerve, this antibody stains RGC axons and/or somata, colocalizing with gamma-synuclein, a marker of RGCs (Soto et al., 2008; Surgucheva et al., 2008). Abcam (ab910) and GeneTex (GTX242571) also produce this monoclonal antibody.
The secondary antibodies used in this study are produced in donkey against mouse, rabbit or goat IgG, and conjugated to Alexa Fluor 488, 555 or 647 nm (Invitrogen, Molecular Probes).
Microscopy
Imaging was conducted by confocal inverted microscopy (A1 and NIS-Elements 3.1, Nikon, Melville, NY; Fluoview 300, Olympus, Center Valley, PA) using a 20x objective. The image acquisition settings for each combination of primary/secondary antibodies were maintained identical throughout specimens, in order to yield comparable images across ages and/or mouse strains. In each retinal wholemount we imaged two 354 × 354 μm fields, either centered in the optic disc or 2 mm away from at the dorsal mid-periphery. Images spanned the innermost retinal layers, from the nerve fiber layer (NFL) to the outer plexiform layer (OPL), including optical slices 0.5 μm-thick (25 to 30 slices), as well as the entire ONH depth. The colocalization coefficient for GFP and Iba1 signals was estimated between their respective Alexa Fluor-conjugated secondary antibodies (488 vs. 555 nm) and represented by scattergram (Suppl. Fig. 4; NIS-Elements AR). All images were identically and minimally adjusted for brightness and contrast in the native confocal program (Photoshop CS3, Adobe Systems, San Jose, CA). Images shown here represent maximum-intensity projections of the inner retina (NFL to IPL) or single optical slice views. All scale bars represent length in μm.
Immunofluorescence densitometry
We compared the relative expression of Iba1 by immunofluorescence in the D2 retina across ages, as well as with age-matched D2G control mice. Images of the central or peripheral retina collected from wholemount retinas were quantified “blind” to the age of the specimen using image-analysis software (Fluoview 500). For each retinal field, we counted the number of microglial cell somata present in the slices corresponding to the NFL, GCL and IPL. Next, we measured the mean intensity of Iba1 fluorescence for each optical slice and selected the one with maximum intensity, from which we subtracted the background intensity. Finally, we calculated the mean Iba1 intensity level per cell.
Quantitative real time PCR (qRT-PCR)
We assessed the expression levels for Iba1 in 1, 3, 5, 8 and 12 month-old D2 and D2G mouse retinas. For this, mice were killed by carbon dioxide asphyxiation and immediate decapitation. Neural retinas with attached optic nerves were acutely dissected in chilled RNAse-free PBS and completely freed of pigmentary epithelium, ciliary body and perineural tissue. Using the tip of a sterile Pasteur pipette and iridectomy scissors we separated three samples: the proximal myelinated optic nerve (1 mm long), the central retina (1 mm diameter) including the ONH and lamina (OL, ∼ 0.8 mm long), and the remaining peripheral retina (Fig. 6E). RNAs were immediately extracted from each retinal sample, followed by measurement of their concentrations and purity in a spectrophotometer (NanoDrop ND-1000, PeqLab, Wilmington, DE). First-strand cDNA synthesis and qPCR were performed as described (Buckingham et al., 2008, Soto et al., 2008). Additionally, we compared Iba1 to CD115, F4/80 and CD68 mRNA levels in D2 central retina samples. The primer sets used are indicated in Table 2.
Figure 6. Microglia cluster around the ONH by 3 months in D2 mice, but not in D2G.
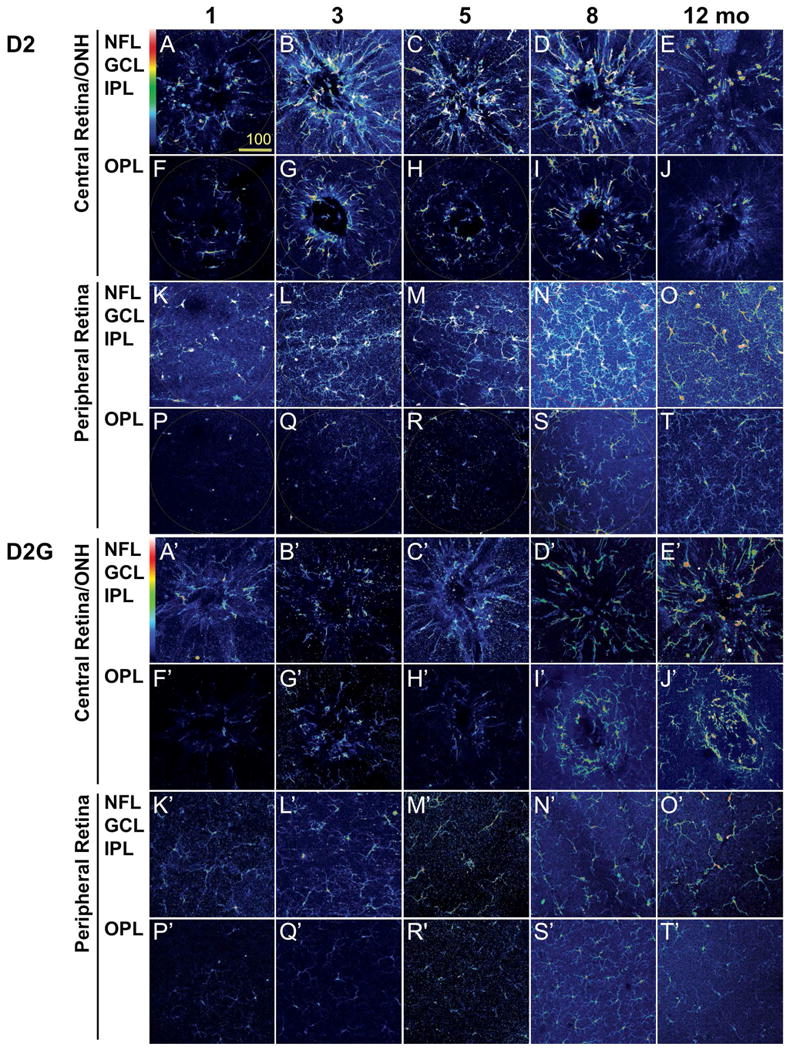
Confocal images of the inner (NFL, GCL and IPL) and the outer retina (OPL) of retinal whole mount immunostained for Iba1 are shown as maximum projection. The Iba1 channel is shown in pseudocolors to represent the relative intensity of expression. A) Representative samples from D2 mice at ages preceding RGC neurodegeneration (1, 3 and 5 months), when optic nerve pathology (8 months) or RGC death (12 months) are detectable. These images portraying microglia spatial distribution and activation levels reveal the relative increase in the intensity of Iba1 expression per cell by 3 months in the D2 central retina/ONH. Within the periphery, the inner retina undergoes microgliosis most evident by 8 months, although maintaining comparable levels of Iba1 expression across ages. Scale bars, 20 μm. B) Identical images of age-matched D2G control mice, acquired with the same confocal settings, show that no microgliosis or microglia activation develops in the central retina from 1 to 3 months of age or later. Also, no conspicuous changes in microglial density or Iba1 expression take place in the peripheral retina. Scale bars, 20 μm.
Table 2.
Sequences of primers used in real time PCR.
| Target | Forward Primer | Reverse Primer | bp F/R |
|---|---|---|---|
| Iba1 | CCTGATTGGAGGTGGATGTCA | GGCTCACGACTGTTTCTTTTTTCC | 21/24 |
| CD115 | AAAAAACCCGTCCCAAACTCTC | TGTCCCAAGAAGCCTGTAGTCTAAG | 22/25 |
| CD68 | TGGCGGTGGAATACAATGTGTC | GAGAGAGCAGGTCAAGGTGAACAG | 22/24 |
| F4/80 | TAGTGGAGGCAGTGATGCTCTTC | CCCGTCTCTGTATTCAACCAGC | 23/22 |
| ß-actin | TGAGAGGGAAATCGTGCGTG | TCGTTGCCAATAGTGATGACCTG | 20/23 |
Intraocular pressure (IOP)
D2 mice had their IOP monitored monthly using a Tono-Lab (Colonial Medical Supply). Bilateral measurements were collected before noon under Avertin anesthesia (1.3% 2,2,2-tribromoethanol and 0.8% tert-amyl alcohol in dH2O; Sigma- Aldrich). The mean IOP per eye was calculated from twenty measurements with a SEM < 0.5, after excluding the highest and lowest values (Suppl. Fig. 2). We did not monitor IOP in the cohort of D2G control mice, since they do not develop ocular hypertension (Howell et al., 2007). Only 3 mice had their IOP measured at 3, 4 and 5 months of age, and showed means averaging 16 mm Hg (data not shown).
Statistics
For direct comparisons between timepoints, strains or locations, unpaired t-test with Welch's correction for unequal variances was performed using InStat3 software (GraphPad, La Jolla, CA). Timecourse analysis of mRNA expression was performed using ANOVA with a Dunn's post-hoc test. Data are presented as mean, with error bars indicating the standard error of the mean. Both sample sizes and levels of statistical significance are indicated within the Figure legends.
Results
Retinal microglia distribute in 3 mosaics localized to the NFL/GCL, IPL and OPL
Microglial cell somata are organized as three parallel mosaics of tiled cells with processes projecting throughout the synaptic layers of the retina. One mosaic localizes directly underneath the vitreal surface, another two within each synaptic layer, while few microglia occupy the subretinal space (Bodeutsch and Thanos, 2000; Hume et al., 1983; Santos et al., 2008). To understand the potential interaction between RGCs and microglia in the D2 mouse, we first assessed their spatial relationship within the retina. This initial analysis focused on prepathologic ages (1 month), when no signs of RGC neurodegeneration have been reported, but development is complete. Using immunostaining for Iba1 (AIF1), we collected images spanning all the retinal layers containing Iba1-positive cells, and compared cell morphology, number and distribution. Since microglia become less ramified and increase their soma size with activation, changes in cell morphology are indicative of changes in cell activation state (for details see Bosco et al., 2008). Throughout this study we used a quantitative analysis of Iba1 mRNA and protein expression as a readout of microglial cell activation based on the facts that: 1) In the CNS, Iba-1 expression is restricted to microglia and macrophages, 2) Iba1, an EF-hand calcium-binding protein, is essential for the rearrangement of the membrane cytoskeleton during cell shape change and phagocytosis (Ito et al., 1998), and 3) Iba1 expression is upregulated during cell activation (Deininger et al., 2002; Imai et al., 1996; Ohsawa et al., 2000, 2004).
Radial retinal sections (Fig. 1A) reveal with detail the positioning of microglial somata at the level of the nerve fiber layer (NFL; cell #1) and ganglion cell layer (GCL; cell #2), as well as within the inner plexiform layer (IPL), either underneath the GCL (cell #3), or above the inner nuclear layer (INL; cell #4). Microglia localized to the NFL and GCL extend horizontal processes along the NFL, while in the IPL cells branch and extend their processes across the entire synaptic region. Cells with somata in the OPL (cells #5) project thin horizontal processes and sturdy radial processes that cross the INL and reach the IPL. Notice the tiled arrangement of microglia somata at each retinal depth, and the absence of overlap between processes from cells located within the same or different layers. Rarely, OPL microglial processes reach across the entire outer nuclear layer (ONL) towards the subretinal space (not shown).
Figure 1. Retinal microglia tile the vitreal surface and synaptic layers.
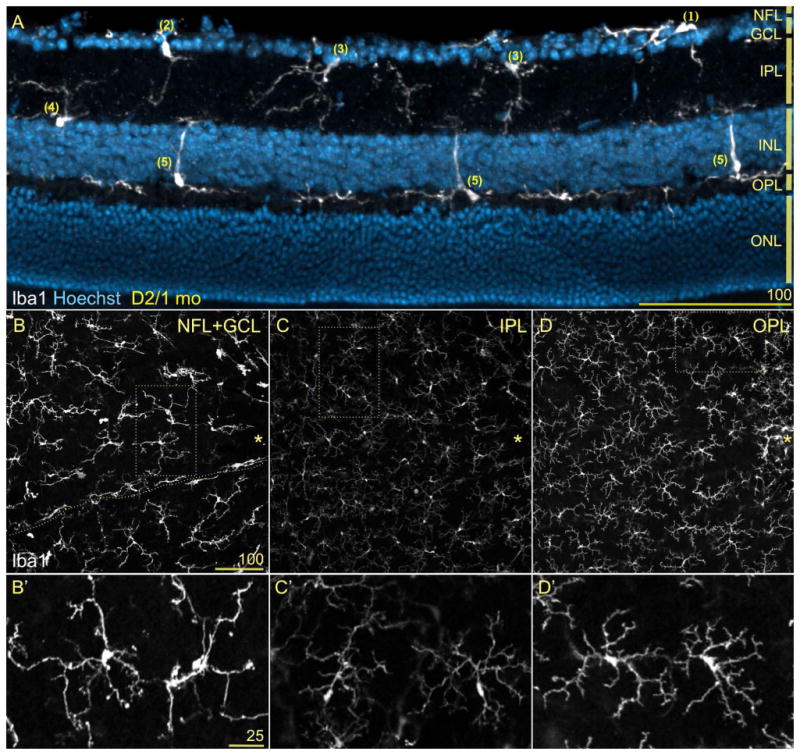
Neural retinas showing Iba1 immunostaining (white) and nuclear counterstaining (blue). A) Radial section through the mid-peripheral retina from 1 month-old (mo) D2 mice. Microglia cells (Iba1+) position their somata at the NFL (cell #1), GCL (#2), inner (#3) or outer IPL (#4), and within the innermost surface of the OPL (#5). Cells localized to the NFL and GCL extend tangential processes along the vitreal surface, IPL microglia project complex arbors throughout the IPL, while microglia at the OPL send sturdy processes across the INL reaching the IPL or thinner and branched processes that line the INL outer surface. The absence of microglia in the ONL is prevalent, although their somata within the subretinal space sometimes project processes across the ONL (not shown). B-D) The whole mount view of a similar field lateral to the optic disc (asterisk) depict the parallel mosaics of retinal microglia. Same scale bar. B) At the depths corresponding to the NFL and GCL, microglia are aligned with blood vessels (space shown with dashed line), adopting a radial orientation towards the optic disc, while parenchymal microglia array more regularly. C) At the IPL, regularly tiled microglia show small somata and complex, wispy processes. D) Deeper, the OPL microglia exhibit very discrete non-overlapping territories like IPL microglia, but with higher Iba1 expression levels. B′-D′) High magnification views of parenchymal microglia corresponding to the dotted frames in B-D. Observe that these pairs of cells tile their territories and show diverse soma size and shape, number and branching complexity of primary processes, and Iba1 expression levels. These elements suggest different degrees of cell activation. Same scale bar.
Images of retinal whole mounts reveal the complexity and regular tiling of each microglial mosaic for the same field (Fig. 1B-D), and corresponding insets show cell shape details at higher magnification (Fig. 1B′-D′). Overlying the inner retinal surface within the NFL and GCL (Fig. 1B, B′), large microglia with sturdy somata and processes are interspersed within the retinal parenchyma, orienting their thickest primary processes toward the optic disc (asterisk). Elongated perivascular microglia align with blood vessels (localization indicated with line). Below, within the IPL (Fig. 1C, C′), the mosaic of microglia is less conspicuous, with smaller somata and more intricate, delicate branching; still, the relatively smaller cell territories remain spaced out. The differences in cell shape and size between microglia localized within the NFL/GCL and the IPL suggest higher levels of activation at the inner retinal surface versus a more “resting” status within the IPL (see also Bosco et al., 2008). Notice too that the intensity of Iba1-associated fluorescence is noticeably higher at the NFL/GCL than at the IPL (Fig. 1B vs. C), indicative of Iba1 upregulation and increased activation. Deeper in the retina, the mosaic of microglia resident in the OPL (Fig. 1D, D′) shows cell dimensions and branching complexity that resemble IPL microglia, although their Iba1 expression is comparatively elevated and their territories relatively smaller. Thus, in the mature retina, parenchymal microglial somata localize within the GCL, as well as within the synaptic layers, extending processes throughout the NFL, IPL and OPL, and defining cell territories distributed across the retina in a non-overlapping pattern.
Microglia cluster within the ONH and proximal optic nerve
To assess the potential relationship between RGC axons and microglia we examined the distribution of microglia around the optic disc, and within the ONH and laminar region of the optic nerve in D2 mice aged 1 month (Fig. 2). Close to its geometric center, both the retinal lamination and the mosaic array of microglia are interrupted by the convergence of bundles of RGC axons in the optic disc, from which point they exit the retina defining the optic nerve head (ONH). Posterior to the ONH, the unmyelinated optic axons exit the orbit by passing through the glial lamina region (here referred to as optic lamina, OL), after which they transition to become myelinated in the optic nerve (Howell et al., 2007; Sun et al., 2009). In 1-month-old D2 mice, Iba1-positive cells mainly localize throughout the inner ONH (Fig. 2A, arrow), whereas in the OL, most microglia concentrate in a single, thick plane at the ONH-OL border (Fig. 2A, between arrowheads), with fewer dispersed cells in the distal region. Within the proximal optic nerve, microglia become progressively more abundant towards the ON proper. Microglia localized to the ONH and OL have diverse shapes, ranging from highly ramified cells with processes oriented perpendicular to the retina, to spherical cells most likely adjacent to the central blood vessel. Within the ON, microglia adopt both longitudinal and transverse orientations relative to the nerve axis (Fig. 2A).
Figure 2. Microglia show a compartmentalized distribution within the ONH and proximal optic nerve.
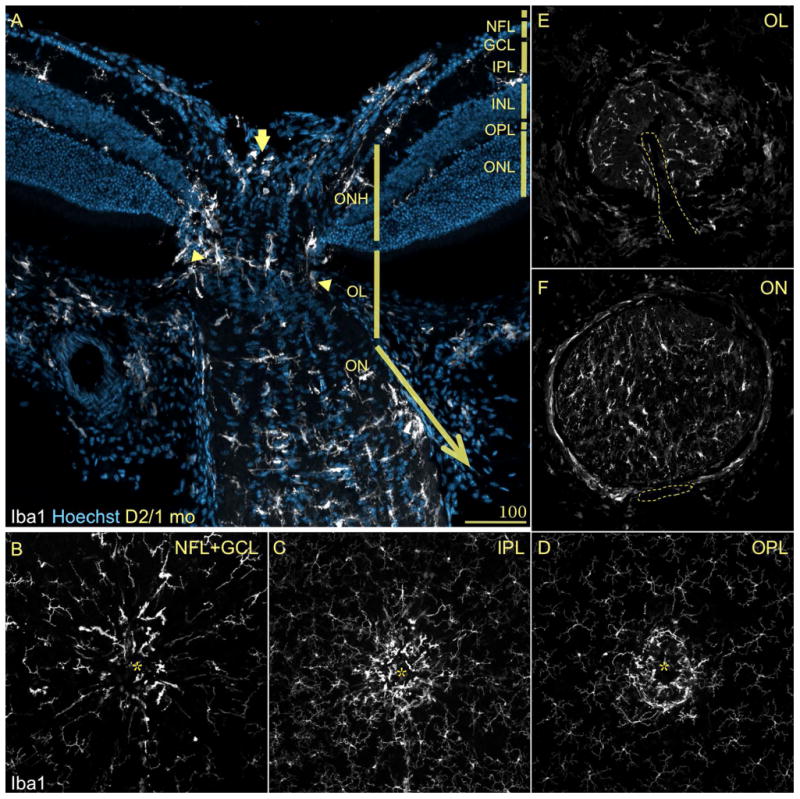
Central retina stained as in Fig. 1A. A) A longitudinal section across the optic nerve head (ONH), lamina (OL) and nerve (ON), reveals the compartmentalization of microglia, which have lost the regularity of their mosaic. Within the regions that contain unmyelinated axons, microglia cluster in the innermost region of the ONH (arrow) and its periphery, as well as in a plane across the OL (between arrowheads). In the transition zone between the OL and ON, microglial cell density increases until becoming abundant in the ON. B-D) Whole mount views throughout the central retina show again the mosaic arrangement of microglia within the retinal layers. Instead, within the ONH microglia concentrate in the ONH, with cells showing enlarged somata oriented along its periphery. E-F) Cross-sections of the proximal optic nerve regions, display the presence of scarce cells in the OL with an array that delimit circular spaces. In the optic nerve, more abundant cells fill the section with more regularity.
Whole mount preparations of the retina clearly expose the discontinuity in the microglial mosaics created by the ONH (Fig. 2B-D). The regularity of the cell tiling is lost in the optic disc (asterisk), where microglia with few sturdy primary processes orient perpendicular to the retina, surrounding the ONH throughout the levels corresponding to the NFL/GCL (Fig. 2B), IPL (C) and OPL (D). A cross-section view of the 30 μm of OL closest to the retina (Fig. 2E) shows the presence of an irregularly tiled mosaic of microglial cells with relatively small somata and simple cell processes, mostly located toward the nerve periphery and perivascularly (the delineated space indicates the location of the blood vessels). However, a similar view across the ON (Fig. 2F) shows microglia tiling its entire diameter, with some cells displaying elaborate processes. Overall, these observations show that subsets of microglia adopt a non-random array within the ONH and OL, as well as a more regular pattern along the optic nerve.
Microglia neighbor every RGC compartment vulnerable to degeneration
To assess the relationship between microglia and RGCs we double-immunostained retinal whole mounts and radial sections from 3-month-old D2 mice. As shown above, microglia and RGC somata are closely adjacent, since microglia resident within the innermost retinal layers position their somata within the NFL, the GCL or nearby in the inner IPL. A whole mount view of Brn3 (Pou4f2) and Iba1 staining shows that RGC nuclei coexist with a dense regular array of conspicuous microglial cells lined up and diverging from the optic disc (Fig. 3A, asterisk). In addition, microglia orient along RGC-free avenues where blood vessels are located (Fig. 3B). Microglial primary and higher order processes extend around RGC somata, with apparent apposition (Fig. 3C). A lateral view of a retinal section immunostained for Iba1 and MAP1 to reveal RGC dendrites shows their proximity to the branches of microglia resident in the GCL and IPL (Fig. 3D).
Figure 3. Microglia are adjacent to all RGC compartments in D2 mice.
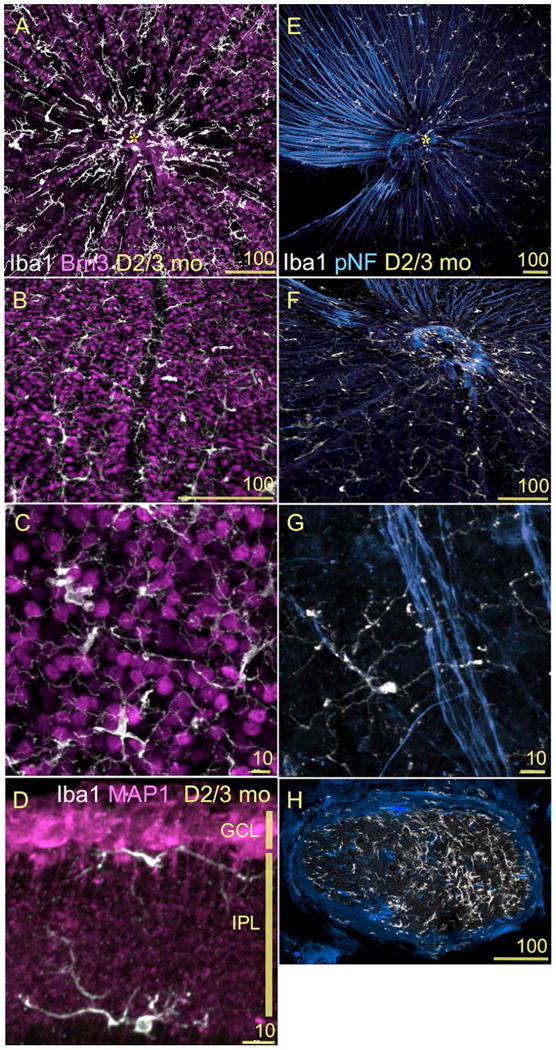
(A-H) Confocal images showing the spatial relationship between RGCs and microglia in 3mo D2 retinas. Scale bars indicated in each image. A-C) Double immunostaining for Iba1 (white) and Brn3b (magenta) of retinal whole mounts. A) This view of the entire central retina, at the levels of the NFL and GCL, reveals both the geometry of the microglial mosaic and their distribution in relation to RGC nuclei. B) A higher magnification view of the GCL shows the localization of perivascular microglia (vertically across the center of the field), and of the parenchymal microglia intersperse between RGCs. C) A close up of RGC nuclei and microglia with diverse shape and complexity. Between 1 and 3 mo of age, we detect an approximate ratio of 1:18 microglia to RGCs along different GCL eccentricities. D) Double immunostaining for Iba1 (white) and MAP1 (magenta) of retinal sections spanning the GCL and IPL, shows the finest branches of microglial processes in direct apposition to RGC dendrites. E-G) Double immunostaining for Iba1 (white) and pNF (blue) of retinal whole mounts imaged at the NFL level. RGC axon bundles extend across the retina towards the optic disc (asterisk). Microglia intercalate with these bundles. F) A close up view of the optic disc region shows the dense coverage of microglia processes branching along the NFL, as well as the clustering of microglia at the optic disc. G) An individual microglial cell is shown with its soma and a thicker primary process stretching along a single RGC axon, while other very ramified processes from this cell reach across an axon bundle. The distance between microglial somata positioned along an axon bundle varies between 100 and 500 μm. H) A cross-section of the myelinated optic nerve shows the local population of microglial cells. The density of microglial cells is lower in the left region of the nerve where axonal pNF expression is normal. In comparison, the right half of the nerve shows abnormally reduced pNF expression and a higher density of microglia.
Regarding RGC axons, the bundles of unmyelinated axons that extend from all retinal eccentricities toward the optic disc (Fig. 3E; here immunostained for phosphorylated neurofilament) are escorted by NFL microglia, which become dense and lose their tiled regularity at the optic disc (Fig. 3F). Microglial somata orient along individual RGC axons, and extend their processes toward nearby bundles (Fig.3G). Within the optic nerve, abundant microglia intercalate along the course of myelinated axon fascicles (Fig. 3H). Thus both microglial somata and/or processes are contiguous to all RGC compartments, somata, dendrites and their post-synaptic areas, as well as to unmyelinated and myelinated axons.
Microglia are adjacent to Müller and astrocytic processes
Astrocyte and Müller glia reactivity is associated with D2 glaucoma progression, and recent research has focused on the role of glia in the initial alterations detected in the ONH and OL (Howell et al., 2007; Inman and Horner, 2007; Jakobs et al., 2005; Schlamp et al., 2006; Soto et al., 2008). Since the potential triggers for gliosis are signals from RGCs and/or between glia, we assessed the spatial relationship of microglia to other glial populations. Within the retina, microglia are close neighbors to astrocytes and Müller glial cells. Within the retinal vitreal surface, microglia localize underneath the astrocytic network contained within the NFL (Fig. 4A), and also along perivascular astrocytes (Fig. 4B). In relation to Müller glia (here immunostained for aquaporin-4), microglia appose Müller end feet in the GCL (Fig. 4C, arrow), align their processes with the radial Müller somata across the INL, and extend horizontal processes along Müller outer processes at the OPL level (Fig. 4C). Within the ONH, microglia concentrate in the innermost side, as well as in the ONH periphery, always intermingled with the dense mesh of astrocytes (Fig. 4D). The close spatial proximity between microglia and astrocytes is maintained in the OL (Fig. 4D, E), where microglial cells are laid in a transverse mosaic of coplanar somata. These microglia project processes across the nerve, as well as thick primary processes perpendicular to longitudinal columns of astrocytes (Fig. 4D), which constitute what has been described as a “glial lamina” (Howell et al., 2007; Sun et al., 2009). A high-magnification view of the OL in cross-section (Fig. 4G) shows that the glial tubes defined by astrocytes (dashed circles; in Sun et al., 2009 compare with Fig. 9A, B) are partially lined by microglial processes and somata. The transition zone from OL to ON, where axons become myelinated by oligodendrocytes contains a somewhat sparser microglia population that does not show a preferential spatial orientation, and intercalates with astrocytes (Fig. 4D). At the ON, microglia somata and primary processes adopt the same transverse orientation shown by astrocytes (Fig. 4F). The optic nerve head and laminar regions, the presumed sites of initial optic neuropathy in D2 mouse glaucoma (Howell et al., 2007; Soto et al., 2008), are rich in microglia localized in close apposition to the astrocytic meshwork.
Figure 4. Microglia and astrocytes are contiguous to all RGC compartments.
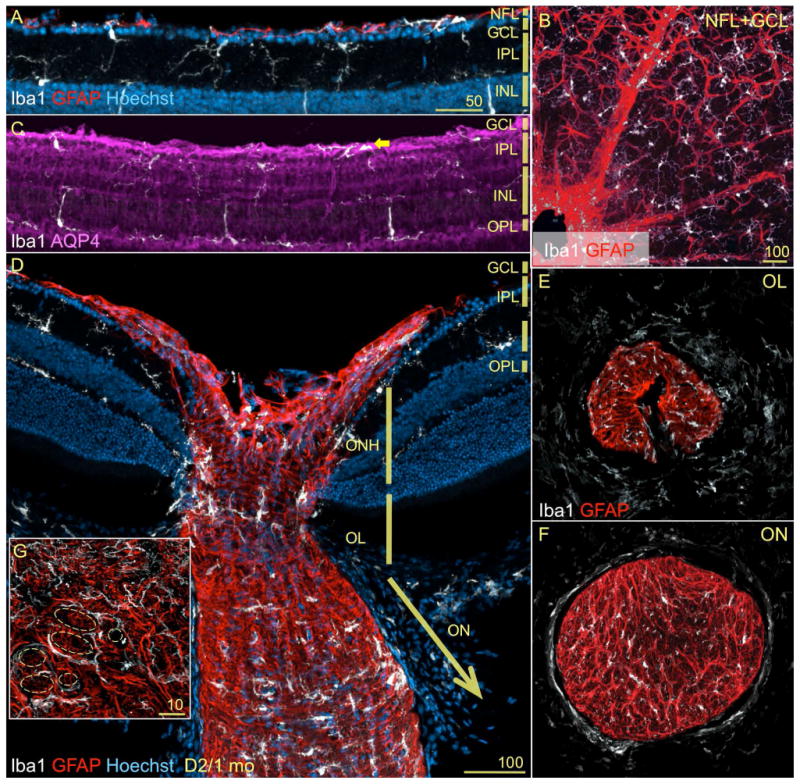
A, B-F) Retina double stained for Iba1 (white) and GFAP (red). A) A lateral view of the innermost layers of the peripheral retina from 1mo D2 mice, show that microglia and astrocytes (GFAP+) are adjacent to each other and to the monolayer of RGCs at the NFL. B) A whole mount view of a retina identically stained, displays the distribution of astrocytes with end feet wrapped around blood vessels, in close proximity to perivascular microglia. In the parenchyma, astrocytes organize as a continuous network, while microglia tile regularly. C) The aquaporin-4 immunostaining shows the radial Müller glia, whose end feet neighbor microglia at the GCL. Within the plexiform layers, microglia juxtapose Müller cell processes. D) The same field shown in Fig. 2A, is shown here with astrocytes stained with GFAP. The complex scaffold of astrocytes at the ONH and along the proximal optic nerve is contiguous to the subsets of microglia localized with a more restricted and differential pattern. Within the optic nerve (ON), microglia and astrocytes adopt a similar transverse orientation. E, F) Cross-sections of the proximal optic nerve regions (shown as single channel in Fig. 2E, F). E) Astrocytic processes within the OL delimit oval tunnels, where microglia localize peripherally. F) This organization is maintained within the initial segment of the ON. Here, there are relatively more abundant and smaller tunnels delimited by astrocytes, where a rich array of microglia is present. G) A high magnification view of the OL shows that microglial somata and processes line the glial tunnels (dashed shapes).
Microglia activation can be assessed by monitoring changes in Iba1 expression
Iba1 mRNA and protein expression has been used to identify microglia and macrophages in the adult rodent retina and ONH, as well as to monitor changes in their activation state (Bosco et al., 2008; Inman and Horner, 2007; Johnson et al., 2007; Joly et al., 2009; Naskar et al., 2002; Santos et al., 2008; Saraswathy et al., 2006). To establish the reliability with which Iba1 fluorescent immunostaining allows the visualization of retinal microglial soma and processes, we compared the magnitude of Iba1 immunostaining with the expression of GFP driven by the fractalkine receptor (Cx3cr1) locus in B6.129-Cx3cr1tm1Litt/J mice (Checchin et al., 2006; Eter et al., 2008; Joly et al., 2009; Kezic et al., 2008; Lee et al., 2008; Liang et al., 2009; Raoul et al., 2008; Xu et al., 2009). A whole mount view of an entire retina, spanning the NFL and GCL levels (as a maximal intensity projection of ∼20 μm), displays the regular mosaic of microglia visible by their GFP expression (Fig. 5A). A close up view of the central retina reveals the high degree of overlap between GFP and Iba1 expression (Fig. 5B, white areas). At higher magnification, the view of individual channels in a single optical slice (Fig. 5C-E) show that both parenchymal and perivascular microglia (blood vessel location indicated with line) can be clearly visualized by Iba1 staining. At the single cell level, Iba1 and GFP expression show complete overlap within the cell soma (Fig. 5F-H) and throughout most of the cell processes, although their signal fails to coincide in the finest ramification, where only GFP labels the terminal branches (green tips in F, arrows). The codification of the expression levels of Iba1 protein using pseudocolors (see scale at bottom of 5J) shows the non-uniform intensity across the cell mosaic (Fig. 5I). Within individual cells, Iba1 expression peaks in the soma, while in the processes expression is high at branch points, relatively dimmer along the processes, and at background levels in the tips (Fig 5J). To determine the extent of colocalization between GFP and Iba1 fluorescence, retinal whole mounts double-immunostained for GFP and Iba1 were imaged by confocal microscopy at high resolution (Suppl. Fig. 4A-C), followed by image analysis to determine both colocalization and fluorescence intensity. The surface plot representation of the intensities GFP-Alexa Fluor 488 nm and Iba1-Alexa Fluor 555 nm emissions for this inner retinal optical slice depict a more uniform high signal for GFP, and a heterogeneous Iba1 signal (Suppl. Fig. 4D, E). The scattergram of GFP vs. Iba1 colocalization indicates high degree of overlapping pixels between the GFP and Iba1 signals (Suppl. Fig. 4F), which was reproduced at all retinal eccentricities and depths (see movie spanning the NFL to OPL layers around the optic disc and ONH in Suppl. Fig. 3).
Figure 5. Iba1 reliably labels the entire mosaic of microglia resident in the retina.
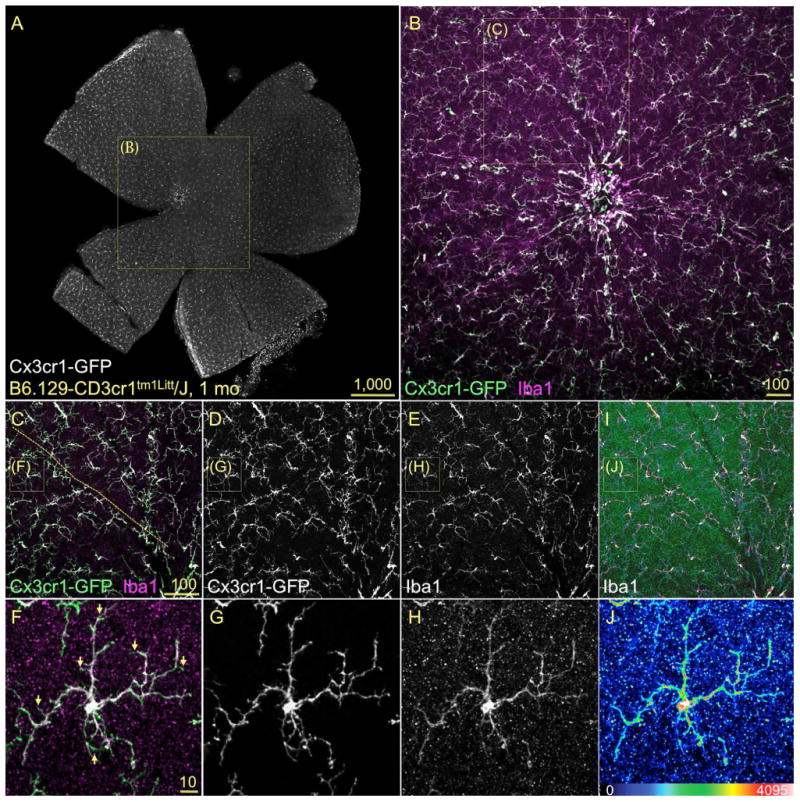
Confocal images of flat mounted retinas immunostained for Iba1 in 1mo GFP-Cx3cr1 mice, showed as maximum projection of innermost 25 μm. A) A view of the entire inner retina showing GFP+ microglia localized to the NFL and GCL. B) The retinal central field (box in A) displays the microglia co-expressing GFP (green) and Iba1 (magenta) with high localization (white areas), both around the optic disc and all towards the peripheral regions. C-E) The observation of the overlay and single channels at higher magnification (box in B) reveals that the overlap of Iba1 and GFP extend throughout the mosaic, both in parenchymal and perivascular microglia (vessel location indicated with dashed line in C). F-H) At the cell level (box in C-E), the overlay of GFP and Iba1 signals shows almost complete colocalization (F, white), spanning the cell soma and the complex ramifications, except for the finest processes (F, arrows). I-J) The color-coding of Iba1 expression intensity denotes variable expression levels within the mosaic and between different cell compartments. Maximal Iba1 expression intensity localizes to soma and branching points, with lowest levels extending the length of the cell processes.
Next, we determined whether quantitative real time PCR could detect variations in Iba1 mRNA expression levels across retinal samples at different ages. We also compared the dynamic range of Iba1 gene expression versus other microglial/macrophage markers regulated during activation or phagocytosis, within individual samples of D2 central retina/ONH. Across samples at 1 and 3 months of age (Suppl. Fig. 6), the increasing levels of Iba1 expression were closely mimicked by CD115 (CSF-1 receptor), with Iba1 having the higher range of expression at both ages. In contrast, the expressions of F4/80 (EMR1) and the macrosialin CD68, a non-selective lysosomal glycoprotein enriched in phagocytic microglia and macrophages, were poorly regulated in these retina samples and thus appear to be less reliable markers for monitoring activation.
The quantitative use of Iba1 as a readout for changes in microglial cell activation levels was previously correlated with cell soma enlargement and shape simplification (Bosco et al., 2008). Therefore, in this study we have used confocal microscopy and Iba1 immunostaining to examine changes in retinal microglia numbers and distribution, and as a semi-quantitative method to detect changes in Iba1 expression levels. Concomitantly, we used qRT-PCR analysis of Iba1 mRNA expression to monitor the relative levels of microglia activation in different retinal and unmyelinated optic nerve regions.
Early clustering of microglia is confined to the ONH, exclusively in D2 mice
To determine whether microglial changes associate with specific stages during chronic glaucoma progression, we sought to define the pattern of microglia activation over time in the D2 retina, optic nerve head and lamina. Since the earliest signs of RGC axonal damage localize to the unmyelinated laminar region in D2 optic nerves immediately distal to the ONH and retina (Howell et al., 2007; Soto et al., 2008), we sought to define whether microglia localized in these regions undergo changes indicative of cell activation and/or redistribution. We compared both cell density and signs of activation in D2 mice starting at prepathological ages (1 month) through ages when RGC axonal and somal pathology is known to prevail (up to 12 months; Buckingham et al., 2008; Crish et al., 2010; Howell et al., 2007a; Jakobs et al., 2005; Libby et al., 2005a,b; Reichstein et al., 2007; Schlamp et al., 2006; Soto et al., 2008). Next, we carried out identical analysis in age-matched D2G non-glaucoma mice.
In whole mount preparations of age-matched D2 (Fig. 6A-T) and D2G retinas (Fig. 6A′-T′), we examined the expression of Iba1 by immunofluorescence. We imaged fields centered in the optic disc and ONH or in the dorsal mid-peripheral retina, spanning the NFL to IPL or the OPL. Maximum intensity projections images representative of each condition show Iba1 staining in pseudocolors to reveal the diverse levels of Iba1 expression (color code as in Suppl. Fig. 4E, with black = 0 to white =4095 intensity levels). In 1-month-old D2 mice, the central retina and ONH contained few microglia localized to the inner layers and deeper around the ONH, mostly expressing intermediate levels of Iba1 (Fig. 6A, F). At 3 months of age, the same field displayed a peak of microglia clustering and Iba1 expression, spanning both the inner and outer retina layers (Fig. 6B, G). cells maintained strong Iba1 expression and enlarged microglia were localized farther from the ONH (Fig. 6C, D, H, I). By 12 months, microglial cells drastically reduced their numbers and levels of Iba1 expression at all depths (Fig. 6E, J).
In contrast, microglia residing at the dorsal mid-periphery in the inner D2 retina (Fig. 6K-O)) displayed increasing cell density and size with age, showing large elongated somata and process coverage by 8 months (Fig. 6N). However, these changes were not detectable in microglia positioned deeper in the OPL (Fig. 6P-T), which become relatively more conspicuous by 8 and 12 months, but maintain finely ramified arbors and low Iba1 expression (Fig. 6S, T). These data suggest that microglia residing in the central retina and ONH undergo activation at earlier ages (3 months) while microglia localized at the retinal periphery activate later (8 months) in D2 mice.
To corroborate whether the early changes in microglia phenotype detected in the central retina are specifically related to glaucoma onset and/or progression in D2 mice, we repeated the analysis in D2G mouse retinas. At 1 month of age, microglia that were localized to the inner depths of the central retina and ONH showed similar cell density as in D2 retina, but weaker Iba1 expression (Fig. 6A′). Strikingly, no microglial changes indicative of cell activation were visible at 3, 5 or 8 months of age. Throughout these ages, microglia maintained weak Iba1 expression at all retinal depths (Fig. 6B′-D′, G′-I′). At 12 months microglia appeared clustered and expressed higher Iba1 levels, but this was moderate in comparison to old D2 mice (Fig. 6. E′, J′). D2G mid-peripheral retina contained inconspicuous microglial cells throughout its entire depth at all ages (Fig. 6K′-T′). Thus, Iba1 immunostaining detects an early upregulation of Iba1 expression selectively localized to the central retina and ONH in 3-month old D2 mice, which is absent in the age and strain-matched D2G control mice.
Microglia activation peaks in 3-month-old D2 central retinas and unmyelinated nerve
To quantify this early functional activation and clustering of microglia in the central retina/ONH/OL, the levels of Iba1 expression were measured both at the mRNA and protein levels. The regulation of Iba1 protein was examined by measuring the intensity of fluorescence following immunostaining of the central retina and ONH, excluding the OL for technical reasons (see Methods). We performed this analysis at 1, 3, 5, 8 and 12 months of age in D2 and D2G mice (Fig. 7A). At 1 month of age, both mouse strains showed no significant difference in Iba1 intensity levels. But, by 3 months of age, we detected an intense upregulation in Iba1 expression exclusively in D2 retinas. This was followed at 5 months by a slight reduction in Iba1 expression, which stayed unchanged through the 8 and 12 month ages sampled. In contrast, the early increase detected in D2 is absent in D2G central retina and ONH, which only moderately upregulated Iba1 intensity at 5 months, although to a lower extent than D2, finally reaching similar levels by 8 and 12 months of age. This analysis detects a peak of Iba1 upregulation in cells localized to the central retina and ONH in 3-month old D2 mice, which is unrelated to changes in cell density. This event is absent in control D2G mice. We report the individual mean intensity values of Iba1 expression in D2 to exhibit the variations in Iba1 levels throughout samples at each age analyzed (Suppl. Fig. 5).
Figure 7. Iba1 upregulation is an early event in D2 central retina and proximal optic nerve compartments.
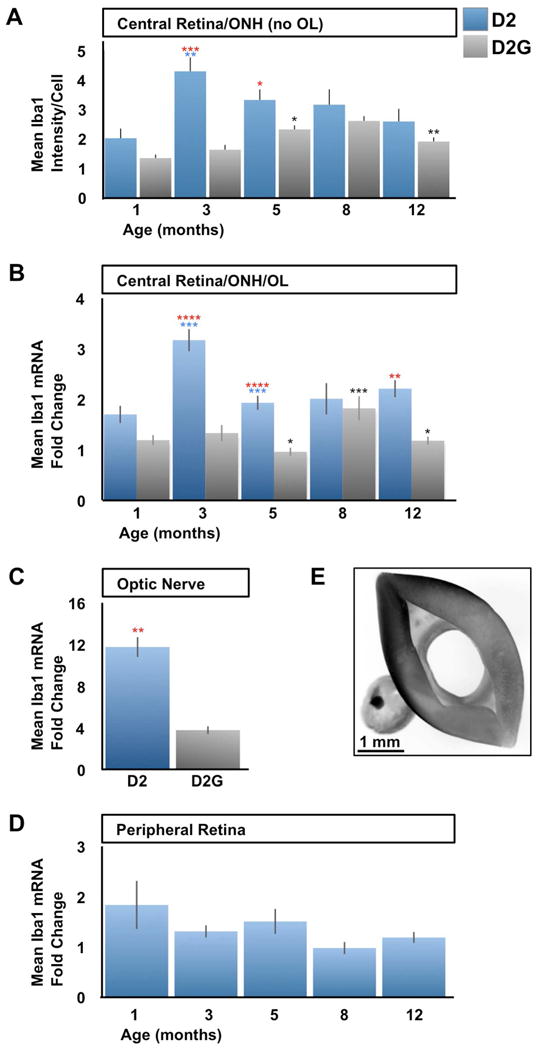
Quantitative analysis of Iba1 protein and mRNA expression in D2 vs. D2G mice. A) Densitometric analysis of the intensity of Iba1 immunofluorescence (Alexa Fluor 555) emission per cell located at the NFL, GCL and IPL, within the central retina and ONH. Iba1 intensity is expressed as mean intensity per cell. At 1mo, D2 and D2G express comparable Iba1 levels (P<0.08). By 3 months of age, D2 samples upregulate Iba1 (2.1x in average), above D2G levels (2.6x). At 5 months of age, D2 decreased their Iba1 expression (0.8x) to intensity yet above that of D2G (1.4x). Afterwards, D2 central retinas and ONH samples stabilized their average Iba1 intensity levels, which were matched by the slow increase of Iba1 expression in D2G starting at 5 months of age. B-D) Iba1 mRNA expression is shown as mean fold change, normalized to beta-actin expression within each sample. B) Quantification of Iba1 mRNA expression levels within the central retina, ONH and lamina (OL). Iba1 mRNA expression peaks at 3-months of age in D2 mice (1.9x in average), followed by a significant reduction by 5 months (0.6x) which continues unaltered at later ages. D2G samples showed similar expression levels to D2 at 1 month of age, was less than half the D2 levels at 3 and 5 months (P<0.0001), to only match D2 levels by 8 months. By 12 months, D2G Iba1 expression dropped again to 1-5 month-levels. C) At 3 months of age, the proximal optic nerve of D2 mice showed significant upregulation of Iba1 mRNA relative to D2G samples (3x in average). D) Iba1 mRNA levels are maintained relatively low and unaltered across ages in D2 peripheral retina. E) Microphotograph showing the central retina compartment with attached lamina region (left) dissected out of the remaining peripheral retina (right). For panels A-D sample sizes per bar were, n=10 (A), n=10-15 (B), n=10 (C), and n=5 (D). Data within each mouse strain were compared for each age with the previous age (D2, blue asterisks; D2G, black). At the same age, red asterisks represent comparisons between D2 and D2G samples. Comparisons 2-tailed t-test P< 0.05 (*), < 0.01 (**), < 0.001 (***), < 0.0001 (****). Error bars represent S.E.M.
Next, to confirm this early microglia activation within the central retina and ONH we investigated whether the increased expression of Iba1 protein coincided with the upregulation of Iba1 mRNA expression. We performed quantification of the Iba1 mRNA expression in samples comprising the central retina, ONH and now including the OL (Fig. 7E, left), and found significant differences in Iba1 mRNA expression across age groups of D2 mice (Fig. 7B; ANOVA, p<0.01). Like in the previous analysis of protein expression, 3-month old D2 mice showed a prominent elevation in Iba1 mRNA expression. At 5 months of age, Iba1 expression significantly reduced to levels that were sustained at 8 and 12 months of age, with no significant variation. On the other hand, 1-month old D2G mice showed low Iba1 mRNA expression, comparable to age-matched D2 mice. These low levels of expression were maintained at 3 months, and even reduced slightly by 5 months to half the expression values detected in D2. At 8 months, D2G reached comparable levels of Iba1 mRNA expression to D2 samples, and finally dropped by 12 months to levels about half in average to those measured for D2. A similar analysis of Iba1 mRNA expression was performed using the central retinas/ONH from age-matched C57/Bl6 mice, which only showed a moderate elevation in Iba1 expression by 12 months of age (data not shown).
Next, we determined whether the early peak of microglia activation detected within the central retinal compartment, including the ONH and OL did extend to nearby regions, including the proximal optic nerve and the peripheral retina. Identical qRT-PCR analysis of Iba1 mRNA expression was carried out in samples of the first 1-mm of myelinated optic nerve in 3 month-old D2 and D2G mice (Fig. 7C). D2 optic nerve samples showed an intense upregulation of Iba1 expression in relation to D2G. Last, we compared the profile of Iba1 mRNA regulation in the peripheral neural retina of 1 to 12 month-old D2 mice (Fig. 7D). This analysis detected similar low levels of Iba1 expression from 1 to 12 months of age (Fig. 7D). The early increase of Iba1 mRNA expression in D2 central retina/ONH/OL and proximal nerve is in agreement with the temporal pattern of Iba1 protein expression detected in the retina/ONH by immunostaining. All together, these data confirm the early elevation of Iba1 expression in cells confined to the central retina, optic nerve head, lamina and proximal myelinated portion, which is unique to D2 mice.
Microgliosis accompanies early activation in D2
The local expansion of the microglial population (microgliosis) likely contributes to the clustering observed in the D2 central retina and ONH, as well as to the Iba1 mRNA upregulation. In support of this, previous analysis of the D2 retina demonstrated a moderate proliferation of resident microglia resulting in a twofold increase in the number of cells from 4 to 10 months of age (Inman and Horner, 2007). In order to determine the presence and degree of microgliosis in D2 mice, we examined whether a microglial cell density increase concurred with Iba1 upregulation and the observed clustering in the retina and ONH. We compared the counts of microglia within the central and peripheral retinal fields across ages, separating the counts for the inner (NFL to IPL) versus the outer retinal depths (OPL). Within the central retina and ONH, the density of microglial cells present in the inner layers (Fig. 8A) at 1 month of age was comparable between D2 and D2G mice (220-280 cells/mm2). By 3 months, the number of microglia increased in both strains, reaching significance only in D2 mice (310-350 cells/mm2). At 5 months, D2 samples had even a higher density of microglia (∼415 cells/mm2), well above D2G samples (230-300 cells/mm2). By 8 months of age, the density of microglia was comparable in D2 and D2G (400-500 and 370-400 cells/mm2, respectively), and at 12 months, microglia numbers dropped similarly in both strains (190-320 and 210-240 cells/mm2, respectively). At later ages, D2G changes mimic those found in D2.
Figure 8. Microgliosis coincides with microglia activation in D2 retina and ONH.
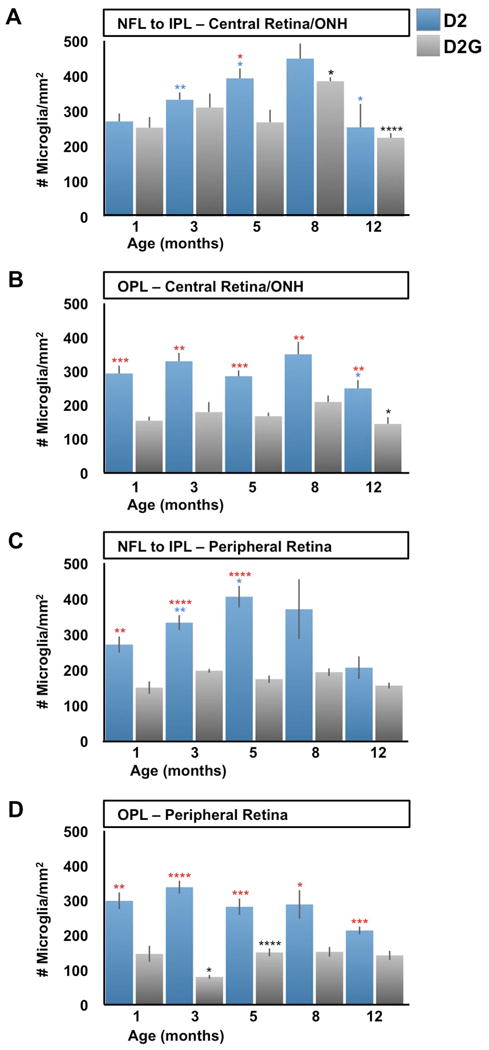
Microglia cell density (cell/mm2) was calculated from confocal images spanning the retinal and ONH depth from the NFL to the OPL in D2 and D2G mice aged 1 to 12 months. A) The numbers of microglia localized to the inner depths of the central retina and ONH show a significant increase in D2 samples from 1 month to 3 and 5 months of age (>1x in average). This trend continues at 8 months then decreases to about half the density by 12 months (P<0.05). However, D2G showed similar cell density to D2 at 1 and 3 months, which were maintained at 5 months, differing from D2's counts (1.5x higher in average). At 8 months, D2G increased their microglia density to levels comparable to D2, which showed a similar drop at 12 months. B) Microglia localized at the OPL in the central retina and ONH had the same density as those in the NFL to IPL in 1-month-old D2, and only decreased at 12 months (0P<0.05). In contrast, D2G OPL consistently maintained at all ages half the numbers of microglia found in D2 (P<0.001). C) At the mid-peripheral retina, microglia localized to inner layers changed with similar pattern to the inner central retina in D2 mice, except for statistical differences. Thus, they showed increases at 3 (1.2x in average) and 5 months, decreasing by 12 months. However, the cell counts in D2G samples maintained relative low densities, significantly below D2 values (1.7-2.3x higher in average). D) Deeper levels of the peripheral retina roughly followed the same changes described for the OPL at the central retina in both D2 and D2G mice, except for D2G having even lower densities of microglia at 3 months. A-D) Sample sizes per bar were, n=10. Comparisons represented as in Fig 7.
However, within the OPL D2 and D2G microglia densities showed consistent differences (Fig. 8B). At 1 month of age, D2 samples had a microglia density comparable to the inner layers (270-315 cells/mm2), and this density was maintained until 12 months of age (∼ 250 cells/mm2 in average). Throughout the same ages, D2G samples had half (150 cells/mm2 in average) the microglia density measured in D2 samples. In conclusion, microglia localized to the inner layers at the central retina and ONH start at similar density in D2 and D2G, and only in D2 show a modest and consistent increase by 3 and 5 months of age. While, microglia resident in the OPL maintain a similar density at all ages in D2 and D2G, with twice as many microglia in D2 compared to D2G.
Within the dorsal mid-peripheral retina, the number of microglia in D2 mice increased over time in the inner layers (Fig. 8C) with a similar dynamic to the changes affecting the central retina: starting with identical density (270 cells/mm2 in average) at 1 month, followed by elevated counts at 3 and 5 months (∼330 and 400 cells/mm2, respectively), then density maintained at 8 months and lowered by 12. In contrast, the same region in D2G retinas showed almost constant low densities (150 to 200 cells/mm2) throughout all ages. Again, the peripheral OPL showed changes similar to those described for the central OPL (Fig. 8D). D2G showed reduced microglia density, resembling the findings in the inner peripheral retina (∼ 80-150 cells/mm2).
This analysis detects early and moderate microgliosis in the inner layers of the central D2 retina (and ONH), which is more manifest in the peripheral retina. Deeper in the OPL, microglia numbers are stable throughout the analyzed ages. These changes in microglia density were not found in D2G mice, which showed late changes in their content of microglia within the inner retina, and very low density of OPL microglia at all retina eccentricities. These data suggest that the clustering detected in ONH and central retinal of young D2 mice is due in part to microgliosis.
Discussion
Microglial changes in the D2 retina
As the resident immune surveillance cells of the CNS, microglia are exquisitely sensitive to tissue stress and injury, and are linked to multiple neurodegenerative diseases, including glaucoma (Hanisch and Kettenmann, 2007; Neufeld, 1999). The D2 mouse has emerged as an important animal model of chronic glaucoma, and is characterized by iris atrophy leading to pigment dispersion, followed by IOP elevation and an age-related, progressive decline in RGCs (Libby et al., 2005). We perform a detailed analysis of microglial activation and cell numbers and found selective early microgliosis, clustering and activation of microglial cells in the D2 inner central retina/ONH.
Previous microarray analysis of the D2 retina detected significant upregulation of genes potentially associated with microglial activation by 5 and 8 months of age (Steele et al., 2006), and between 2 and 4 months of age, prior to IOP elevation (Fan et al., 2010). Consistent with microgliosis, there is a doubling of retinal Iba1-positive cell numbers from 4 to 10 months of age (Inman and Horner, 2007), with no concrete evidence for macrophage infiltration into the retina (Schuettauf et al., 2004). Our analysis strengthens the conclusion that microglial activation and recruitment are early events in the D2 model of glaucoma.
Importantly the early microglial changes were not detected in young control D2G animals. Old D2G mice showed microglial changes since 8 months, probably indicative of age-related activation (reviewed by Xu et al., 2009). D2G mice are genetically identical to D2 mice (including the Tyrp1b mutation), but are wild type for Gpnmb. D2G mice suffer some iris disease due to the Tyrp1b mutation, but do not develop a glaucoma phenotype (Howell et al., 2007). This latter fact and previous studies suggest that Gpnmb, the only allele that genetically distinguishes D2 from D2G, is the candidate gene contributing to the anterior segment and glaucoma pathologies in D2 mice (Anderson et al., 2008). Interestingly, Gpnmb is present in the macrophage/microglia (monocytic) lineage, consistence with a role for bone marrow-derived cells in D2 glaucoma (Anderson et al., 2008; Ripoll et al., 2007). Gpnmb is referred to as an inflammation suppressor gene, and potentially an anti-inflammatory product (Ripoll et al., 2007). In D2, the inactivating point mutation in Gpnmb (Mo et al., 2003) codifies a truncated form of Gpnmb, which likely results in a proinflammatory macrophage phenotype (Ripoll et al., 2007). Additionally, Gpnmb downregulation was detected in 4-month-old D2 retinas, which may contribute to the immune alterations (Fan et al., 2010). The findings reported here, and the previously reported evidence, raise the possibility that the microglial alterations specifically detected in the D2 retina and unmyelinated regions of the optic nerve are linked to the dysregulation of Gpnmb function. We hypothesize that the early and long-term activation and redistribution of microglia in close proximity to RGCs are pathogenic in this model of glaucoma.
Microglial activation has been associated with other models of RGC pathology, as well as with human glaucoma. For example, reactive microgliosis has been documented in animals with optic nerve axotomy (Thanos, 1991), ischemia (Chauhan et al., 2002) and acute ocular hypertension (Wang et al., 2000; Naskar et al., 2002; Lam et al., 2003; Johnson et al., 2007). Furthermore, gene expression analysis of retina and/or ONH from acute ocular hypertension models or chronic inherited glaucoma models reveals striking similarities in gene regulation patterns, all consistent with microglial involvement (Johnson et al., 2007; Lam et al., 2003; Steele et al., 2006; Wang et al., 2000). In glaucoma patients there is clustering and redistribution of microglia specifically in the region of the optic nerve head (Neufeld, 1999), which is associated with microglial proliferation and upregulation of various inflammatory molecules including TNF-α and TGF-β1 (Yuan and Neufeld, 2001). We have extended these findings by showing that microglial activation and recruitment is an early event rather than simply a late consequence of RGC degeneration, and that multiple RGC compartments are potentially impacted at different stages of the disease. Thus microglia should be considered as central players in the pathophysiology of glaucoma.
Microglia and RGC compartments
We document a close spatial relationship between microglia and multiple RGC compartments prior to onset of neurodegeneration. For example, microglia are tiled within the NFL near RGC somata and intra-retinal axons. Microglia also form another mosaic within the IPL, close to RGC dendritic arbors and post-synaptic areas. Finally, as RGC axons exit the eye to form the optic nerve, microglia reside in close proximity with their unmyelinated segments within the ONH (pre-lamina region), the glial lamina (which is analogous to the primate lamina cribosa), as well as to the proximal myelinated region of the nerve. Thus, microglia impact all key RGC compartments and are poised to locally respond to RGC stress or injury.
Consistent with this, we documented microglial changes with age within each of these compartments in D2 mice. However, there was considerable asynchrony between compartments, suggesting that the microglial responses are triggered locally at different stages of the disease. We first observed clustering and activation of microglia in the central retina and ONH of D2 mice at 3 months of age. The localization of reactive microgliosis to the ONH in the D2 retina is consistent with studies in other models. For example, microarray analysis of the ONH region after acute ocular hypertension in a rat model of glaucoma revealed complex gene expression changes indicating microglial involvement, which was directly verified by showing a linear correlation between Iba1 mRNA/protein upregulation and severity of optic nerve injury (Johnson et al., 2007). The localization of activated microglia to the ONH is significant, since in both humans and animal models of glaucoma the optic nerve head/glial lamina region is the earliest site of detectable damage to the optic nerve (Howell, 2007; Jakobs et al., 2005; Quigley, 1993). Axonal damage presumably causes a retrograde degeneration that leads to loss of RGC somata (Neufeld and Liu, 2003). It has been proposed that axons may be damaged in the ONH region due to mechanical stress (Howell, 2008), which could lead to microglial activation (reviewed in Cui et al., 2008). Alternatively, RGC stress, local ischemia and hypoxia, or signals from other cell types, such as astrocytes, may also play a role. The signals driving the clustering and activation of microglia in the ONH remain to be defined.
At later stages of disease, there is sectorial loss of RGCs in the D2 retina (Danias et al., 2003; Jakobs et al., 2005; Schlamp et al., 2006), preceded by axonal transport dysfunction and severing of axons in the ONH. This causes rapid Wallerian degeneration of the distal axon and accumulation of cytoskeletal elements such as phospho-neurofilament in the intra-retinal axon segment before the RGC is lost (Howell et al., 2007; Soto et al., 2008; Whitmore et al., 2005). We acknowledge that there may be focal changes in retinal microglia associated with this sectorial decline in RGCs. Future analysis will assess the relationship between RGC compartmentalized decline, sectorial loss and microglia activation in the D2 retina. We predict the existence of multiple phases of microglial involvement affecting different phases of RGC decline.
Early versus late glaucomatous changes
Much like the human disease, progression of glaucomatous changes in D2 mice is asynchronous and variable across individuals (Inman et al., 2006; Libby et al., 2005; Schlamp et al., 2006). Our observation of microglial clustering and activation in the ONH region in 3 month-old D2 mice is among the earliest reported changes in the D2 eye. This was not observed in control D2G mice, pointing to very early involvement of microglia in glaucoma-like changes. The microglial changes detected precede ages when RGC pathology has been documented, such as post-synapse loss (by 5 months of age; Stevens et al., 2007), axonal transport decline, and frank structural loss of axons (detectable since 3-5 months of age; Crish et al., 2010). Somal loss is an even later event, with significant decline in RGC number after 10-12 months of age (Libby et al., 2005a, Schlamp et al., 2006). So if the neurodegeneration is late, then what is the significance of the early microglial activation?
There are changes in the D2 eye that have been documented at young ages. For example, the D2 phenotype includes anterior segment dysgenesis, which is biochemically detectable by 3 months of age (Zhou et al., 2005). This leads to iris pigment dispersion, obstructed trabecular meshwork, and secondarily to age-related IOP elevation (John et al., 1998). However, we saw no strict correlation between IOP elevation and microglial activation at young ages (data not shown), even in the rare animals that showed elevated IOP (<20mmHg) as early as 3 months of age. This lack of relation between immune responses in the D2 retina and IOP elevation was recently corroborated (Fan et al., 2010). Thus IOP elevation may not be a contributing factor in these initial changes. Consistent with this, progressive axonal transport deficits in the D2 retina are also not linked with IOP elevation (Crish et al., 2010).
Evidence for relatively early decline in RGC function in advance of neuronal degeneration have been reported in both the D2 eye as well as in human glaucoma. Pattern electroretinogram (PERG) is a tool to monitor RGC function, and this analysis has revealed progressive functional decline beginning at 3 months of age in the D2 strain, suggesting early RGC pathology (Porciatti et al., 2007; Saleh et al., 2007). The early abnormality in RGC function precedes significant axonal or RGC loss, and may represent events related to defects in anterograde axonal transport, which have been reported as early as 3 months of age (Crish et al., 2010), or to RGC synapse remodeling, shown in the IPL of 5 month-old D2 mice (Stevens et al., 2007). In humans, there is a prediction of early ganglion cell dysfunction based upon models of perimetry data that cannot be fully explained by RGC loss (Swanson et al., 2004). Thus decline in neuronal function is an early feature of glaucoma, concurrent to the early microglial changes we report.
Complex roles for microglia in glaucoma pathology
The role of microglia in CNS neurodegeneration remains controversial, likely due to the remarkable complexity of microglial activities, which are still incompletely understood. We have documented significant changes in microglial numbers, distribution and activation that take place in the proximity of distinct RGC compartments, all of which are impacted by glaucoma. This argues for distinct spatial and temporal phases of microglial activity in the disease, with potentially diverse consequences. Early responses of microglia, specifically nearby unmyelinated RGC axons, may reflect an attempt to restore tissue homeostasis following discrete local damage, ischemia or hypoxia, perhaps in an effort to protect optic axons from a compromised blood-brain barrier (Neufeld, 1999). Alternatively, it has been suggested that this may contribute to the parapapillary chorioretinal atrophy that clinically characterizes glaucoma (Neufeld, 1999). More sustained insult or prolonged neuronal stress may lead to microglia becoming reactive and phagocytic, potentially contributing to neuronal decline (Hanisch and Kettenmann, 2007). In support of this idea, we previously showed that reduced axonal transport depends upon microglial activation (Bosco et al., 2008). Interactions with other retinal and optic nerve cell types, such as astrocytes, may also mediate the effects on neuronal integrity. Future studies will further dissect the functional significance of microglial activation in glaucoma onset and progression.
Supplementary Material
Suppl. Figure 1. Specificity of GFP and AQP4 primary antibodies. A-C) Anti-GFP antibody does not stain microglia or other elements within the optic nerve of D2 mice, aged 1 month. D) AQP4 immunostaining overlaps with Müller cell markers. Overlay view of CRALBP (green) and AQP4 staining (red) showing their overlap (yellow) in Müller end feet (NFL/GCL) and processes (across the IPL and OPL). E) A high magnification view of the inbox in D shows AQP4 delineating Müller inner radial processes (GCL/IPL), cell somata (INL), and strong expression within the NFL, GCL, and outer IPL and OPL, retinal depths where vascular plexus are positioned.
Suppl. Figure 2. Intraocular pressure variation with age in D2 mice. The IOP trend in our colony is consistent with previous reports for D2 mice.
Suppl. Figure 3. Animated view of the mosaics of microglia in the central retina and the ONH. Central retina of a 5mo B6.129 Cx3cr1tm1Litt/J mouse showing microglia expressing CX3cr1-GFP (green) and Iba1 (magenta), as well as RGCs with nuclear Brn3 (blue). The movie starts at the NFL and advances through the GCL (where RGC nuclei localize), displaying at deeper levels microglia localized to the IPL and OPL. The clustering of microglia localized to the ONH is seen in the center of the field at all depths. Image correspond to the retina depicted in Suppl. Fig 3C; z-step is 0.7 μm.
Suppl. Figure 4. Colocalization analysis between Cx3cr1-GFP and Iba1. The central retina from a CX3CR1-GFP C57 BL6/J mouse with microglia double-immunostained for GFP and Iba1 was used to quantify the degree of overlap between GFP and Iba1. A, B) Single channel views of GFP and Iba1 show the presence of both signals within the same cells. C) The overlay of GFP (green) and Iba1 (magenta), again, shows qualitatively the degree of overlap between the signals (white areas). D, E) Intensity plots of GFP and Iba1 signals showing their respective distribution of fluorescence intensity (in pseudocolor scale of 0 to 4095 values). Notice that GFP shows more uniform high expression, while Iba1 shows a more regulated pattern. Some Iba1 cells reach the highest levels, while many have intermediate levels or only above background levels. F) Scattergram of GFP vs. Iba1 signals shows high colocalization (see values in inset). Pearson's correlation > 0.84; Mander's overlap > 0.94; Colocalization coefficients GFP=1, Iba1=1.
Suppl. Figure 5. Raw data of the Iba1 intensity analysis in D2 central/inner retina. Densitometric analysis of the intensity of Iba1 immunofluorescence per cell. Data points (circles) represent mean values per sample, while rectangles indicate mean per age group.
Suppl. Figure 6. Biomarkers of microglia activation. The regulation of Iba1 was compared by qRT-PCR analysis with other microglia/macrophage markers of activation and/or phagocytosis. Data points along each vertical line correspond to an individual sample, and represent the mean expression levels for Iba1, CD115, CD68 and F4/80 within individual D2 central retina/ONH samples at 1 or 3 months of age (n=8). The amplitude of Iba1 expression across samples varies more than any other marker. CD115 and Iba1 expressions correlate the most, although Iba1 has the highest regulation (5.3x vs. a 3.5x across all samples). This suggests the high regulation of Iba1 expression.
Acknowledgments
Funded by a grant from the Melza M. and Frank Theodore Barr Foundation through the Glaucoma Research Foundation (Catalyst for a Cure to MLV), the University of Utah (Center on Aging Grant to MLV) and Fight for Sight (Grant-in-Aid to AB). Tasia Robertson for aid on establishing the D2 mouse colony, and Cesar Romero for excellent technical work. Founder DBA/2J-Gpnmb+/Sj mice were kindly donated by Simon W. R. John.
Literature Cited
- Anderson MG, Nair KS, Amonoo LA, Nehalow A, Trantow CM, Masli S, John SW. GpnmbR150X allele must be present in bone marrow derived cells to mediate DBA/2J glaucoma. BMC Genet. 2008;9:30. doi: 10.1186/1471-2156-9-30. [DOI] [PMC free article] [PubMed] [Google Scholar]
- Anderson DH, Neitz J, Kaska DD, Fenwick J, Jacobs GH, Fisher SK. Retinoid-binding proteins in cone-dominant retinas. Invest Ophthalmol Vis Sco. 1986;27:1015–1026. [PubMed] [Google Scholar]
- Anderson MG, Smith RS, Hawes NL, Zabaleta A, Chang B, Wiggs JL, John SW. Mutations in genes encoding melanosomal proteins cause pigmentary glaucoma in DBA/2J mice. Nat Genet. 2002;30:81–85. doi: 10.1038/ng794. [DOI] [PubMed] [Google Scholar]
- Autieri MV. cDNA cloning of human allograft inflammatory factor-1: tissue distribution, cytokine induction, and mRNA expression in injured rat carotid arteries. Biochem Biophys Res Commun. 1996;228:29–37. doi: 10.1006/bbrc.1996.1612. [DOI] [PubMed] [Google Scholar]
- Block ML, Zecca L, Hong JS. Microglia-mediated neurotoxicity: uncovering the molecular mechanisms. Nat Rev Neurosci. 2007;8:57–69. doi: 10.1038/nrn2038. [DOI] [PubMed] [Google Scholar]
- Bodeutsch N, Thanos S. Migration of phagocytotic cells and development of the murine intraretinal microglial network: an in vivo study using fluorescent dyes. Glia. 2000;32:91–101. doi: 10.1002/1098-1136(200010)32:1<91::aid-glia90>3.0.co;2-x. [DOI] [PubMed] [Google Scholar]
- Bolz S, Schuettauf F, Fries JE, Thaler S, Reichenbach A, Pannicke T. K+ currents fail to change in reactive retinal glial cells in a mouse model of glaucoma. Graefes Arch Clin Exp Ophthalmol. 2008;246:1249–1254. doi: 10.1007/s00417-008-0872-x. [DOI] [PubMed] [Google Scholar]
- Bosco A, Cusato K, Nicchia GP, Frigeri A, Spray DC. A developmental switch in the expression of aquaporin-4 and Kir4.1 from horizontal to Müller cells in mouse retina. Invest Ophthalmol Vis Res. 2005;46:3869–3875. doi: 10.1167/iovs.05-0385. [DOI] [PubMed] [Google Scholar]
- Bosco A, Inman DM, Steele MR, Wu G, Soto I, Marsh-Armstrong N, Hubbard WC, Calkins DJ, Horner PJ, Vetter ML. Reduced retina microglial activation and improved optic nerve integrity with minocycline treatment in the DBA/2J mouse model of glaucoma. Invest Ophthalmol Vis Res. 2008;49:1437–1446. doi: 10.1167/iovs.07-1337. [DOI] [PubMed] [Google Scholar]
- Bosco A, Steele MR, Inman DM, Horner PJ, Vetter ML. Potential role of retinal microglia in RGC synapse removal in DBA/2J mice. Invest Ophthalmol Vis Res. 2009;50 e-abstract 2770. [Google Scholar]
- Buckingham BP, Inman DM, Lambert W, Oglesby E, Calkins DJ, Steele MR, Vetter ML, Marsh-Armstrong N, Horner PJ. Progressive ganglion cell degeneration precedes neuronal loss in a mouse model of glaucoma. J Neurosci. 2008;28:2735–2744. doi: 10.1523/JNEUROSCI.4443-07.2008. [DOI] [PMC free article] [PubMed] [Google Scholar]
- Bunt-Milam AH, Saari JC. Immunocytochemical localization of two retinoid-binding proteins in vertebrate retina. J Cell Biol. 1983;97:703–712. doi: 10.1083/jcb.97.3.703. [DOI] [PMC free article] [PubMed] [Google Scholar]
- Chang B, Smith RS, Hawes NL, Anderson MG, Zabaleta A, Savinova O, Roderick TH, Heckenlively JR, Davisson MT, John SW. Interacting loci cause severe iris atrophy and glaucoma in DBA/2J mice. Nat Genet. 1999;21:405–409. doi: 10.1038/7741. [DOI] [PubMed] [Google Scholar]
- Chauhan BC, Pan J, Archibald ML, LeVatte TL, Kelly ME, Tremblay F. Effect of intraocular pressure on optic disc topography, electroretinography, and axonal loss in a chronic pressure-induced rat model of optic nerve damage. Invest Ophthalmol Vis Sci. 2002;43:2969–2976. [PubMed] [Google Scholar]
- Checchin D, Sennlaub F, Levavasseur E, Leduc M, Chemtob S. Potential role of microglia in retinal blood vessel formation. Invest Ophthalmol Vis Sci. 2006;47:3595–3602. doi: 10.1167/iovs.05-1522. [DOI] [PubMed] [Google Scholar]
- Crish SD, Sappington RM, Inman DM, Horner PJ, Calkins DJ. Distal axonopathy with structural persistence in glaucomatous neurodegeneration. PNAS. 2010;107:5196–5201. doi: 10.1073/pnas.0913141107. [DOI] [PMC free article] [PubMed] [Google Scholar]
- Cui Q, Yin Y, Benowitz LI. The role of macrophages in optic nerve regeneration. Neuroscience. 2009;158:1039–1048. doi: 10.1016/j.neuroscience.2008.07.036. [DOI] [PMC free article] [PubMed] [Google Scholar]
- Danias J, Lee KC, Zamora MF, Chen B, Shen F, Filippopoulos T, Su Y, Goldblum D, Podos SM, Mittag T. Quantitative analysis of retinal ganglion cell (RGC) loss in aging DBA/2NNia glaucomatous mice: comparison with RGC loss in aging C57/BL6 mice. Invest Ophthalmol Vis Sci. 2003;44:5151–5162. doi: 10.1167/iovs.02-1101. [DOI] [PubMed] [Google Scholar]
- Davies MH, Eubanks JP, Powers MR. Microglia and macrophages are increased in response to ischemia-induced retinopathy in the mouse retina. Mol Vis. 2006;10:467–477. [PubMed] [Google Scholar]
- Day M, Wang Z, Ding J, An X, Ingham CA, Shering AF, Wokosin D, Ilijic E, Sun Z, Sampson AR, Mugnaini E, Deutch AY, Sesack SR, Arbuthnott GW, Surmeier DJ. Selective elimination of glutamatergic synapses on striatopallidal neurons in Parkinson disease models. Nat Neurosci. 2006;9:251–259. doi: 10.1038/nn1632. [DOI] [PubMed] [Google Scholar]
- Deininger MH, Meyermann R, Schluesener HJ. The allograft inflammatory factor-1 family of proteins. FEBS Lett. 2002;514:115–121. doi: 10.1016/s0014-5793(02)02430-4. [DOI] [PubMed] [Google Scholar]
- Douglas RM, Lai JCK, Bian S, Cummins L, Moczydlowski E, Haddad GG. The calcium-sensitive large-conductance potassium channel (BK/MAXI K) is present in the inner mitochondrial membrane of rat brain. Neurosci. 2006;139:1249–1261. doi: 10.1016/j.neuroscience.2006.01.061. [DOI] [PubMed] [Google Scholar]
- Du J, Tran F, Fu C, Sretavan DW. Upregulation of EphB2 and ephrin-B2 at the optic nerve head of DBA/2J glaucomatous mice coincides with axon loss. Invest Ophthalmol Vis Sci. 2007;48:5567–5581. doi: 10.1167/iovs.07-0442. [DOI] [PubMed] [Google Scholar]
- Eisenfeld AJ, Bunt-Milam AH, Saari JC. Localization of retinoid-binding proteins in developing rat retina. Exp Eye Res. 1985;41:299–304. doi: 10.1016/s0014-4835(85)80020-8. [DOI] [PubMed] [Google Scholar]
- Elshatory Y, Deng M, Xie X, Gan L. Expression of the LIM-homeodomain protein Isl1 in the developing and mature mouse retina. J Comp Neurol. 2007;503:182–197. doi: 10.1002/cne.21390. [DOI] [PMC free article] [PubMed] [Google Scholar]
- Eter N, Engel DR, Meyer L, Helb HM, Roth F, Maurer J, Holz FG, Kurts C. In vivo visualization of dendritic cells, macrophages, and microglial cells responding to laser-induced damage in the fundus of the eye. Invest Ophthalmol Vis Sci. 2008;49:3649–3658. doi: 10.1167/iovs.07-1322. [DOI] [PubMed] [Google Scholar]
- Fan W, Li X, Wang W, Mo JS, Kaplan H, Cooper NGF. Early involvement of immune/inflammatory response genes in retinal degeneration in DBA/2J mice. Ophthalmol Eye Dis. 2010;11:23–41. doi: 10.4137/oed.s2854. [DOI] [PMC free article] [PubMed] [Google Scholar]
- Garcia-Valenzuela E, Sharma SC, Piña AL. Multilayered retinal microglial response to optic nerve transection in rats. Mol Vis. 2005;11:225–231. [PubMed] [Google Scholar]
- Gasque P, Singhrao SK, Neal JW, Wang P, Sayah S, Fontaine M, Morgan BP. The receptor for complement anaphyla-toxin C3a is expressed by myeloid cells and nonmyeloid cells in inflamed human central nervous system: analysis in multiple sclerosis and bacterial meningitis. J Immunol. 1998;160:3543–3554. [PubMed] [Google Scholar]
- Gasque P. Complement: a unique innate immune sensor for danger signals. Mol Immunol. 2004;41:1089–1098. doi: 10.1016/j.molimm.2004.06.011. [DOI] [PubMed] [Google Scholar]
- Hanisch UK, Kettenmann H. Microglia: active sensor and versatile effector cells in the normal and pathologic brain. Nat Neurosci. 2007;10:1387–1394. doi: 10.1038/nn1997. [DOI] [PubMed] [Google Scholar]
- Hernández MR, Miao H, Lukas T. Astrocytes in glaucomatous optic neuropathy. Prog Brain Res. 2008;173:353–373. doi: 10.1016/S0079-6123(08)01125-4. [DOI] [PubMed] [Google Scholar]
- Holness CL, Simmons DL. Molecular cloning of CD68, a human macrophage marker related to lysosomal glycoproteins. Blood. 1993;81:1607–1613. [PubMed] [Google Scholar]
- Howell GR, Libby RT, Jakobs TC, Smith RS, Phalan FC, Barter JW, Barbay JM, Marchant JK, Mahesh N, Porciatti V, Whitmore AV, Masland RH, John SW. Axons of retinal ganglion cells are insulted in the optic nerve early in DBA/2J glaucoma. J Cell Biol. 2007;179:1523–1537. doi: 10.1083/jcb.200706181. [DOI] [PMC free article] [PubMed] [Google Scholar]
- Howell GR, Libby RT, Marchant JK, Wilson LA, Cosma IM, Smith RS, Anderson MG, John SW. Absence of glaucoma in DBA/2J mice homozygous for wild-type versions of Gpnmb and Tyrp1. BMC Genet. 2007;8:45. doi: 10.1186/1471-2156-8-45. [DOI] [PMC free article] [PubMed] [Google Scholar]
- Huber G, Matus A. Differences in the cellular distributions of two microtubule-associated proteins, MAP1 and MAP2, in rat brain. J Neurosci. 1984;4:151–160. doi: 10.1523/JNEUROSCI.04-01-00151.1984. [DOI] [PMC free article] [PubMed] [Google Scholar]
- Hume DA, Perry VH, Gordon S. Immunohistochemical localization of a macrophage-specific antigen in developing mouse retina: phagocytosis of dying neurons and differentiation of microglial cells to for a regular array in the plexiform layers. J Cell Biol. 1983;97:253–257. doi: 10.1083/jcb.97.1.253. [DOI] [PMC free article] [PubMed] [Google Scholar]
- Imai Y, Ibata I, Ito D, Ohsawa K, Kohsaka S. A novel gene iba1 in the major histocompatibility complex class III region encoding an EF hand protein expressed in a monocytic lineage. Biochem Biophys Res Commun. 1996;224:855–862. doi: 10.1006/bbrc.1996.1112. [DOI] [PubMed] [Google Scholar]
- Imai Y, Kohsaka S. Intracellular signaling in M-CSF-induced microglia activation: role of Iba1. Glia. 2002;40:164–174. doi: 10.1002/glia.10149. [DOI] [PubMed] [Google Scholar]
- Inman DM, Horner PJ. Reactive nonproliferative gliosis predominates in a chronic mouse model of glaucoma. Glia. 2007;55:942–953. doi: 10.1002/glia.20516. [DOI] [PubMed] [Google Scholar]
- Inman DM, Sappington RM, Horner PJ, Calkins DJ. Quantitative correlation of optic nerve pathology with ocular pressure and corneal thickness in the DBA/2 mouse model of glaucoma. Invest Ophthalmol Vis Sci. 2006;47:986–996. doi: 10.1167/iovs.05-0925. [DOI] [PubMed] [Google Scholar]
- Ito D, Tanaka K, Suzuki S, Dembo T, Fukuuchi Y. Enhanced expression of Iba1, ionized calcium-binding adapter molecule 1, after transient focal cerebral ischemia in rat brain. Stroke. 2001;32:1208–1215. doi: 10.1161/01.str.32.5.1208. [DOI] [PubMed] [Google Scholar]
- Jakobs TC, Libby RT, Ben Y, John SW, Masland RH. Retinal ganglion cell degeneration is topological but not cell type specific in DBA/2J mice. J Cell Biol. 2005;171:313–325. doi: 10.1083/jcb.200506099. [DOI] [PMC free article] [PubMed] [Google Scholar]
- John SW, Smith RS, Savinova OV, Hawes L, Chang B, Turnbull D, Davisson M, Roderick TH, Heckenlively JR. Essential iris atrophy, pigment dispersion, and glaucoma in DBA/2J mice. Invest Ophthalmol Vis Sci. 1998;39:951–962. [PubMed] [Google Scholar]
- John SW. Mechanistic insights into glaucoma provided by experimental genetics the Cogan Lecture. Invest Ophthalmol Vis Sci. 2005;46:2649–2661. doi: 10.1167/iovs.05-0205. [DOI] [PubMed] [Google Scholar]
- Johnson EC, Jia L, Cepurna WO, Doser TA, Morrison JC. Global changes in optic nerve head gene expression after exposure to elevated intraocular pressure in a rat glaucoma model. Invest Ophthalmol Vis Sci. 2007;48:3161–3177. doi: 10.1167/iovs.06-1282. [DOI] [PMC free article] [PubMed] [Google Scholar]
- Johnson EC, Morrison JC. Friend or foe? Resolving the impact of glial responses in glaucoma. J Glaucoma. 2009;18:341–353. doi: 10.1097/IJG.0b013e31818c6ef6. [DOI] [PMC free article] [PubMed] [Google Scholar]
- Johnson TV, Tomarev SI. Rodent models of glaucoma. Brain Res Bull. 2010;15:349–358. doi: 10.1016/j.brainresbull.2009.04.004. [DOI] [PMC free article] [PubMed] [Google Scholar]
- Joly S, Francke M, Ulbricht E, Beck S, Seeliger M, Hirrlinger P, Hirrlinger J, Lang KS, Zinkernagel M, Odermatt B, Samardzija M, Reichenbach A, Grimm C, Reme CE. Cooperative phagocytes. Resident microglia and bone marrow immigrants remove dead photoreceptors in retinal lesions. Am J Pathol. 2009;174:2310–2323. doi: 10.2353/ajpath.2009.090023. [DOI] [PMC free article] [PubMed] [Google Scholar]
- Kerr NM, Johnson CS, de Souza CF, Chee KS, Good WR, Green CR, Danesh-Meyer HV. Immunolocalization of gap junction protein connexin43 (GJA1) in the human retina and optic nerve. Invest Ophthalmol Vis Sci. 2010;51:4028–4034. doi: 10.1167/iovs.09-4847. [DOI] [PubMed] [Google Scholar]
- Kezic J, Xu H, Chinnery HR, Murphy CC, McMenamin PG. Invest Ophthalmol Vis Sci. 2008;49:1599–1608. doi: 10.1167/iovs.07-0953. [DOI] [PubMed] [Google Scholar]
- Kirsch M, Trautmann N, Ernst M, Hofmann HD. Involvement of gp130-associated cytokine signaling in Müller cell activation following optic nerve lesion. Glia. 2010;58:768–779. doi: 10.1002/glia.20961. [DOI] [PubMed] [Google Scholar]
- Klück P, van Muijen GN, van der Kamp AW, Tibboel D, van Hoorn WA, Warnaar SO, Molenaar JC. Hirschsprung's disease studied with monoclonal anti-neurofilament antibodies on tissue sections. Lancet. 1984;24:652–654. doi: 10.1016/s0140-6736(84)92170-6. [DOI] [PubMed] [Google Scholar]
- Lam TT, Kwong JMK, Tso MOM. Early glial responses after acute elevated intraocular pressure in rats. Invest Ophthalmol Vis Sci. 2003;44:638–645. doi: 10.1167/iovs.02-0255. [DOI] [PubMed] [Google Scholar]
- Langman T. Microglia activation in retinal degeneration. J Leukocyte Biol. 2007;81:1345–1351. doi: 10.1189/jlb.0207114. [DOI] [PubMed] [Google Scholar]
- Lee JE, Liang KJ, Fariss RN, Wong WT. Ex vivo dynamic imaging of retinal microglia using time-lapse confocal microscopy. Invest Ophthalmol Vis Sci. 2008;49:4169–4176. doi: 10.1167/iovs.08-2076. [DOI] [PMC free article] [PubMed] [Google Scholar]
- Liang KJ, Lee JE, Wang YD, Ma W, Fontainhas AM, Fariss RN, Wong WT. Regulation of dynamic behavior of retinal microglia by CX3CR1 signaling. Invest Ophthalmol Vis Sci. 2009;50:4444–4451. doi: 10.1167/iovs.08-3357. [DOI] [PMC free article] [PubMed] [Google Scholar]
- Libby RT, Li Y, Savinova OV, Barter J, Smith RS, Nickells RW, John SWM. Susceptibility to neurodegeneration in glaucoma is modified by Bax gene dosage. PLos Genet. 2005a;1:17–26. doi: 10.1371/journal.pgen.0010004. [DOI] [PMC free article] [PubMed] [Google Scholar]
- Libby RT, Anderson MG, Pang IH, Robinson ZH, Savinova OV, Cosma IM, Snow A, Wilson LA, Smith RS, Clark AF, John SW. Inherited glaucoma in DBA/2J mice: pertinent disease features for studying the neurodegeneration. Vis Neurosci. 2005b;22:637–648. doi: 10.1017/S0952523805225130. [DOI] [PubMed] [Google Scholar]
- Lucin KM, Wyss-Coray T. Immune activation in brain aging and neurodegeneration: too much or too little? Neuron. 2009;64:110–122. doi: 10.1016/j.neuron.2009.08.039. [DOI] [PMC free article] [PubMed] [Google Scholar]
- Marnetto F, Hellias B, Granieri L, Frau J, Patanella AK, Nytrova P, Sala A, Capobianco M, Gilli F, Bertolotto A. Western blot analysis for the detection of serum antibodies recognizing linear aquaporin-4 epitopes in patients with neuromyelitis optica. J Neuroimmunol. 2009;217:74–79. doi: 10.1016/j.jneuroim.2009.10.002. [DOI] [PubMed] [Google Scholar]
- McKinnon SJ, Schlamp CL, Nickells RW. Mouse models of retinal ganglion cell death and glaucoma. Exp Eye Res. 2009;88:816–824. doi: 10.1016/j.exer.2008.12.002. [DOI] [PMC free article] [PubMed] [Google Scholar]
- Meyer-Luehmann M, Spires-Jones TL, Prada C, Garcia-Alloza M, de Calignon A, Rozkalne A, Koenigsknecht-Talboo J, Holtzman DM, Bacskai BJ, Hyman BT. Rapid appearance and local toxicity of amyloid-beta plaques in a mouse model of Alzheimer's disease. Nature. 2008;451:720–724. doi: 10.1038/nature06616. [DOI] [PMC free article] [PubMed] [Google Scholar]
- Mo JS, Anderson MG, Gregory M, Smith RS, Savinova OV, Serreze DV, Ksander R, Streilein JW, John SW. By altering ocular immune privilege, bone marrow-derived cells pathogenically contribute to DBA/2J pigmentary glaucoma. J Exp Med. 2003;197:1335–1344. doi: 10.1084/jem.20022041. [DOI] [PMC free article] [PubMed] [Google Scholar]
- Mojumder DK, Sherry DM, Frishman LJ. Contribution of voltage-gated sodium channels to the b-wave of the mammalian flash electroretinogram. J Physiol. 2008a;586:2551–2580. doi: 10.1113/jphysiol.2008.150755. [DOI] [PMC free article] [PubMed] [Google Scholar]
- Mojumder DK, Wensei TG, Frishman LJ. Subcellular compartmentalization of two calcium binding proteins, calretinin and calbindin-28kDa, in ganglion and amacrine cells of the rat retina. Mol Vis. 2008b;14:1600–1613. [PMC free article] [PubMed] [Google Scholar]
- Morquette JB, Di Polo A. Dendritic and synaptic protection: is it enough to save the retinal ganglion cell body and axon? J Neuroophthalmol. 2008;28:144–154. doi: 10.1097/WNO.0b013e318177edf0. [DOI] [PubMed] [Google Scholar]
- Nagelhus EA, Veruki ML, Torp R, Haug FM, Laake JH, Nielsen S, Agre P, Ottersen OP. Aquaporin-4 water channel protein in the rat retina and optic nerve: polarized expression in Müller cells and fibrous astrocytes. J Neurosci. 1998;18:2506–2519. doi: 10.1523/JNEUROSCI.18-07-02506.1998. [DOI] [PMC free article] [PubMed] [Google Scholar]
- Naskar R, Wissing M, Thanos S. Detection of early neuron degeneration and accompanying microglial responses in the retina of a rat model of glaucoma. Invest Ophthalmol Vis Sci. 2002;43:2962–2968. [PubMed] [Google Scholar]
- Neufeld AH. Microglia in the optic nerve head and the region of parapapillary chorioretinal atrophy in glaucoma. Arch Ophthalmol. 1999;117:1050–1056. doi: 10.1001/archopht.117.8.1050. [DOI] [PubMed] [Google Scholar]
- Neufeld AH, Liu B. Glaucomatous optic neuropathy: when glia misbehave. Neuroscientist. 2003;9:458–495. doi: 10.1177/1073858403253460. [DOI] [PubMed] [Google Scholar]
- Neumann H, Kotter MR, Franklin RJ. Debris clearance by microglia: an essential link between degeneration and regeneration. Brain. 2009;132:288–295. doi: 10.1093/brain/awn109. [DOI] [PMC free article] [PubMed] [Google Scholar]
- Nickells RW. From ocular hypertension to ganglion cell death: a theoretical sequence of events leading to glaucoma. Can J Ophthalmol. 2007;42:278–287. [PubMed] [Google Scholar]
- Nilsson I, Lindfors C, Fetissov SO, Hökfelt T, Johansen JE. Aberrant agouti-related protein system in the hypothalamus of the anx/anx mouse is associated with activation of microglia. J Comp Neurol. 2007;507:1128–1140. doi: 10.1002/cne.21599. [DOI] [PubMed] [Google Scholar]
- Ohsawa K, Imai Y, Kanazawa H, Sasaki Y, Kohsaka S. Involvement of Iba1 in membrane ruffling and phagocytosis of macrophages/microglia. J Cell Sci. 2000;113:3073–3084. doi: 10.1242/jcs.113.17.3073. [DOI] [PubMed] [Google Scholar]
- Ohsawa K, Imai Y, Sasaki Y, Kohsaka S. Microglia/macrophage-specific protein Iba1 binds to fimbrin and enhances its actin-bundling activity. J Neurochem. 2004;88:844–856. doi: 10.1046/j.1471-4159.2003.02213.x. [DOI] [PubMed] [Google Scholar]
- Platel JC, Gordon V, Heintz T, Bordey A. GFAP-GFP neural progenitors are antigenically homogeneous and anchored in their enclosed mosaic niche. Glia. 2009;57:66–79. doi: 10.1002/glia.20735. [DOI] [PubMed] [Google Scholar]
- Poché RA, Furuta Y, Chaboissier MC, Schedl A, Behringer RR. Sox9 is expressed in mouse multipotent retinal progenitor cells and functions in Müller glial cell development. J Comp Neurol. 2008;20:237–250. doi: 10.1002/cne.21746. [DOI] [PMC free article] [PubMed] [Google Scholar]
- Porciatti V, Saleh M, Nagaraju M. The pattern electroretinogram as a tool to monitor progressive retinal ganglion cell dysfunction in the DBA/2J mouse model of glaucoma. Invest Ophthalmol Vis Sci. 2007;48:745–751. doi: 10.1167/iovs.06-0733. [DOI] [PMC free article] [PubMed] [Google Scholar]
- Quigley HA. Experimental glaucoma damage mechanism. Arch Ophthalmol. 1983;101:1301–1302. doi: 10.1001/archopht.1983.01040020303031. [DOI] [PubMed] [Google Scholar]
- Raoul W, Keller N, Rodéro M, Behar-Cohen F, Sennlaub F, Combadière C. Role of the chemokine receptor CX3CR1 in the mobilization of phagocytic retinal microglial cells. J Neuroimmunol. 2008;198:56–61. doi: 10.1016/j.jneuroim.2008.04.014. [DOI] [PubMed] [Google Scholar]
- Ravichandran KS. “Recruitment signals” from apoptotic cells: invitation to a quiet meal. Cell. 2003;113:817–820. doi: 10.1016/s0092-8674(03)00471-9. [DOI] [PubMed] [Google Scholar]
- Reichstein D, Ren L, Filipopoulos T, Mittag T, Danias J. Apoptotic retinal ganglion cell death in the DBA/2J mouse model of glaucoma. Exp Eye Res. 2007;84:13–21. doi: 10.1016/j.exer.2006.08.009. [DOI] [PubMed] [Google Scholar]
- Ripoll VM, Irvine KM, Ravasi T, Sweet MJ, Hume DA. Gpnmb is induced in macrophages by IFN-γ and lipopolysaccharide an acts as a feedback regulator of proinflammatory responses. J Immunol. 2007;178:6557–6566. doi: 10.4049/jimmunol.178.10.6557. [DOI] [PubMed] [Google Scholar]
- Saari JC, Huang J, Possin DE, Fariss RN, Leonard J, Garwin GG, Crabb JW, Milam AH. Glia. Cellular retinaldehyde-binding protein is expressed by oligodendrocytes in optic nerve and brain. Glia. 1997;21:259–268. [PubMed] [Google Scholar]
- Saleh M, Nagaraju M, Porciatti V. Longitudinal evaluation of retinal ganglion cell function and IOP in the DBA/2J mouse model of glaucoma. Invest Ophthalmol Vis Sci. 2007;48:4564–4572. doi: 10.1167/iovs.07-0483. [DOI] [PMC free article] [PubMed] [Google Scholar]
- Santos AM, Calvente R, Tassi M, Carrasco MC, Martín-Oliva D, Martín-Teva JL, Navascués J, Cuadros MA. Embryonic and postnatal development of microglial cells in the mouse retina. J Comp Neurol. 2008;506:224–239. doi: 10.1002/cne.21538. [DOI] [PubMed] [Google Scholar]
- Saraswathy S, Wu G, Rao NA. Retinal microglial activation and chemotaxis by docosahexaenoic acid hydroperoxide. Invest Ophthalmol Vis Sci. 2006;47:3656–3663. doi: 10.1167/iovs.06-0221. [DOI] [PubMed] [Google Scholar]
- Sarthy V. Cellular retinaldehyde-binding protein localization in cornea. Exp Eye Res. 1996;63:759–762. doi: 10.1006/exer.1996.0170. [DOI] [PubMed] [Google Scholar]
- Schlamp CL, Li Y, Dietz JA, Janssen KT, Nickells RW. Progressive ganglion cell loss and optic nerve degeneration in DBA/2J mice is variable and asymmetric. BMC Neurosci. 2006;7:66. doi: 10.1186/1471-2202-7-66. [DOI] [PMC free article] [PubMed] [Google Scholar]
- Schraermeyer M, Schnichels S, Julien S, Heiduschka P, Bartz-Schmidt KU, Schraermeyer U. Ultrastructural analysis of the pigment dispersion syndrome in DBA/2J mice. Graefes Arch Clin Exp Ophthalmol. 2009;247:1493–1504. doi: 10.1007/s00417-009-1146-y. [DOI] [PubMed] [Google Scholar]
- Schuettauf F, Rejdak R, Walski M, Frontczak-Baniewicz M, Voelker M, Blatsios G, Shinoda K, Zagorski Z, Zrenner E, Grieb P. Retinal neurodegeneration in the DBA/2J mouse- a model for ocular hypertension. Acta Neuropathol. 2004;107:352–358. doi: 10.1007/s00401-003-0816-9. [DOI] [PubMed] [Google Scholar]
- Selkoe DJ. Alzheimer's disease is a synaptic failure. Science. 2002;298:789–791. doi: 10.1126/science.1074069. [DOI] [PubMed] [Google Scholar]
- Sherry DM, Mitchell R, Standifer KM, du Plessis B. Distribution of plasma membrane-associated syntaxins 1 through 4 indicates distinct trafficking functions in the synaptic layers of the mouse retina. BMC Neurosci. 2006;7:54–79. doi: 10.1186/1471-2202-7-54. [DOI] [PMC free article] [PubMed] [Google Scholar]
- Shou T, Liu J, Wang W, Zhou Y, Zhao K. Differential dendritic shrinkage of alpha and beta retinal ganglion cells in cats with chronic glaucoma. Invest Ophthalmol Vis Sci. 2003;44:3005–3010. doi: 10.1167/iovs.02-0620. [DOI] [PubMed] [Google Scholar]
- Sobrado-Calvo P, Vidal-Sanz M, Villegas-Pérez MP. Rat retinal microglial cells under normal conditions, after optic nerve section, and optic nerve section and intravitreal injection of trophic factors or macrophage inhibitor factor. J Comp Neurol. 2007;501:866–878. doi: 10.1002/cne.21279. [DOI] [PubMed] [Google Scholar]
- Son JL, Soto I, Oglesby E, Lopez-Roca T, Pease ME, Quigley HA, Marsh-Armstrong N. Glaucomatous optic nerve injury involves early astrocyte reactivity and late oligodendrocyte loss. Glia. 2010;58:780–789. doi: 10.1002/glia.20962. [DOI] [PubMed] [Google Scholar]
- Soto I, Oglesby E, Buckingham BP, Son JL, Roberson ED, Steele MR, Inman DM, Vetter ML, Horner PJ, Marsh-Armstrong N. Retinal ganglion cells downregulate gene expression and lose their axons within the optic nerve head in a mouse glaucoma model. J Neurosci. 2008;28:548–561. doi: 10.1523/JNEUROSCI.3714-07.2008. [DOI] [PMC free article] [PubMed] [Google Scholar]
- Steele MR, Inman DM, Calkins DJ, Horner PJ, Vetter ML. Microarray analysis of retinal gene expression in the DBA/2J model of glaucoma. Invest Ophthalmol Vis Sci. 2006;47:977–985. doi: 10.1167/iovs.05-0865. [DOI] [PubMed] [Google Scholar]
- Stevens B, Allen NJ, Vazquez LE, Howell GR, Christopherson KS, Nouri N, Micheva KD, Mehalow AK, Huberman AD, Stafford B, Sher A, Litke AM, Lambris JD, Smith SJ, John SW, Barres BA. The classical complement cascade mediates CNS synapse elimination. Cell. 2007;131:1164–1178. doi: 10.1016/j.cell.2007.10.036. [DOI] [PubMed] [Google Scholar]
- Streit WJ. Microglia and neuroprotection: implications for Alzheimer's disease. Brain Res. 2005;48:234–239. doi: 10.1016/j.brainresrev.2004.12.013. [DOI] [PubMed] [Google Scholar]
- Sun D, Lye-Barthel M, Masland RH, Jakobs TC. The morphology and spatial arrangement of astrocytes in the optic nerve head of the mouse. J Comp Neurol. 2009;516:1–19. doi: 10.1002/cne.22058. [DOI] [PMC free article] [PubMed] [Google Scholar]
- Swanson WH, Felius J, Pan F. Perimetric defects and ganglion cell damage: interpreting linear relations using a two-stage neural model. Invest Ophthalmol Vis Sci. 2004;45:466–472. doi: 10.1167/iovs.03-0374. [DOI] [PubMed] [Google Scholar]
- Tambuyzer BR, Ponsaerts P, Nouwen ET. Microglia: gatekeepers of central nervous system immunology. J Leukoc Biol. 2009;85:352–370. doi: 10.1189/jlb.0608385. [DOI] [PubMed] [Google Scholar]
- Tezel G, Wax MB. Glial modulation of retinal ganglion cell death in glaucoma. J Glaucoma. 2003;12:63–38. doi: 10.1097/00061198-200302000-00014. [DOI] [PubMed] [Google Scholar]
- Thanos S. The relationship of microglial cells to dying neurons during natural neuronal cell death and axotomy-induced degeneration of the rat retina. Eur J Neurosci. 1991;3:1189–1207. doi: 10.1111/j.1460-9568.1991.tb00054.x. [DOI] [PubMed] [Google Scholar]
- Utans U, Arceci RJ, Yamashita Y, Russell ME. Cloning and characterization of allograft inflammatory fctor-1: a novel macrophage factor identified in rat cardiac allografts with chronic rejection. J Clin Invest. 1995;95:2954–2962. doi: 10.1172/JCI118003. [DOI] [PMC free article] [PubMed] [Google Scholar]
- Walter K, Neumann H. Role of microglia in neuronal degeneration and regeneration. Semin Immunopathol. 2009;31:513–525. doi: 10.1007/s00281-009-0180-5. [DOI] [PubMed] [Google Scholar]
- Wang X, Tay SS, Ng YK. An immunohistochemical study of neuronal and glial cell reactions in retinae of rats with experimental glaucoma. Exp Brain Res. 2000;132:476–484. doi: 10.1007/s002210000360. [DOI] [PubMed] [Google Scholar]
- Weber AJ, Kaufman PL, Hubbard WC. Morphology of single ganglion cells in the glaucomatous primate retina. Invest Ophthalmol Vis Sci. 1998;39:2304–2320. [PubMed] [Google Scholar]
- Weishaupt JH, Klöcker N, Bähr M. Axotomy-induced early down-regulation of POU-IV class transcription factors Brn-3a and Brn-3b in retinal ganglion cells. J Mol Neurosci. 2005;26:17–25. doi: 10.1385/JMN:26:1:017. [DOI] [PubMed] [Google Scholar]
- Whitmore AV, Libby RT, John SW. Glaucoma: thinking in new ways-a rôle for autonomous axonal self-destruction and other compartmentalised processes? Prog Retin Eye Res. 2005;24:639–662. doi: 10.1016/j.preteyeres.2005.04.004. [DOI] [PubMed] [Google Scholar]
- Yoshiyama Y, Higuchi M, Zhang B, Huang SM, Iwata N, Saido TC, Maeda J, Suhara T, Trojanowski JQ, Lee VM. Synapse loss and microglial activation precede tangles in a P301S tauopathy mouse model. Neuron. 2007;53:337–351. doi: 10.1016/j.neuron.2007.01.010. Erratum in: Neuron, 54:343-334. [DOI] [PubMed] [Google Scholar]
- Xu H, Chen M, Forrester Para-inflammation in the ageing retina. Prog Retin Eye Res. 2009;28:348–368. doi: 10.1016/j.preteyeres.2009.06.001. [DOI] [PubMed] [Google Scholar]
- Yuan L, Neufeld AH. Activated microglia in the human glaucomatous optic nerve head. J Neurosci Res. 2001;64:523–532. doi: 10.1002/jnr.1104. [DOI] [PubMed] [Google Scholar]
- Zhang Cm, Tso MOM. Characterization of activated retinal microglia following optic axotomy. J Neurosci Res. 2003;73:840–845. doi: 10.1002/jnr.10713. [DOI] [PubMed] [Google Scholar]
- Zhang C, Lam TT, Tso MOM. Heterogeneous populations of microglia/macrophages in the retina and their activation after retinal ischemia and reperfusion injury. Exp Eye Res. 2005;81:700–709. doi: 10.1016/j.exer.2005.04.008. [DOI] [PubMed] [Google Scholar]
- Zhou X, Li F, Kong L, Tomita H, Li C, Cao W. Involvement of inflammation, degradation, and apoptosis in a mouse model of glaucoma. J Biol Chem. 2005;280:31240–31248. doi: 10.1074/jbc.M502641200. [DOI] [PubMed] [Google Scholar]
Associated Data
This section collects any data citations, data availability statements, or supplementary materials included in this article.
Supplementary Materials
Suppl. Figure 1. Specificity of GFP and AQP4 primary antibodies. A-C) Anti-GFP antibody does not stain microglia or other elements within the optic nerve of D2 mice, aged 1 month. D) AQP4 immunostaining overlaps with Müller cell markers. Overlay view of CRALBP (green) and AQP4 staining (red) showing their overlap (yellow) in Müller end feet (NFL/GCL) and processes (across the IPL and OPL). E) A high magnification view of the inbox in D shows AQP4 delineating Müller inner radial processes (GCL/IPL), cell somata (INL), and strong expression within the NFL, GCL, and outer IPL and OPL, retinal depths where vascular plexus are positioned.
Suppl. Figure 2. Intraocular pressure variation with age in D2 mice. The IOP trend in our colony is consistent with previous reports for D2 mice.
Suppl. Figure 3. Animated view of the mosaics of microglia in the central retina and the ONH. Central retina of a 5mo B6.129 Cx3cr1tm1Litt/J mouse showing microglia expressing CX3cr1-GFP (green) and Iba1 (magenta), as well as RGCs with nuclear Brn3 (blue). The movie starts at the NFL and advances through the GCL (where RGC nuclei localize), displaying at deeper levels microglia localized to the IPL and OPL. The clustering of microglia localized to the ONH is seen in the center of the field at all depths. Image correspond to the retina depicted in Suppl. Fig 3C; z-step is 0.7 μm.
Suppl. Figure 4. Colocalization analysis between Cx3cr1-GFP and Iba1. The central retina from a CX3CR1-GFP C57 BL6/J mouse with microglia double-immunostained for GFP and Iba1 was used to quantify the degree of overlap between GFP and Iba1. A, B) Single channel views of GFP and Iba1 show the presence of both signals within the same cells. C) The overlay of GFP (green) and Iba1 (magenta), again, shows qualitatively the degree of overlap between the signals (white areas). D, E) Intensity plots of GFP and Iba1 signals showing their respective distribution of fluorescence intensity (in pseudocolor scale of 0 to 4095 values). Notice that GFP shows more uniform high expression, while Iba1 shows a more regulated pattern. Some Iba1 cells reach the highest levels, while many have intermediate levels or only above background levels. F) Scattergram of GFP vs. Iba1 signals shows high colocalization (see values in inset). Pearson's correlation > 0.84; Mander's overlap > 0.94; Colocalization coefficients GFP=1, Iba1=1.
Suppl. Figure 5. Raw data of the Iba1 intensity analysis in D2 central/inner retina. Densitometric analysis of the intensity of Iba1 immunofluorescence per cell. Data points (circles) represent mean values per sample, while rectangles indicate mean per age group.
Suppl. Figure 6. Biomarkers of microglia activation. The regulation of Iba1 was compared by qRT-PCR analysis with other microglia/macrophage markers of activation and/or phagocytosis. Data points along each vertical line correspond to an individual sample, and represent the mean expression levels for Iba1, CD115, CD68 and F4/80 within individual D2 central retina/ONH samples at 1 or 3 months of age (n=8). The amplitude of Iba1 expression across samples varies more than any other marker. CD115 and Iba1 expressions correlate the most, although Iba1 has the highest regulation (5.3x vs. a 3.5x across all samples). This suggests the high regulation of Iba1 expression.