Abstract
Although X chromosome inactivation in female mammals evolved to balance the expression of X chromosome and autosomal genes in the two sexes, female embryos pass through developmental stages in which both X chromosomes are active in somatic cells. Bovine blastocysts show higher expression of many X genes in XX than XY embryos, suggesting that X inactivation is not complete. Here we reanalyzed bovine blastocyst microarray expression data from a network perspective with a focus on interactions between X chromosome and autosomal genes. Whereas male to female ratios of expression of autosomal genes were distributed around a mean of 1, X chromosome genes were clearly shifted towards higher expression in females. We generated gene coexpression networks and identified a major module of genes with correlated gene expression that includes female-biased X genes and sexually dimorphic autosomal genes for which the sexual dimorphism is likely driven by the X genes. In this module, expression of X chromosome genes correlates with autosome genes, more than the expression of autosomal genes with each other. Our study identifies correlated patterns of autosomal and X-linked genes that are likely influenced by the sexual imbalance of X gene expression when X inactivation is inefficient.
Keywords: X inactivation, Bovine, Gene network, X chromosome, Male, Female
Introduction
In mammals, the process of female-specific inactivation of one X chromosome leads to dosage compensation, resulting in similar ratios of expression of X genes to autosomal genes in both sexes. X inactivation prevents a strong female bias in X gene expression in somatic tissues, which would otherwise be expected based on the strong sex bias of sex chromosome gene expression that occurs in other groups that lack effective sex chromosome dosage compensation (Baverstock et al. 1982; Kuroda et al. 2001; Kuroiwa et al. 2002; McQueen et al. 2001; Itoh et al., 2007, 2010; Arnold et al., 2008; Ellegren et al. 2007; Naurin et al., 2011, 2012; Zhang et al., 2010; Wolf and Bryk, 2011; Harrison et al., 2012; Uebbing et al., 2013). X inactivation does not eliminate sexual bias, but shifts the curve of bias away from strong female bias (higher expression in females relative to males) so that the modal sexual bias of X genes is zero. Dosage compensation results in a system in which autosomal and X chromosome genes show about the same distribution of sexual bias (see Figure 1), with different amounts of bias in each tissue (Itoh et al., 2007). The tissue-specific matching of sexual bias in autosomal and X gene expression is probably regulated by network interactions between X and autosomal genes, which drive expression of each other in gene networks in each tissue. Sex biasing signals, for example gonadal hormones and sex chromosome encoded factors, likely set up different degrees of sexual bias in each type of tissue, which are then propagated through the networks composed of X and autosomal genes.
Figure 1.
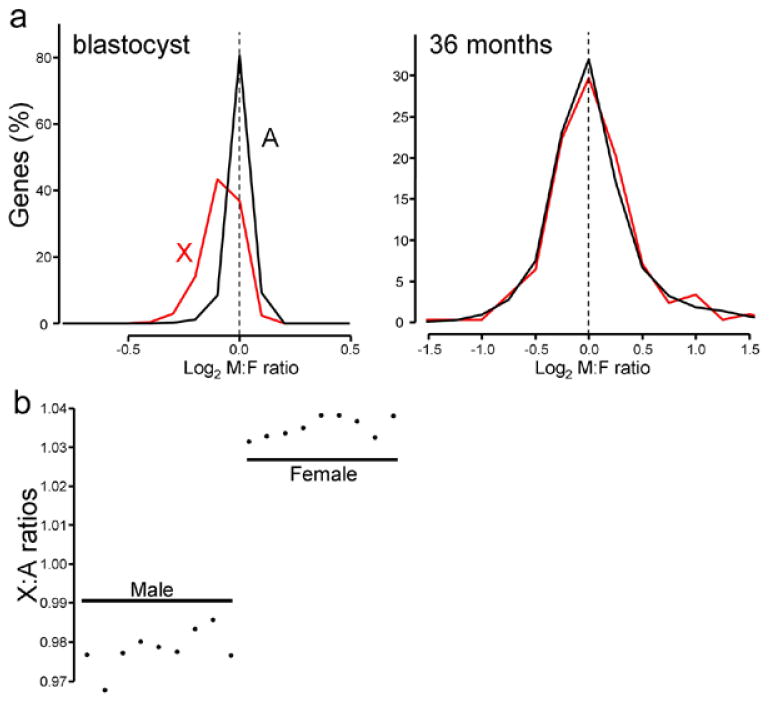
(a) The distribution of male to female ratios of genes encoded by the X chromosome and autosomes in bovine blastocysts (left, 13262 probes) or muscle tissue from 36 month-old animals (right, 13226 probes). Bin size=0.1 for blastocyst, bin=0.25 for 36 months cattle. (b) Mean expression levels of X genes were divided by the mean expression levels of autosome genes, and plotted for each of the 18 samples. Male ratios were significantly lower than female ratios (t-test: p= 8.461e-13).
Mammalian embryonic somatic tissues, however, pass through a stage of ineffective dosage compensation, prior to final random X inactivation in epiblast-derived tissues. The pattern of establishment of full X inactivation differs across species. In bovine blastocysts, most X chromosome genes are expressed higher in XX than XY embryos, indicating that X inactivation is incomplete at this stage (Bermejo-Alvarez et al., 2008). Because the blastocyst stage is well before gonadal differentiation, several phenotypic sex differences observed in domestic cattle blastocysts are caused by sex chromosome effects (inherent differences in expression of X and Y genes), rather than by gonadal hormones. These include higher mitochondria DNA copy number in males, longer telomere length in females, sex differences in methylation and the mRNA expression of some methylation-related enzymes, and a difference in glucose metabolism (Tiffin et al., 1991; Bermejo-Alvarez, et al., 2008). Most likely, incomplete inactivation of the X chromosome is the primary cause of sex differences in blastocysts because almost 90% of X genes are expressed higher in females relative to males (Bermejo-Alvarez et al., 2009, 2011a). This early stage of biased X gene expression could lead to long-term effects on glucose/protein metabolism or epigenetic regulation (Bermejo-Alvarez et al., 2011b).
We reasoned that X inactivation may be variable at the blastocyst stage of domestic cattle, and that a subset of autosomal genes might be under the influence of X genes which have higher expression in females relative to males due to the inefficient X inactivation. Accordingly, we have reanalyzed gene expression profiling of bovine blastocysts (Bermejo-Alvarez et al., 2010) and used Weighted Gene Coexpression Network Analysis (WGCNA) (Zhang and Horvath, 2005; Langfelder and Horvath, 2008) and other methods to discern patterns of gene expression across embryos. We found that the genes are categorized into 8 groups (modules) by the pattern of gene coexpression, with the largest module comprising sexually dimorphic genes. The X chromosome genes in this large module correlated with significantly more autosome genes than average, suggesting that X chromosome genes regulate autosome genes in this module. We also show that one of the modules with compensated X genes has a biased distribution of X genes along the X chromosome.
Materials and methods
Microarray data
Gene expression profiles of bovine blastocysts were obtained from GEO (Bermejo-Alvarez et al., 2010: GSE17921). There were 18 pools of Day 7 blastocysts (60 blastocysts per pool) derived from in vitro fertilization. Briefly, X- and Y-sorted sperm were used from three different bulls, and three replicate fertilizations were performed for each bull. Thus there are 18 samples (3 bulls × 3 replicates × 2 sexes). The expression data for Longissimus dorsi muscle from 36 month old cattle were obtained from GEO database (Zhang et al., 2011: GSE19586). Three males and three females in this dataset were analyzed, with an average age of 35.4 ± 0.11 months.
Data analysis
Statistical analyses, including Wilcoxon rank sum test, two-sample Kolmogorov-Smirnov test, and resampling statistics, were performed in R (http://www.r-project.org/). A t-test was used to test sex differences in gene expression (p<0.05), followed by False Discovery Rate Analysis (Benjamini and Hochberg, 1995, p<0.1).
Weighted gene correlation network analysis (WGCNA, Zhang and Horvath, 2005) was performed with R package WGCNA (Langfelder and Horvath, 2008) using the 5000 most variable genes based on coefficient of variation of gene expression levels. WGCNA places genes into a relatively small number of modules based on common patterns of correlation of expression of the genes with each other, across samples. Thus, genes within modules are regulated by common factors that vary across modules. Genes within modules may drive the expression of other genes in the modules, or be driven by similar factors that are not part of the module. The selection of the 5000 most variable genes was based on the largest number of genes that we could analyze within our computational capacity.
To test the significance of the regional distribution of brown module X genes, we ran a permutation test for all 258 X chromosome genes that were included in the WGCNA analysis. In brief, we shuffled 258 genes and randomly selected 29 genes (the number of X genes in the brown module). Then we asked how many times no gene would be assigned to the region of the X chromosome where brown module genes are lacking. This procedure generated a probability for finding the brown module distribution by chance. The locations of bovine X chromosome genes were from Ensembl genome database (http://www.ensembl.org).
For the large turquoise module, the correlation of expression values between X genes and autosome genes were compared. We tallied the number of autosomal genes that were significantly correlated with each X or autosomal gene.
We also used NEO software in R (Aten et al., 2008) to orient edges in turquoise module of the gene coexpression network. This procedure evaluated several competing causal models relating the sex of the sample and the correlated expression of numerous pairs of X and autosomal (A) genes. Two predominant causal models are that the sex determines expression of the X gene, which then influences expression of the A gene (Model 1), or the alternative Model 2 that the sex determines the expression of the A gene which then influences the expression of the X gene. For example, we concluded that Model 1 was supported if the pattern of coexpression of an X-A gene pair met two criteria: (a) the LEO.nb score was greater than 0.5 (meaning that the statistical fit to Model 1 was at least at least 3-fold better than the fit to Model 2, Aten et al., 2008), and (b) that the Chi-square goodness of fit p value to Model 1 was high, greater than 0.89 (mlogp.M.AtoB score less than 0.05).
Results
Sex differences in autosomal and X chromosome gene expression
To visualize the effect of partial inactivation of X chromosome in bovine blastocysts, the male to female ratios of expression for autosomal and X chromosome genes were compared with those from muscle of 36 month old calves (Figure 1A). In blastocysts, the distribution of male to female ratios for X genes was female-biased, in contrast to 3-year old calves, in which the modal M:F ratio was 1 (log2 ratio=0). Based on both a Wilcoxon rank sum test and a two-sample Kolmogorov-Smirnov test, the distributions of M:F ratios of A and X genes were significantly different (p< 2.2e-16) in blastocysts but not in calves (Wilcoxon rank sum test: p=0.3477; two-sample Kolmogorov-Smirnov test: p= 0.2038), probably because of efficient X inactivation in calves. In blastocysts, the ratio of expression of X to A genes was consistently above 1 for female samples, but below 1 for male samples (Figure 1B), suggesting that the X:A ratio is correlated with degree of X inactivation. The female ratios were significantly higher than those for males (t-test: p= 8.46e-13), reflecting the higher expression of X genes in females.
Variable X inactivation likely drives formation of sexually biased gene network coexpression modules
We used Weighted Gene Co-expression Network Analysis (WGCNA; Langfelder and Horvath, 2008) to detect 8 modules of genes that have module-specific patterns of co-expression across microarray samples (Table 1, Supplemental table 1). Virtually all of the sex-biased genes are found in three modules, turquoise, red, and pink. Of these the most salient is turquoise, the largest module that included 1549 genes, 31% of the 5000 genes analyzed, by far the largest percentage (12%) of X genes of any module, and more than 2/3 of all X genes analyzed. This large module therefore represents a major pattern of co-expression among these samples. The turquoise module had the lowest mean M:F ratio of X chromosome gene expression (0.91) of all modules, and a lower M:F ratio of autosomal gene expression than in other modules. In this largest module, more than 80 percent of X genes were sexually dimorphic (154 genes were female-biased, FDR<0.1, Table 1). Surprisingly, almost half of autosomal genes were also significantly different between male and female (494 female-biased and 219 male-biased genes, FDR<0.1, Table 1). These results suggest that the expression of X chromosome genes, driven by variation in X inactivation across pools of blastocysts, in turn alters the expression of autosomal genes in turquoise module. Indeed, the distribution of M:F ratios of expression of turquoise module X genes was significantly female biased (Wilcoxon rank sum test: p< 2.2e-16; two-sample Kolmogorov-Smirnov test: p< 2.2e-16), more than the X chromosome as a whole (Figure 2). On the other hand, the distribution of M:F ratios of autosomal genes had two distinct peaks, with about two-thirds of the genes showing higher expression in females (Figure 2 and 3). This bimodal distribution of autosome genes suggests that variation in X inactivation across samples, leads to variable female bias in X gene expression that causes variable up- or down-regulation of a large group of specific autosomal genes.
Table 1.
Gene numbers and average male to female ratios of expression of the genes in each module. A: autosomal genes, X: X chromosome genes. The number of male- and female-biased (FDR<0.1) genes for each module are also shown.
| all (genes) | X (genes) | X(%) | M/F ratios | Female-biased | Male-biased | |||||
|---|---|---|---|---|---|---|---|---|---|---|
|
| ||||||||||
| all | A | X | A | X | A | X | ||||
|
| ||||||||||
| turquoise | 1549 | 184 | 11.88 | 0.97 | 0.98 | 0.91 | 494 | 154 | 219 | 2 |
| blue | 787 | 13 | 1.65 | 1.00 | 1.00 | 0.98 | 2 | 0 | 1 | 0 |
| brown | 780 | 29 | 3.72 | 1.00 | 1.00 | 1.00 | 0 | 0 | 3 | 0 |
| yellow | 722 | 11 | 1.52 | 1.00 | 1.00 | 0.97 | 1 | 1 | 3 | 0 |
| green | 703 | 14 | 1.99 | 1.02 | 1.02 | 1.02 | 0 | 0 | 3 | 1 |
| red | 122 | 5 | 4.10 | 0.99 | 0.99 | 0.94 | 21 | 3 | 10 | 0 |
| black | 83 | 0 | 0.00 | 1.02 | 1.02 | NaN | 0 | 0 | 0 | 0 |
| pink | 79 | 2 | 2.53 | 1.03 | 1.03 | 0.96 | 7 | 1 | 29 | 0 |
Figure 2.
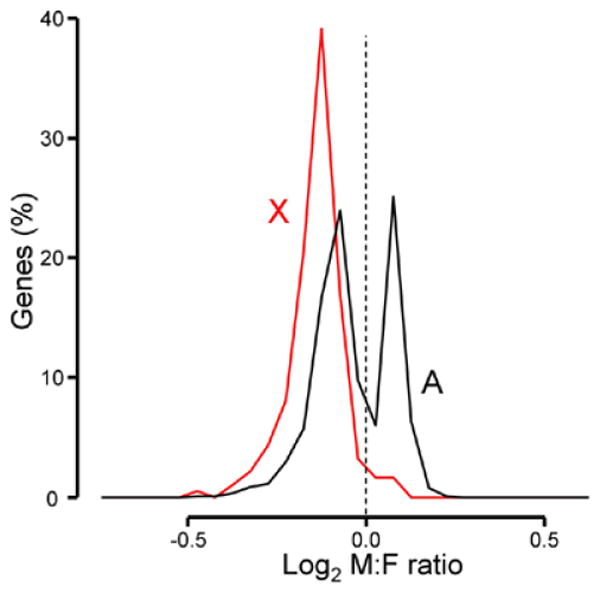
The distribution of male to female ratios of genes encoded by the X chromosome and autosomes for turquoise module genes. X chromosome genes in this module had female-biased expression. Autosomal genes were either female-biased or male-biased, with almost no genes showing sexual equivalence. Bin size=0.05.
Figure 3.
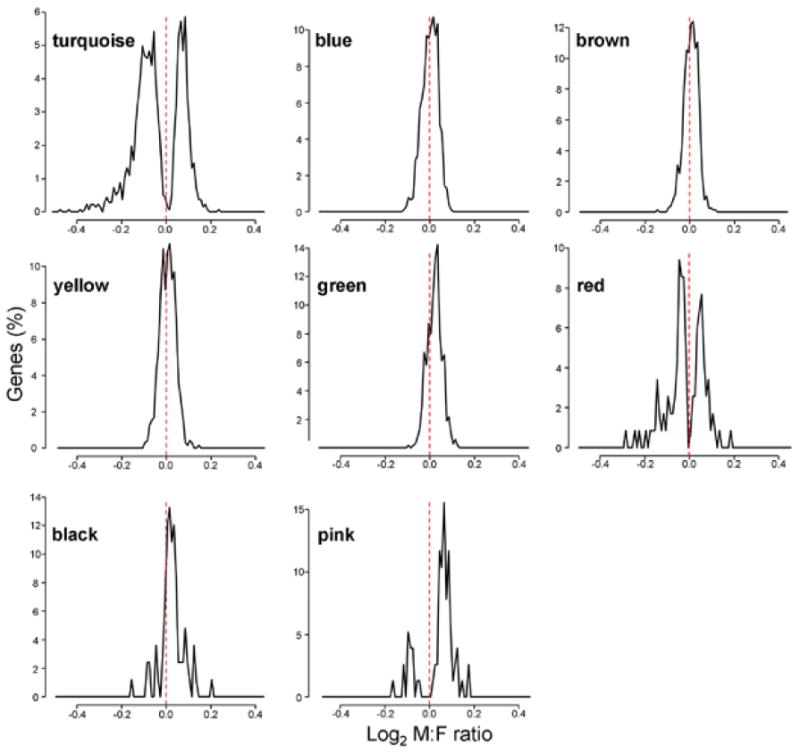
The distributions of male to female ratios of expression of genes encoded by autosomes in each module. Autosomal genes for turquoise, red, and pink modules were either female-biased or male-biased, with almost no genes showing sexual equivalence. In the other modules, autosome genes had little sexual bias. Bin size=0.01.
The red module (122 genes) had the second largest X chromosome gene content (5 genes or 4.1%). The mean M:F ratio of red module genes was about 1 for A genes but 0.94 for X genes (Table 1). Whereas 3 out of the 5 X chromosome genes were significantly female-biased, 31 autosomal genes were sexually biased (21 towards female, 10 towards male, Table 1). Despite having a mean M:F ratio around 1 (Table 1), the distribution of M:F ratios of red module genes had a bimodal distribution, showing significant male- or female-bias (Figure 3). Thus, although the number of the X chromosome genes was smaller in the red than turquoise modules, the distribution of M:F ratios of autosome genes in these two modules were similar.
The pink module (79 genes) had only 2 X chromosome genes, and one of those genes was significantly female-biased (Table 1). Seven autosomal genes were female-biased, whereas 29 genes were male-biased. Similar to the turquoise and red modules, the M:F ratios showed a bimodal distribution, with male peak higher and larger than female's (Figure 3). Figure 4 shows the patterns of variation of the level of the turquoise and pink module eigengenes, which are the first principal component of gene expression for each module. In the turquoise module, the eigengene expression pattern was low in males and high in females, but the opposite eigengene pattern was found in the red module. Similar clear expression patterns according to sex were not observed in the other 6 modules.
Figure 4.
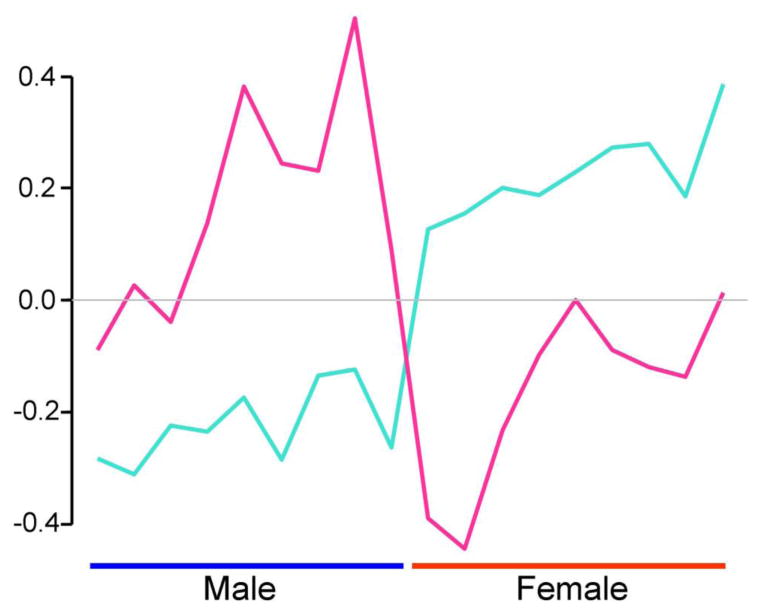
The expression value of the module eigengene is graphed for turquoise and pink modules, across the 18 samples. The two modules were both sexually dimorphic, but show different patterns of sexual dimorphism, accounting for the separation of the genes into these two modules.
X chromosome genes regulate autosome genes in the turquoise module
We evaluated the hypothesis that turquoise module X genes regulate the expression of autosomal genes, rather than the reverse. In the turquoise module, we first calculated the correlation coefficients of gene expression between pairs of X and autosomal genes, and between pairs of autosomal genes and the other autosomal genes. Thus, each autosomal gene had 1548 correlation coefficient values which represent the number of genes in the turquoise module (=1549) minus 1, including the values for X or autosomal genes. This analysis was to evaluate which gene groups, X or A genes, have higher connection to autosomal genes as a correlation. For each X and autosomal gene, we counted the number of autosomal genes with which that gene correlated significantly (p<0.05 without FDR). In general, expression of X genes correlated with more A genes than A genes with themselves (Figure 5). In this set of genes, X genes correlated with an average of about 800 A genes, whereas A genes correlated with only 400 autosome genes (Figure 5B). This higher correlation between X and A genes in turquoise module was not observed in the other modules (Supplemental figure 1). Autosomal genes with greater sexual bias (M:F ratios above or below 1) were more correlated with X genes than those lacking sexual bias (Figure 5C). This different pattern of correlation between X and autosomal genes was not found in other modules.
Figure 5.
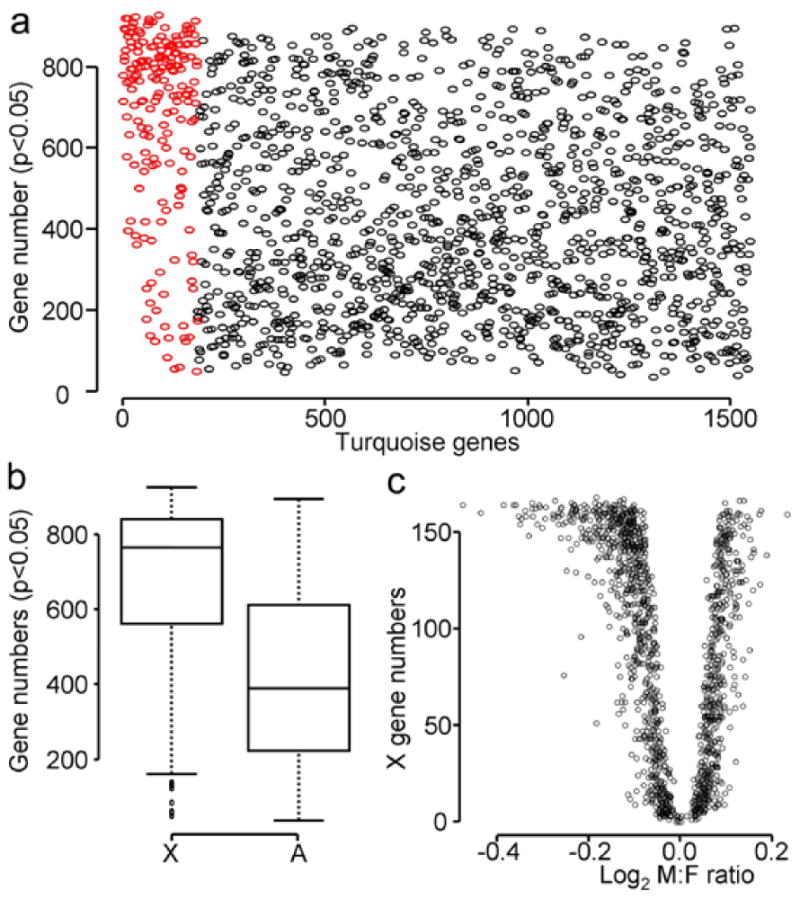
X chromosome genes, more than autosomal genes, correlate with autosomal genes in turquoise module. a) The numbers of autosomal genes that correlated significantly (p<0.05) with X (red) and autosomal (black) genes are plotted. Each circle represents an individual gene. b) Box plot of the numbers of significantly correlated with autosomal genes in 5A. X genes correlated with more autosomal genes than autosomal genes did (t-test: p-value < 2.2e-16). c) The relationship between male to female ratio and the number of X genes that correlated with each autosomal genes in the turquoise module. The turquoise module autosomal genes with lower M:F ratios were correlated with a higher number of X genes, compared to autosomal genes with higher M:F ratios.
Using the edge orienting analysis R package NEO, we found that the pattern of coexpression of pairs of X and A genes fit Model 1 (sex influences X gene expression which then influences A gene expression, see Methods) in 5588 gene pairs, whereas the data fit Model 2 better for 1129 gene pairs. This result is compatible with the idea that the sex difference in A genes was predominantly driven by the sex difference in X genes.
Modules lacking sexual bias
The other 5 modules (blue, brown, yellow, green, and black) almost completely lacked genes with significant sex bias (Table 1). This was also confirmed in the histograms of M:F ratios of autosome genes, which showed unimodal distributions with the peak around 0 for these modules (Figure 3). These modules contained 0-3.7% X chromosome genes. However, the expression of these X genes was comparatively uninfluenced by the variation in X inactivation across samples,
The brown module had the highest percentage of X chromosome genes in those 5 unbiased modules, yet the average M:F ratios of X chromosome genes was the closest to 1 (Table 1). We have examined whether X genes in the modules were distributed non-randomly along the X chromosome (Figure 6). Although the turquoise module did not show any specific pattern, the X genes in the brown module showed a non-random distribution (permutation test: p=0.007), avoiding the region near the Xist locus. A non-random distribution of X genes was not observed in other modules.
Figure 6.
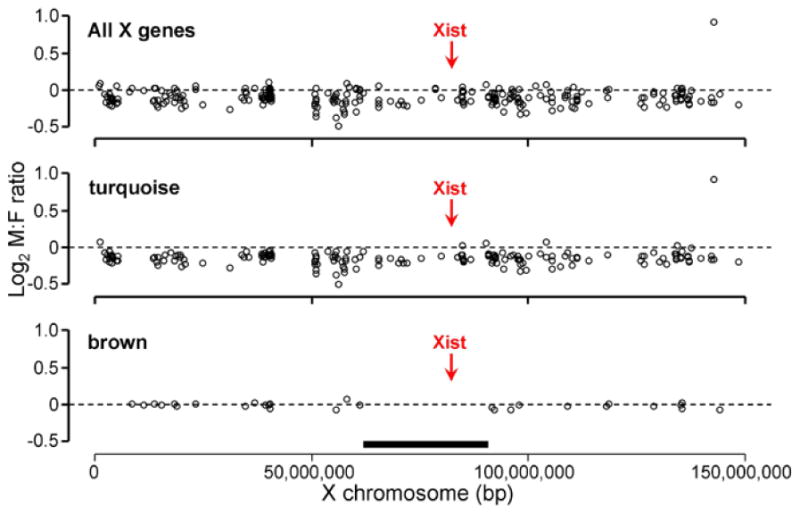
X chromosome location of turquoise and brown module genes. The top panel shows 258 X chromosome genes which were in the 5000 gene set used for gene network analysis. Turquoise module genes were randomly distributed along the X chromosome. Brown module genes were lacking in the region around the Xist locus. A permutation test showed that the distribution of brown module genes outside of the near-Xist region (60925306 bp < thick line < 91441704 bp) was unlikely to occur by chance (p=0.007).
Examination of the Gene Ontology of genes in 8 modules did not uncover particularly striking relationships, suggesting that module membership was not determined significantly by gene function (Table 2). The genes with the common GO term “extracellular region” were significantly more frequent in both the brown and turquoise modules, indicating that there was not a specific relationship between the degree of X inactivation and gene function. A disproportionate number of phosphorylation genes were found in the blue module, and intercellular function genes in the yellow module.
Table 2.
Gene ontology analysis for each module. The three highest terms are shown. Count: gene number, %: percentage of count in module, List Total: total gene number in each term, p-value: Fisher's Exact test, Bonferroni: Bonferoni correction.
| Module | Term | Count | % | List Total | p-value | Bonferroni |
|---|---|---|---|---|---|---|
|
| ||||||
| turquoise | GO:0005576-exlracellular region | 156 | 11.1 | 598 | 3.09E-20 | 1.03E-17 |
| signal peptide | 182 | 13.0 | 593 | 2.58E-18 | 3.83E-15 | |
| disulfide bond | 153 | 10.9 | 593 | 2.38E-17 | 3.53E-14 | |
|
| ||||||
| blue | GO:0042325∼regulation of phosphorylation | 23 | 3.1 | 377 | 4.63E-06 | 0.009 |
| GO:0051174∼regulation of phosphorus metabolic process | 23 | 3.1 | 377 | 9.68E-06 | 0.019 | |
| GO:0019220∼regulation of phosphate metabolic process | 23 | 3.1 | 377 | 9.68E-06 | 0.019 | |
|
| ||||||
| brown | GO:0005576∼extracellular region | 100 | 13.7 | 342 | 2.82E-16 | 9.09E-14 |
| signal peptide | 103 | 14.1 | 297 | 6.03E-14 | 5.86E-11 | |
| disulfide bond | 89 | 12.2 | 297 | 6.30E-14 | 6.12E-11 | |
|
| ||||||
| yellow | GO:0070013∼intracellular organelle lumen | 41 | 6.0 | 259 | 7.40E-05 | 0.020 |
| GO:0043233∼organelle lumen | 41 | 6.0 | 259 | 7.69E-05 | 0.021 | |
| GO:0031981∼nuclear lumen | 33 | 4.8 | 259 | 9.07E-05 | 0.025 | |
|
| ||||||
| green | signal peptide | 98 | 14.5 | 281 | 1.83E-13 | 1.60E-10 |
| disulfide bond | 84 | 12.4 | 281 | 4.20E-13 | 3.67E-10 | |
| glycosylation site:N-linked (GlcNAc…) | 96 | 14.2 | 281 | 1.47E-12 | 1.28E-09 | |
|
| ||||||
| red | topological do main: Extracellular | 12 | 10.3 | 47 | 0.003 | 0.331 |
| transmembrane region | 19 | 16.2 | 47 | 0.006 | 0.583 | |
| sequence variant | 5 | 4.3 | 47 | 0.009 | 0.715 | |
|
| ||||||
| black | GO:0005576∼extracellular region | 23 | 28.7 | 48 | 1.13E-08 | 8.89E-07 |
| GO:0005578∼prateinaceous extracellular matrix | 11 | 13.8 | 48 | 9.17E-08 | 7.25E-06 | |
| GO:0031012∼extracellular matrix | 11 | 13.8 | 48 | 2.10E-07 | 1.66E-05 | |
|
| ||||||
| pink | GO:0045177∼apical part of cell | 4 | 5.1 | 28 | 0.002 | 0.060 |
| receptor | 8 | 10.3 | 36 | 0.007 | 0.493 | |
| GO:0016324∼apical plasma membrane | 3 | 3.8 | 28 | 0.009 | 0.300 | |
Discussion
Using previously reported bovine blastocyst microarray gene expression data, we have examined the pattern of expression of X chromosome and autosomal genes across samples, with regard to sexual bias and relation to X inactivation. Using WGCNA, we classified genes into 8 modules of coexpression. Most salient was the large, sexually biased turquoise module comprising 30% of all genes analyzed, with 2/3 of X genes, in which X genes were consistently female-biased. Autosomal genes were more often expressed higher in females than males, although a sizable minority of genes had the opposite direction of sexual bias. In this module, the expression of X genes was correlated with expression of autosomal genes more often than autosomal genes were correlated with each other. This pattern of results suggests that the turquoise module pattern was caused by the dominant sex difference in X gene expression which in turn drove the expression of A genes that were responsive to these X genes. The large size of the turquoise module suggests that inefficient X-inactivation is a major force driving sex differences in expression throughout the autosomal genome of blastocysts.
Although the higher expression of X genes in XX blastocysts is the most likely source of the significant sexual bias in autosomal genes of blastocysts, other sex-biasing factors are present at this stage. These include the presence of a paternal imprinting on X genes only in XX blastocysts, the presence of Y genes only in XY blastocysts, and the presence of a large heterochromatic X chromosome only in XX cells that have some X inactivation (Arnold, 2012). Epigenetic heterochromatizing factors may be sequestered away from autosomes in those blastocysts showing greater amounts of X inactivation, reducing the amount of autosomal heterochromatin and activating expression of autosomal genes in XX blastocysts more than XY (Wijchers et al., 2010; Wijchers and Festenstein, 2011). Although it is impossible to exclude any of these sex-biasing factors, the chromosome-wide expression of genes from both X chromosomes is the most likely explanation, given the pattern of results reported here. Whatever the source of sexual bias, it was clearly a major factor influencing the formation of gene coexpression modules. Nonetheless, the factor forming the modules did not create any specific accumulation of genes with same or similar functions that make the genes in the same group, which suggests that the autosome genes regulated by inefficient X inactivation (or some other factor explained above) during blastocyst stage have many functions, and thus may be sex-biased more because of the number of X chromosomes rather than because of any selection for sexual bias in blastocyst function. Indeed, some of the genome-wide sex differences in expression caused by the X chromosome imbalance may offset each other, and represent adaptive counteracting forces that reduce the sex biasing effect of widespread sex difference in X gene expression. Nevertheless, these processes could have long term effects to create sex biased in tissue function (Bermejo-Alvarez et al., 2011b).
The lack of complete X chromosome dosage compensation found in bovine blastocysts is somewhat reminiscent of other systems in which sex chromosome dosage compensation is not effective. In birds, the large Z chromosome has two copies in males (ZZ) compared to one in females (ZW). Male Z chromosomes are not effectively dosage compensated (Baverstock et al. 1982; Kuroda et al. 2001; Kuroiwa et al. 2002; McQueen et al. 2001; Itoh et al., 2007, 2010; Arnold et al., 2008; Ellegren et al. 2007; Naurin et al., 2011, 2012; Zhang et al., 2010; Wolf and Bryk, 2011; Uebbing et al., 2013). The pattern of overall female bias in X genes (vs. less in autosomes) found in bovine blastocysts has some similarity to the male bias of Z gene expression in birds (compare figure 1A to fig 1 of Itoh et al., 2007). However, the degree of female bias in X genes shown in figure 1A is more modest than the male bias of Z gene expression in birds. The most likely explanation is that M:F expression was averaged over 60 blastocysts in each XX sample, so that blastocysts at different stages of X inactivation contributed to the average, muting the female bias that would be most extreme in blastocysts with the least dosage compensation.
Gene network analysis classified the genes of blastocyst microarray data into 8 modules. These modules can be separated into two groups based on the expression pattern of autosome genes: bimodal in sexual bias (turquoise, red, and pink module) and unimodal (the other modules). In the modules with bimodal autosomal expression, which have male- and female-biased genes and only a few unbiased genes, the autosome genes can be regulated by sexually dimorphic X chromosome genes. This was most clearly observed in the turquoise module. X chromosome genes correlated with turquoise autosomal genes more than autosomal genes correlated with each other. This pattern is expected if the sex bias in expression of autosomal genes is caused by the sex bias in X genes. Moreover, the gene coexpression data more often fit a causal model in which the sex difference in X gene expression drives the sex differences in A gene expression, compared to the reverse model. Although it may be more likely that the X genes in one module are those that drive sex bias of genes in the same module, we cannot exclude the possibility that X genes in other modules drive sexual dimorphism outside of their own module. A minority of X genes appeared to be expressed at the same level in the two sexes, suggesting that network or other expression constraints prevented higher expression of these in females despite the lack of complete dosage compensation.
Supplementary Material
Supplemental table 1 Module gene list for the network analysis shown in Table 1.
Supplemental figure 1 Box plot of the numbers of significantly correlated with autosomal genes in the modules. Red, black, and pink modules are excluded since the X chromosome gene number is too small.
Acknowledgments
This work was supported by NIH grant DC000217 to A.P. Arnold and a Yamada Science Foundation grant to Y. Itoh. We thank Steve Horvath, Peter Langfelder, Xia Yang and Qingying Meng for advice.
References
- Aten JE, Fuller TF, Lusis AJ, Horvath S. Using genetic markers to orient the edges in quantitative trait networks: the NEO software. BMC Syst Biol. 2008;2:34. doi: 10.1186/1752-0509-2-34. [DOI] [PMC free article] [PubMed] [Google Scholar]
- Arnold AP. The end of gonad-centric sex determination in mammals. Trends Genet. 2012;28(2):55–61. doi: 10.1016/j.tig.2011.10.004. [DOI] [PMC free article] [PubMed] [Google Scholar]
- Arnold AP, Itoh Y, Melamed E. A bird's-eye view of sex chromosome dosage compensation. Annu Rev Genomics Hum Genet. 2008;9:109–127. doi: 10.1146/annurev.genom.9.081307.164220. [DOI] [PubMed] [Google Scholar]
- Baverstock PR, Adams M, Polkinghorne RW, Gelder M. A sex-linked enzyme in birds-Z-chromosome conservation but no dosage compensation. Nature. 1982;296:763–766. doi: 10.1038/296763a0. [DOI] [PubMed] [Google Scholar]
- Benjamini Y, Hochberg Y. Controlling the false discovery rate: a practical and powerful approach to multiple testing. Journal of the Royal Statistical Society Series B: Statistical Methodology. 1995;57(1):289–300. [Google Scholar]
- Bermejo-Alvarez P, Rizos D, Lonergan P, Gutierrez-Adan A. Transcriptional sexual dimorphism in elongating bovine embryos: implications for XCI and sex determination genes. Reproduction. 2011a;141(6):801–808. doi: 10.1530/REP-11-0006. [DOI] [PubMed] [Google Scholar]
- Bermejo-Alvarez P, Rizos D, Lonergan P, Gutierrez-Adan A. Transcriptional sexual dimorphism during preimplantation embryo development and its consequences for developmental competence and adult health and disease. Reproduction. 2011b;141(5):563–570. doi: 10.1530/REP-10-0482. [DOI] [PubMed] [Google Scholar]
- Bermejo-Alvarez P, Rizos D, Rath D, Lonergan P, Gutierrez-Adan A. Epigenetic differences between male and female bovine blastocysts produced in vitro. Physiol Genomics. 2008;32(2):264–272. doi: 10.1152/physiolgenomics.00234.2007. [DOI] [PubMed] [Google Scholar]
- Bermejo-Alvarez P, Rizos D, Rath D, Lonergan P, Gutierrez-Adan A. Sex determines the expression level of one third of the actively expressed genes in bovine blastocysts. Proc Natl Acad Sci U S A. 2010;107(8):3394–3399. doi: 10.1073/pnas.0913843107. [DOI] [PMC free article] [PubMed] [Google Scholar]
- Ellegren H, Hultin-Rosenberg L, Brunström B, Dencker L, Kultima K, Scholz B. Faced with inequality: chicken do not have a general dosage compensation of sex-linked genes. BMC Biol. 2007;5:40. doi: 10.1186/1741-7007-5-40. [DOI] [PMC free article] [PubMed] [Google Scholar]
- Harrison PW, Mank JE, Wedell N. Incomplete sex chromosome dosage compensation in the Indian meal moth, Plodia interpunctella, based on de novo transcriptome assembly. Genome Biol Evol. 2012;4(11):1118–1126. doi: 10.1093/gbe/evs086. [DOI] [PMC free article] [PubMed] [Google Scholar]
- Itoh Y, Melamed E, Yang X, Kampf K, Wang S, Yehya N, Van Nas A, Replogle K, Band MR, Clayton DF, Schadt EE, Lusis AJ, Arnold AP. Dosage compensation is less effective in birds than in mammals. J Biol. 2007;6(1):2. doi: 10.1186/jbiol53. [DOI] [PMC free article] [PubMed] [Google Scholar]
- Itoh Y, Replogle K, Kim YH, Wade J, Clayton DF, Arnold AP. Sex bias and dosage compensation in the zebra finch versus chicken genomes: general and specialized patterns among birds. Genome Res. 2010;20(4):512–518. doi: 10.1101/gr.102343.109. [DOI] [PMC free article] [PubMed] [Google Scholar]
- Kuroda Y, Arai N, Arita M, Teranishi M, Hori T, Harata M, Mizuno S. Absence of Z-chromosome inactivation for five genes in male chickens. Chromosome Res. 2001;9(6):457–468. doi: 10.1023/a:1011672227256. [DOI] [PubMed] [Google Scholar]
- Kuroiwa A, Yokomine T, Sasaki H, Tsudzuki M, Tanaka K, Namikawa T, Matsuda Y. Biallelic expression of Z-linked genes in male chickens. Cytogenet Genome Res. 2002;99(1-4):310–314. doi: 10.1159/000071609. [DOI] [PubMed] [Google Scholar]
- Langfelder P, Horvath S. WGCNA: an R package for weighted correlation network analysis. BMC Bioinformatics. 2008;9:559. doi: 10.1186/1471-2105-9-559. [DOI] [PMC free article] [PubMed] [Google Scholar]
- McQueen HA, McBride D, Miele G, Bird AP, Clinton M. Dosage compensation in birds. Curr Biol. 2001;11(4):253–257. doi: 10.1016/s0960-9822(01)00070-7. [DOI] [PubMed] [Google Scholar]
- Naurin S, Hansson B, Hasselquist D, Kim YH, Bensch S. The sex-biased brain: sexual dimorphism in gene expression in two species of songbirds. BMC Genomics. 2011;12:37. doi: 10.1186/1471-2164-12-37. [DOI] [PMC free article] [PubMed] [Google Scholar]
- Naurin S, Hasselquist D, Bensch S, Hansson B. Sex-biased gene expression on the avian Z chromosome: highly expressed genes show higher male-biased expression. PLoS One. 2012;7(10):e46854. doi: 10.1371/journal.pone.0046854. [DOI] [PMC free article] [PubMed] [Google Scholar]
- R Development Core Team. R Foundation for Statistical Computing; Vienna, Austria: 2011. R: A language and environment for statistical computing. URL http://www.R-project.org/ [Google Scholar]
- Tiffin GJ, Rieger D, Betteridge KJ, Yadav BR, King WA. Glucose and glutamine metabolism in pre-attachment cattle embryos in relation to sex and stage of development. J Reprod Fertil. 1991;93(1):125–132. doi: 10.1530/jrf.0.0930125. [DOI] [PubMed] [Google Scholar]
- Uebbing S, Künstner A, Mäkinen H, Ellegren H. Transcriptome Sequencing Reveals the Character of Incomplete Dosage Compensation Across Multiple Tissues in Flycatchers. Genome Biol Evol. 2013;5(8):1555–1566. doi: 10.1093/gbe/evt114. [DOI] [PMC free article] [PubMed] [Google Scholar]
- Wijchers PJ, Festenstein RJ. Epigenetic regulation of autosomal gene expression by sex chromosomes. Trends Genet. 2011;27(4):132–140. doi: 10.1016/j.tig.2011.01.004. [DOI] [PubMed] [Google Scholar]
- Wijchers PJ, Yandim C, Panousopoulou E, Ahmad M, Harker N, Saveliev A, Burgoyne PS, Festenstein R. Sexual dimorphism in mammalian autosomal gene regulation is determined not only by Sry but by sex chromosome complement as well. Dev Cell. 2010;19(3):477–484. doi: 10.1016/j.devcel.2010.08.005. [DOI] [PubMed] [Google Scholar]
- Wolf JB, Bryk J. General lack of global dosage compensation in ZZ/ZW systems? Broadening the perspective with RNA-seq. BMC Genomics. 2011;12:91. doi: 10.1186/1471-2164-12-91. [DOI] [PMC free article] [PubMed] [Google Scholar]
- Zhang B, Horvath S. A general framework for weighted gene co-expression network analysis. Stat Appl Genet Mol Biol. 2005;4 doi: 10.2202/1544-6115.1128. Article17. [DOI] [PubMed] [Google Scholar]
- Zhang SO, Mathur S, Hattem G, Tassy O, Pourquié O. Sex-dimorphic gene expression and ineffective dosage compensation of Z-linked genes in gastrulating chicken embryos. BMC Genomics. 2010;11:13. doi: 10.1186/1471-2164-11-13. [DOI] [PMC free article] [PubMed] [Google Scholar]
- Zhang Y, Zan L, Wang H. Screening candidate genes related to tenderness trait in Qinchuan cattle by genome array. Mol Biol Rep. 2011;38(3):2007–2014. doi: 10.1007/s11033-010-0323-8. [DOI] [PubMed] [Google Scholar]
Associated Data
This section collects any data citations, data availability statements, or supplementary materials included in this article.
Supplementary Materials
Supplemental table 1 Module gene list for the network analysis shown in Table 1.
Supplemental figure 1 Box plot of the numbers of significantly correlated with autosomal genes in the modules. Red, black, and pink modules are excluded since the X chromosome gene number is too small.


