Abstract
In primary culture, hepatocytes dedifferentiate, and their cytoplasm undergoes remodeling. Here, our aim was to characterize changes of mitochondria during remodeling. Hepatocytes were cultured one to five days in complete serum-containing Waymouth’s medium. In rat hepatocytes loaded with MitoTracker Green (MTG), tetramethylrhodamine methylester (TMRM), and/or LysoTracker Red (LTR), confocal microscopy revealed that mitochondria number and mass decreased by approximately 50% between Day 1 and Day 3 of culture. As mitochondria disappeared, lysosomes/autophagosomes proliferated five-fold. Decreased mitochondrial content correlated with (a) decreased cytochrome c oxidase activity and mitochondrial number observed by electron microscopy and (b) a profound decrease of PGC-1α mRNA expression. By contrast, mtDNA content per cell remained constant from the first to the third day of culture, although ethidium bromide (de novo mtDNA synthesis inhibitor) caused mtDNA to decrease by half from the first to the third culture day. As mitochondria disappeared, their MTG label moved into LTR-labeled lysosomes, which was indicative of autophagic degradation. A multiwell fluorescence assay revealed a 2.5-fold increase of autophagy on Day 3 of culture, which was decreased by 3-methyladenine, an inhibitor of autophagy, and also by cyclosporin A and NIM811, both selective inhibitors of the mitochondrial permeability transition (MPT). These findings indicate that mitochondrial autophagy (mitophagy) and the MPT underlie mitochondrial remodeling in cultured hepatocytes.
Keywords: cyclosporin A, dedifferentiation, mitochondrial permeability transition, mitophagy, mtDNA, remodeling
Introduction
Hepatocyte dedifferentiation in culture is relatively poorly understood and is generally explained in terms of decreased expression of liver-specific genes.1 However, in addition to altered gene expression, prominent remodeling of the cytoplasm occurs, characterized by changes of cell shape; cytoskeletal organization, polarity and cell-cell contacts.2–4 Numerous enzyme activities decrease in the cytoplasm, including characteristic hepatic enzymes like cytochrome P450 and tyrosine amino transferase.4,5 Other liver-specific activities, such as albumin secretion also decline.6
During culture, hepatocytes progressively lose mitochondria while simultaneously increasing their content of digestive organelles, such as lysosomes and autophagosomes.7 However, the mechanisms underlying remodeling of the cytoplasm of cultured hepatocytes have not been well characterized. In liver during fasting and cultured hepatocyes after nutrient withdrawal or hormone induction, mitochondria and other organelles such as peroxisomes are eliminated through a dynamic mechanism called autophagy, or macroautophagy.8–10 Specifically, the process of mitochondrial degradation through autophagy is called mitophagy, but the basis by which individual mitochondria are targeted for mitophagy remains poorly understood.11 Parkin, a ubiquitin ligase whose mutations are implicated in early onset Parkinson disease and hepatocellular carcinoma development,12 may provide one targeting mechanism, since dysfunctional mitochondria selectively recruit parkin to promote their autophagy.13 Some studies indicate that mitochondria and other cellular components are randomly selected for autophagy,14,15 whereas other work suggests that the rate of mitochondrial protein and DNA turnover is faster in older mitochondria than newly formed mitochondria.16 In yeast, mitophagy involve direct sequestration of mitochondria into digestive vacuoles, a process of microautophagy, and is selectively retarded in mutants lacking the outer membrane protein, Uth1p.17,18
Mitochondria are frequently the targets of stresses causing opening of nonselective, high conductance mitochondrial permeability transition (MPT) pores that cause mitochondrial depolarization and swelling, leading to both necrotic and apoptotic cell death.19 The MPT may also be involved in mitophagy.20–22 In the MPT, mitochondria become freely permeable to solutes of molecular mass less than about 1.5 KDa through opening of MPT pores. Although sustained MPT pore opening leads to irreversible mitochondrial swelling and loss of proteins like cytochrome c, transient MPT pore opening may also allow mitochondria to take up desirable metabolites and purge themselves of unwanted intermediates and toxicants.23,24 Here, we examine mitophagy during cytoplasmic remodeling of cultured rat hepatocytes. Our data indicate that mitophagy during remodeling leads to a substantial net decrease of mitochondrial number and mass and that the MPT has an important role signaling this degradation.
Results
Diminution of mitochondrial content and cytochrome c activity during hepatic remodeling
To determine the number of mitochondria and acidic organelles during remodeling from Day 1 to Day 5 of culture, rat hepatocytes plated on coverslips were incubated with TMRM or LTR (200 nM) for 20 min in complete growth medium, and confocal image stacks were collected through the entire thickness of individual cells. Single optical sections showed mitochondria taking up TMRM and acidic organelles taking up LTR. For simplicity of expression, we refer to acidic organelles as lysosomes while recognizing that this population may include autophagosomal and endosomal structures as well. The number and mass of mitochondria and lysosomes were quantified for each single optical section.
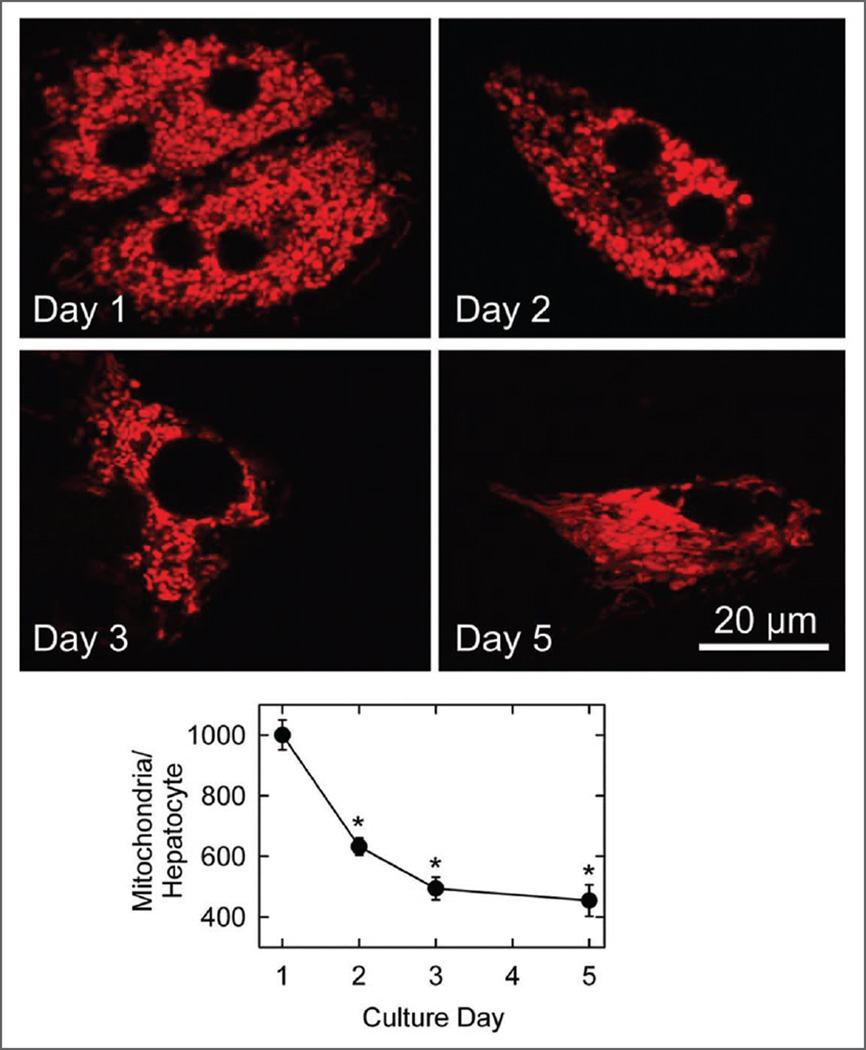
TMRM is a cationic fluorophore that localizes to mitochondria in response to their highly negative membrane potential.25,26 Confocal images of red TMRM fluorescence from Day 1 cultured hepatocytes showed numerous red-fluorescing mitochondria that were relatively homogeneous in size and shape (Fig. 1). From Day 1 to Day 3 of culture, the number of TMRM-labeled mitochondria decreased from 1000.4 ± 49 to 494 ± 37 mitochondria per cell (n = 10 cells, p < 0.001) (Fig. 1). A similar decrease of mitochondrial mass (volume fraction staining with TMRM) also occurred (data not shown). After 5 days in culture, the ovoid shape of mitochondria was replaced by elongated mitochondrial structures, as described previously in dedifferentiated hepatocyte cultures,7 and mitochondrial number became 454 ± 52 per cell (Fig. 1).
Figure 1.
Diminution in mitochondrial content during hepatic remodeling. Hepatocytes were cultured in complete growth medium for 1, 2, 3 and 5 days, labeled with TMRM and imaged, as described in Materials and Methods. Single confocal images are representative of 10 or more experiments. For each culture day, total mitochondrial number per cultured hepatocyte was quantified from stacks of images through the entire thickness of cells. Values are means ± S.E.M (n = 10). *p < 0.001 compared to Day 1.
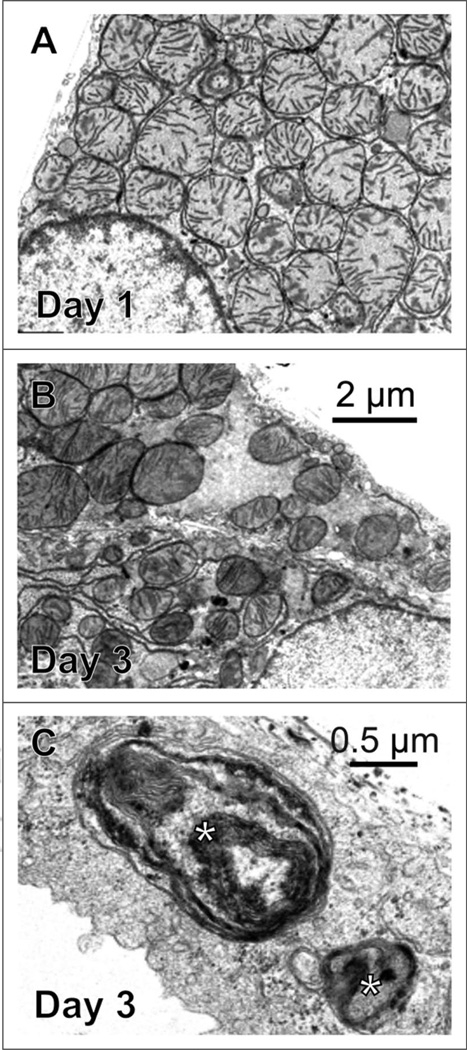
Fluorescence microscopy revealed a highly statistically significant decrease in mitochondrial number during culture of hepatocytes. Electron microscopy was then performed to illustrate the corresponding ultrastructure of these remodeling hepatocytes. After 24 h in culture (Fig. 2A), cytoplasmic ultrastructure of hepatocytes resembled normal liver.27 By Day 3, the cytoplasm showed an obvious depopulation of mitochondria (Fig. 2B). Compared to Day 1, cross sections of mitochondria were less homogeneous in diameter, and their cristae appeared to be shorter (Fig. 2A). An increase in endoplasmic reticulum and lipid droplets was also observed (Fig. 2B and data not shown).
Figure 2.
Electron microscopy of hepatocytes after 1 and 3 days in culture. Shown are transmission electron micrographs of rat hepatocytes after 1 and 3 days in culture. On Day 3 (B), mitochondria content was decreased compared to Day 1 (A), and autophagic structures (*) increased (C). (A and B) are the same magnification.
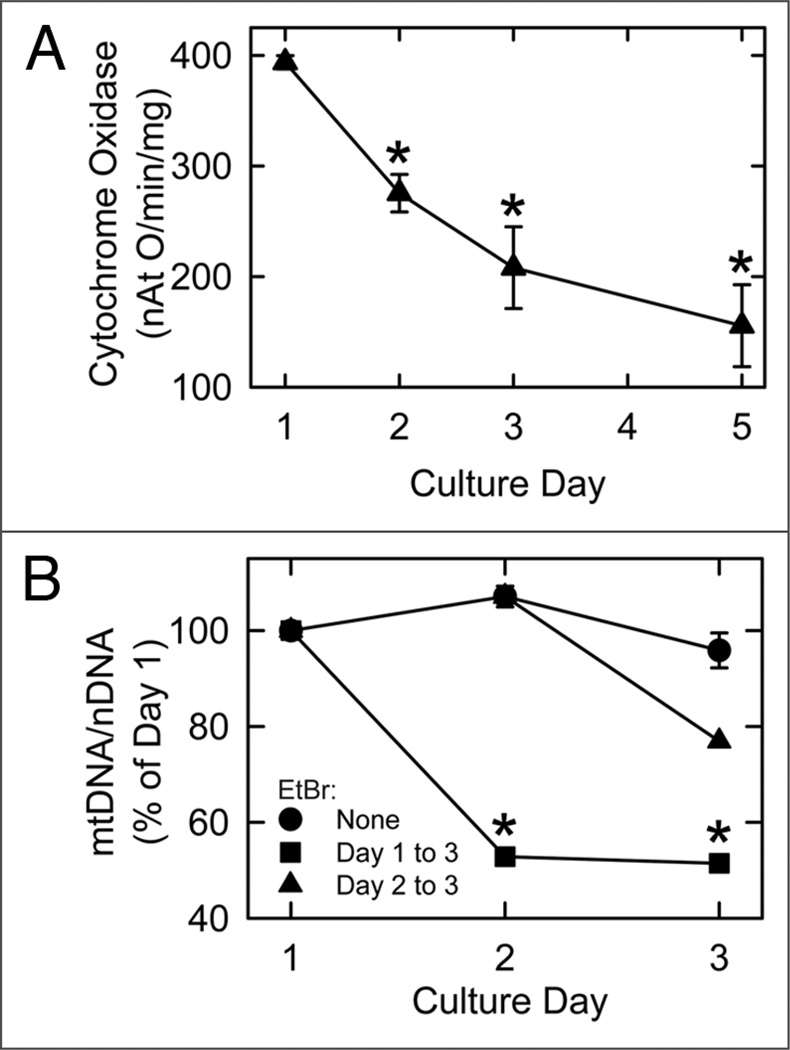
To determine whether biochemical markers of mitochondria decreased proportionally with mitochondrial number during cytoplasmic remodeling, cytochrome c oxidase activity and mtDNA content were analyzed. Vmax for cytochrome c oxidase was measured polarographically and decreased from 394 ± 6 ngAt oxygen/ min/mg protein on Day 1 to 208 ± 37 on Day 3 and 155 ± 37 on Day 5 (Fig. 3A). By contrast, mtDNA content remained constant from the first to the third day of culture (Fig. 3B). Nonetheless, mtDNA turnover still occurred, since Day 1 treatment with ethidium bromide (0.5 µg/ml), an inhibitor of de novo mtDNA synthesis,28 decreased mtDNA content (normalized to nDNA) by half on Days 2 and 3 (Fig. 3B). Day 2 treatment with ethidium bromide also led to a decline of mtDNA on Day 3.
Figure 3.
Cytochrome c oxidase activity and mtDNA content of cultured hepatocytes. Cytochrome c oxidase activity (A) and mtDNA content normalized to nDNA (B) were assayed, as described in Material and Methods. In (B), cultured hepatocytes were treated with 0.5 µg/ ml ethidium bromide (EtBr) on Day 1 or Day 2, as indicated. *p < 0.001 compared to Day 1 in (A) and p < 0.01 compared to no treatment (None) in (B).
Increase of acidic organelles during cytoplasmic remodeling
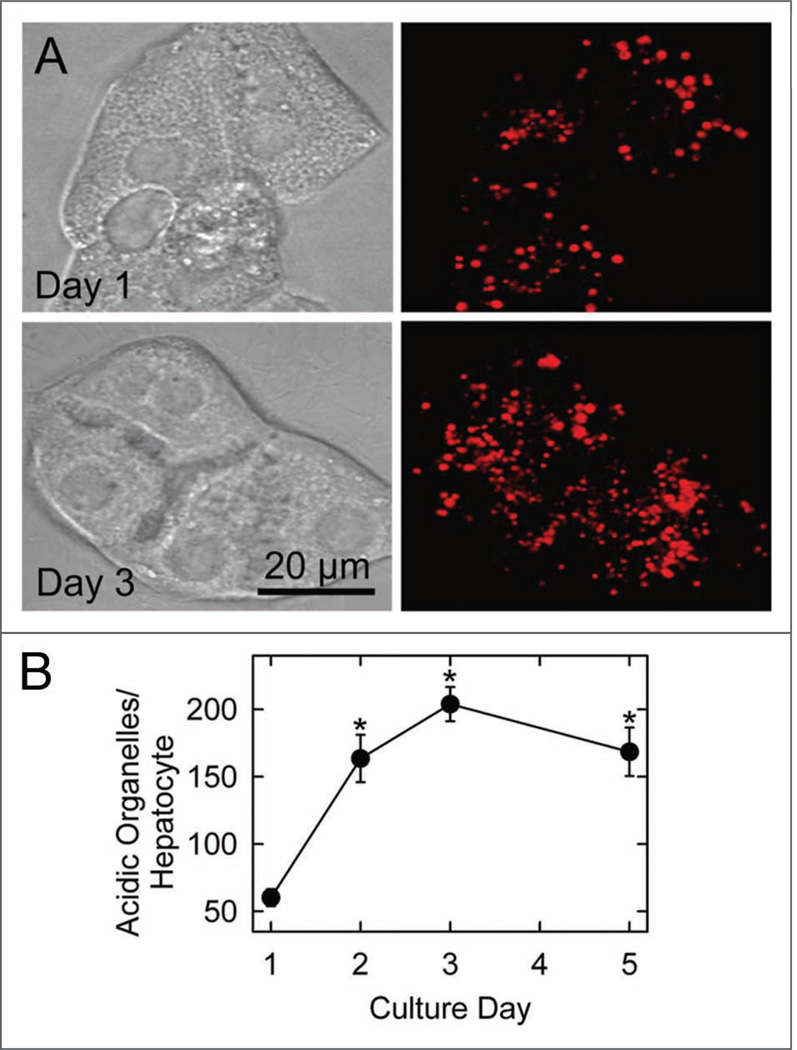
LTR is a weak base that accumulates into the acidic lysosomal/autophagosomal/endosomal compartment.22 After LTR loading, confocal image stacks were collected through the entire thickness of individual cells and superimposed to represent the entire cellular complement of LTR-labeled lysosomes. The number of LTR-labeled organelles per hepatocyte increased markedly from 60.2 ± 6.3 per cell on Day 1 to 203.9 ± 12.7 per cell on Day 3 (n = 10 cells, p < 0.001) (Fig. 4). A commensurate increase of the volume fraction of LTR-labeled organelles also occurred (data not shown). The increased number of LTR-labeled organelles on Day 3 was corroborated by increased numbers of autophagosomes and autolysosomes observed by electron microscopy (Fig. 2C and data not shown). LTR-labeled lysosomes at Day 5 were similar to those observed at Day 3 (168.5 ± 18, Fig. 4B). Despite the lysosomal proliferation, bright field images did not reveal evidence of cell stress or loss of viability, such as blebbing, rounding, detachment, refractileness or shrinkage (Fig. 4A).
Figure 4.
Increase of acidic organelles during hepatocyte remodeling. Cultured hepatocytes were loaded with LTR to label acidic organelles and imaged, as described in Material and Methods. Bright field (left) and superimposed confocal fluorescence image stacks (right) are shown in (A) for representative Day 1 and Day 3 hepatocytes. In (B), the average number of acidic organelles per hepatocyte is plotted versus culture day. Values are means ± S.E.M (n = 10 per group). *p < 0.001 compared to Day 1.
Movement of mitochondria into acidic lysosomal compartments during cytoplasmic remodeling
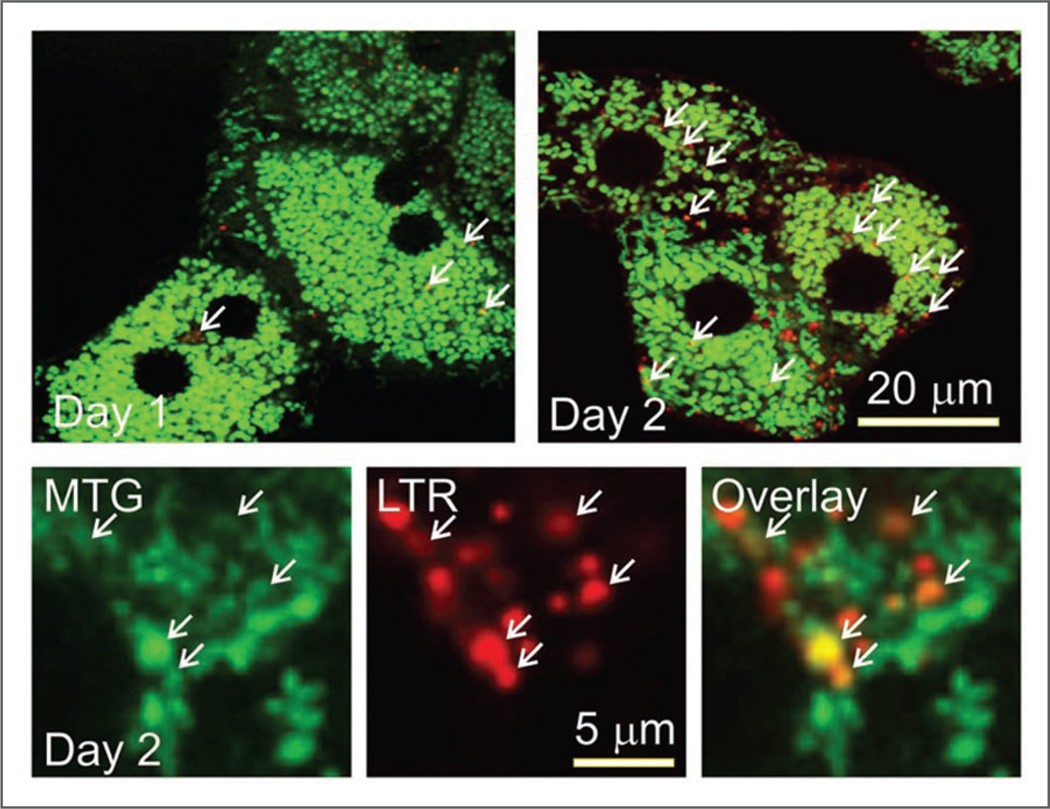
To determine movement of mitochondria into acidic organelles during culture, Day 1 and Day 2 hepatocytes were co-loaded first with MTG and then with LTR.21 MTG is a green-fluorescing fluorophore which like TMRM is taken up electrophoretically into polarized mitochondria. Unlike TMRM, however, chloromethyl groups on MTG form covalent adducts with sulfhydryls of mitochondrial matrix proteins such that MTG is retained even after mitochondrial depolarization. At Day 1 of culture, green mitochondrial MTG fluorescence was already co-localizing with red-fluorescing acidic organelles to appear yellow-orange in the overlays of the red and green fluorescence channels (Fig. 5, arrows, upper left). Co-localization increased from 2.8 ± 0.6 co-labeled structures per single confocal section on Day 1 to 11.6 ± 1.2 co-labeled structures per section on Day 3 (n = 5 cells; p < 0.001) (Fig. 5, upper right and lower). Higher power images showed that structures containing co-localized MTG and LTR were ~1 µm in diameter (Fig. 5, lower). Since confocal slice thickness was 0.7 µm, co-localization was unlikely to have been the consequence of superimposition of different structures within the confocal slice. As previously shown, MTG co-localization with LTR represents translocation of mitochondria into lysosomes during mitophagy.22 Thus, colocalization of MTG and LTR during dedifferentiation/remodeling of mitochondria in cultured hepatocytes represents lysosome-dependent mitophagy.
Figure 5.
Mitochondrial translocation into acidic organelles during hepatocyte remodeling. Hepatocytes cultured for 1 and 2 days were co-loaded with MTG and LTR and imaged, as described in Material and Methods. Arrows identify superimposition of green fluorescing mitochondria with redfluorescing autolysosomes (orange-yellow in color overlay). Lower panels show individual green, red and overlay images at higher power of a portion of the cytoplasm of a Day 2 hepatocyte. Experiments are representative of 5 for each condition.
Suppression of LTR uptake by cyclosporin A, NIM811 and 3-methyladenine
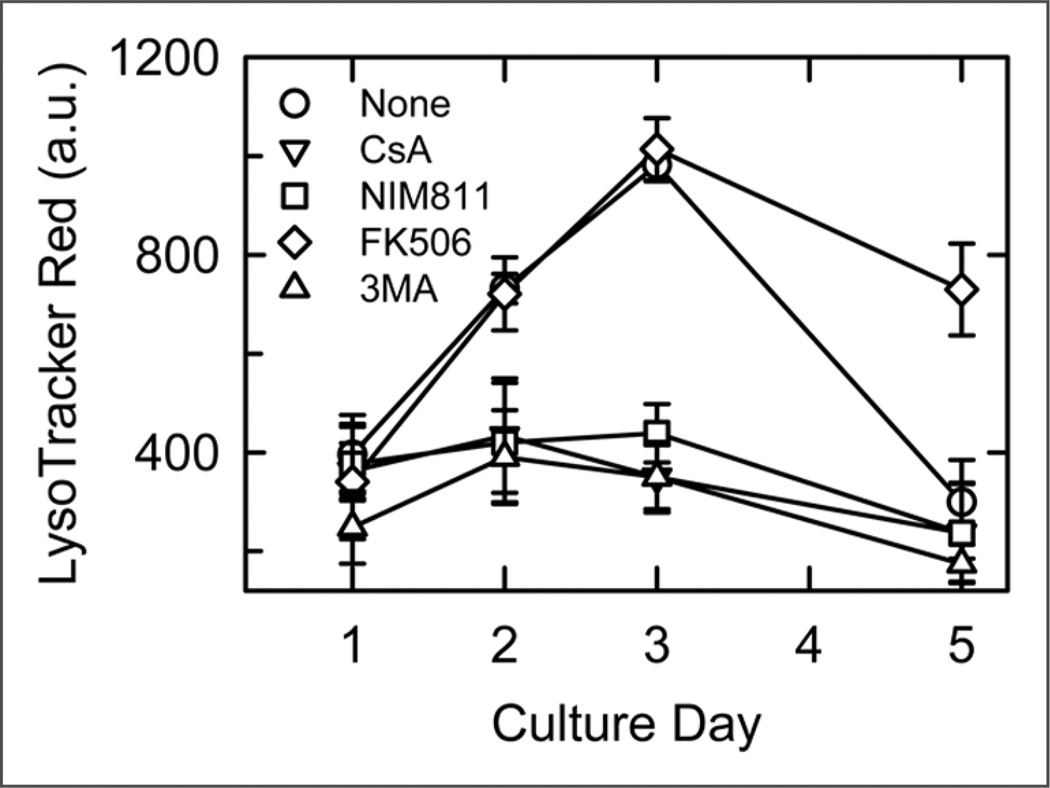
To estimate the size of the acidic lysosomal/autophagosomal compartment in hepatocytes after different times of culture, a LTR-based multiwell fluorescence plate reader assay was employed.22 Compared to Day 1 (100%), LTR uptake increased to 184 ± 7.5% on Day 2 (n = 16, p < 0.001) and 250 ± 8% on Day 3 (n = 16, p < 0.001 vs. Day 1). At Day 5, LTR uptake decreased to a level comparable or less than Day 1 (75.5 ± 22.7%, Fig. 6).
Figure 6.
Supression by 3-methyladenine, cyclosporin A and NIM811 of autophagosomal proliferation. LTR uptake by cultured hepatocytes was assessed using a fluorescence plate reader, as described in Material and Methods. As indicated, hepatocytes were pretreated 30 min with 10 mM 3MA, 5 µM CsA, 5 µM NIM811 or 5 µM tacrolimus (FK506) before addition of LTR. Values are means ± SEM (n = 16 per group). On Days 2 and 3, all treated groups except tacrolimus were significantly different (p < 0.01) than the untreated group (None).
To test the hypothesis that lysosomal proliferation during cytoplasmic remodeling of cultured hepatocytes was the consequence of autophagic activation, Day 1 to Day 5 hepatocytes were exposed to 3-methyladenine (3MA), an inhibitor of Type III phosphatidylinositol 3-kinase required for the early stages of autophagy,29 for 30 min before assessing LTR uptake. At Day 1, 3MA did not decrease LTR uptake, but at Day 2, 3 and 5, 3MA did decrease LTR uptake to levels comparable to Day 1 (Fig. 6), which also indicated that lysosomal proliferation associated with hepatic remodeling was due to autophagy.
To evaluate the role for MPT pore opening in lysosomal proliferation during hepatocyte cytoplasmic remodeling, CsA (5 µM) was added to Day 1 to 5 hepatocytes 30 min before assessing LTR uptake. Like 3MA, CsA treatment did not suppress LTR uptake by Day 1 hepatocytes but completely blocked the increase of LTR uptake observed at Days 2, 3 and 5 (Fig. 6). To assess whether the effect of CsA was due to MPT inhibition rather than inhibition of calcineurin, a Ca2+-dependent protein phosphatase that mediates immunosuppression by CsA,30 hepatocytes were incubated with the nonimmunosuppressive CsA analog, N-methyl-4-isoleucine cyclosporin (NIM811, 5 µM). NIM811 blocks the MPT but does not inhibit calcineurin.31 NIM811 blocked the increase of LTR uptake in Day 2 to 5 hepatocytes to virtually the same extent as CsA (Fig. 6). By comparison, tacrolimus (5 µM), an immunosuppressive calcineurin inhibitor that does not block the MPT, did not inhibit LTR uptake by Day 2 to 5 hepatocytes (Fig. 6).
PGC-1α mRNA expression during remodeling
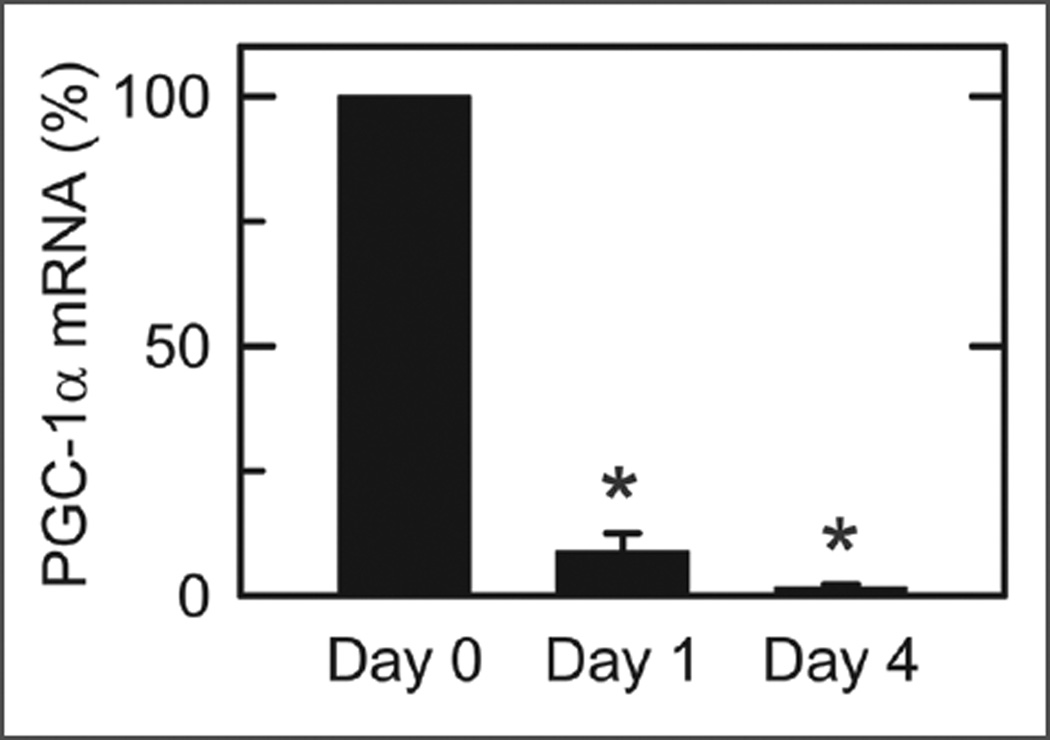
PGC-1α is a transcriptional coactivator that stimulates mitochondrial biogenesis.32 To determine changes of PGC-1α in cultured hepatocytes, quantitative RT-PCR of PGC-1α mRNA was performed in comparison to the housekeeping genes, HPRT and r18S. As shown in Figure 7, PGC-1α mRNA decreased profoundly with increasing times of culture. In comparison to freshly isolated hepatocytes, PGC-1α expression normalized to HPRT decreased 92% on Day 1 and 98% on Day 4. A similar decrease was observed in PGC-1α expression normalized to r18S (data not shown).
Figure 7.
PGC-1α mRNA expression in cultured hepatocytes. PGC-1α mRNA was measured by quantitative RT-PCR in freshly isolated hepatocytes (Day 0) and after 1 and 4 days of culture, as described in Material and Methods. Values are means ± SEM (n = 3 per group). *p < 0.01 compared to Day 0.
Discussion
In culture, hepatocytes decrease their expression of many liverspecific genes,1,33 although early ultrastructural studies suggested that the cytoplasm retains many hepatocellular characteristics at least for a few days.27,34 In the present study on Day 1 of culture, the number of mitochondria and lysosomes assessed by confocal microscopy was comparable to previous estimates by electron microscopy.35,36 After longer periods of culture, however, mitochondria in the cytoplasm of cultured hepatocytes began to remodel rapidly. This remodeling caused a decrease in the number of mitochondria per cell from about 1,000 in 1-day cultured hepatocytes to a little under 500 after 3 days of culture (Fig. 1). The decrease of mitochondrial number was accompanied by a corresponding decrease in the activity of cytochrome c oxidase, a mitochondrial marker enzyme that is located in the mitochondrial inner membrane (Fig. 3A).
As remodeling progressed, mitochondrial structure became more pleomorphic as judged by both light and electron microscopy (Figs. 1 and 2). On Day 1 of culture, mitochondria were spheres and prolate spheroids of about a micron in diameter and similar to hepatocellular mitochondria of intact rat liver.36 Thinner filamentous and branching mitochondria were rare but became progressively more abundant after longer times of culture (Figs. 1 and 2, and data not shown). Heterogeneity of mitochondrial size also increased, and electron microscopy revealed an apparent shortening of cristae (Fig. 2). Overall after 5 days in culture, mitochondrial number, structure and distribution in hepatocytes resembled more that of fibroblasts and cultured cell lines. Shape changes may in part be due to fusion/fission events in association with mitophagy.37
During remodeling, mitochondrial degradation was due to mitophagy, as shown directly by translocation of MTG-labeled mitochondria into LTR-labeled acidic autolysosomal compartments (Fig. 5). Additionally, the number of LTR-labeled punctate structures increased (Fig. 4), the size of the LTR labeled compartment became greater (Fig. 6), and characteristic autophagosomal structures became evident in the cytoplasm by electron microscopy (Fig. 2 and data not shown). These results confirm previous electron microscopic findings of a marked increase of autophagosomes and autolysosomes in 2-day cultured rat hepatocytes.7 3MA, an inhibitor of autophagy, prevents new autophagosomes from forming, and treatment of Day 2 and 3 hepatocytes with 3MA for 30 min decreased LTR uptake to that observed for Day 1 hepatocytes (Fig. 6). Suppression of LTR uptake by 30 min treatment with 3MA was consistent with the time of autophagic sequestration and complete protease-dependent digestion of mitochondria, which averages only about 10 min in hepatocytes.22 Proliferation of autophagosomes and autolysosomes was greatest on Days 2 and 3 of culture when mitochondrial number was decreasing most rapidly. By Day 5, LTR labeling returned to a level at or below that of Day 1, perhaps signifying an end to accelerated mitochondrial degradation (Fig. 6).
The increase of LTR labeling during remodeling on Days 2 and 3 of culture was proportional to that after brief nutrient deprivation (40–90 min) in cultured hepatocytes and Chinese hamster ovary cells.21,22,38 Although the present study only evaluated disappearance of mitochondria, degradation of other organelles during cytoplasmic remodeling is also likely. For example, catalase activity of hepatocytes decreases 95% between 1 and 6 days of culture, signifying degradation of peroxisomes.39 Similarly, degradation of smooth endoplasmic reticulum together with mitochondria occurs after culture of rat Leydig cells.40
Previously, a rate of mitochondrial depolarization and mitophagy of about 0.5% of mitochondria per hour was estimated for 1 day cultured rat hepatocytes in complete growth medium.21 Our observation showing a 50% decrease of mitochondrial number between Days 1 and 3 of culture implies an approximate doubling of this initial rate of mitophagy. The observed decrease of total mitochondrial mass during culture also implies that mitochondrial biogenesis is not replacing mitochondria lost to mitophagy. PGC-1α is a transcriptional coactivator that is a key regulator of mitochondrial biogenesis.32 In cultured hepatocytes, PGC-1α mRNA expression decreased profoundly (Fig. 7). The near absence of PGC-1α expression after 1 or more days in culture likely accounts, at least in part, for the lack of mitochondrial biogenesis to replace mitochondria lost to mitophagy.
Surprisingly in the face of the loss of half the number of mitochondria, mtDNA normalized to nDNA did not decrease with increasing times of culture, as reported previously for cultured hepatocytes.41 One implication of this finding could be that mitophagy selectively removes mitochondria or portions of mitochondria not containing mtDNA. However, when mtDNA synthesis was inhibited with ethidium bromide, the content of mtDNA did decrease in parallel to the decline of mitochondrial numbers. Moreover, other work shows that mtDNA enters autolysosomes and becomes degraded during nutrient deprivation-induced mitophagy.42 Thus, mtDNA and mitochondrial biomass in remodeling hepatocytes appears to be independently regulated.
How culture conditions stimulate mitophagy in hepatocytes remains unknown. Nutrient deprivation in vitro, fasting in vivo, and β-adrenergic stimulation and glucagon are well known inducers of hepatic autophagy.21,43,44 Glucocorticoids are also described to stimulate autophagy, increase protein degradation, and decrease mitochondrial content in hepatocyte monolayers, perhaps by stimulating synthesis of autophagic proteins.34,35,45 Other evidence suggests that dexamethasone delays hepatocyte dedifferentiation in culture,4,46 and for this reason we routinely included dexamethasone in the hepatocyte culture medium. We considered using transfection and siRNA techniques to elucidate mechanisms underlying hepatocyte remodeling further, but such approaches require 1 to 3 days to produce the desired effects on gene expression. By this time in cultured rat hepatocytes, the change of mitochondrial biomass due to remodeling is already virtually complete. Future research utilizing cell biological, microscopic and pharmacologic approaches will be needed to determine the importance of dexamethasone and other aspects of the culture conditions for accelerated mitochondrial remodeling during hepatocyte culture.
In hepatocytes after nutrient deprivation and glucagon stimulation, the MPT is implicated in the initiation of mitophagy since the MPT blockers, CsA and NIM811, inhibit autophagy, whereas tacrolimus, an immunosuppressant that does not block the MPT, does not prevent autophagy.21,22 Similarly, CsA, but not tacrolimus, decreased LTR uptake in Day 2 to 5 hepatocytes to virtually the same extent as the autophagy inhibitior 3MA (Fig. 6). NIM811, a non-immunosuppressive MPT blocker, also inhibited autophagy. These results are consistent with the conclusion that onset of the MPT plays a role in promoting mitophagy during cytoplasmic remodeling of cultured hepatocytes. Suppression of LTR uptake by brief treatment with 3MA, CsA and NIM811 also confirms that the process of mitophagy proceeds to completion within 30 min, as shown previously.22
In conclusion, the cytoplasm of primary hepatocytes undergoes rapid and substantial remodeling during culture, leading to a 50% decrease of mitochondrial number, changes in mitochondrial morphology and proliferation of autophagosomes. Loss of mitochondria is due to mitophagy that appears to be promoted by the MPT or closely related process. Such mitophagy may be important in vivo during hepatic remodeling in response to proliferative and oncogenic stimuli or in response to chronic exposure to toxicants like ethanol.
Material and Methods
Hepatocyte isolation and culture
Primary rat hepatocytes were isolated from overnight fasted male Sprague-Dawley rats (200–250 g) by collagenase (Cat. No. C5138, Sigma-Aldrich) perfusion, as described previously.47 Cell viability routinely exceeded 90%, as assessed by trypan blue exclusion. Hepatocytes were plated on 0.1% type-1 rat tail collagen-coated 40-mm round #1.5 glass coverslips in 60 mm Petri dishes (4.5 × 10⁵ cells/dish) or coverglass-bottomed 35-mm Petri dishes (Cat. No. P35GC-1.5-14-C, MatTek) (3 × 10⁵ cells/dish) in Waymouth’s MB-742/1 medium (Cat. No. 11220-035, Invitrogen) containing 27 mM NaHCO3, 2 mM L-glutamine, 10% fetal calf serum, 100 nM insulin (NDC 0169-1833-11, Novo Nordisk), and 10 nM dexamethasone (NDC 0517-4905-25, American Regent). Hepatocytes were incubated for 1 to 5 days in 5% CO2/95% air at 37°C with the medium changed every other day.
Quantification of mitochondrial and lysosomal content using laser scanning confocal microscopy
To label mitochondria and acidic organelles, cultured hepatocytes were loaded for 20 min with 200 nM tetramethylrhodamine methylester (TMRM, Cat. No. T668, Invitrogen) or 200 nM LysoTracker Red (LTR, Cat. No. L7528, Invitrogen), respectively, in complete growth medium. After loading, coverslips were washed with fresh growth medium, and one third of the initial dye concentration was kept in the medium to maintain steady state loading. Confocal image stacks of TMRM and LTR-loaded hepatocytes were collected at 2 µm intervals with a Zeiss LSM-410 inverted laser scanning confocal microscope (Carl Zeiss) using a 63X oil 1.4 N.A. planapochromat objective lens and excitation light from an argon/ krypton laser. Image analysis was performed using Photoshop software (Adobe Design CS3/4, Adobe Systems). Quantification of the number, size and volume fraction of mitochondria and lysosomes in confocal images and image stacks was performed using Processing Kit 0.4 software.48 Briefly, a superimposing image was generated from 2 single slices through a difference of Gaussians. In each superimposing image, the threshold of each structure was adjusted and processed to get outlined structures. Each outlined structure was quantified using a mathematical function in Photoshop. In this analysis, the number and size of structures staining with TMRM or LTR were determined rather than the intensity of staining. Specifically, individual pixels were scored for the presence or absence of fluorescence above background using the computer algorithm. Mitochondria and lysosomes take up TMRM and LTR, respectively, to a 100 to 1,000-fold concentration gradient. Hence, scoring was unequivocal and not influenced by moderate variations of individual mitochondrial or lysosomal fluorescence intensity. As shown previously, the number of depolarized mitochondria (mitochondria not taking of TMRM) is a very small percentage of the total.21,49
Laser scanning confocal microscopy of hepatocytes co-loaded with lysotracker red and mitotracker green
In other experiments, hepatocytes were loaded with green-fluorescing MitoTracker Green (MTG, 0.5 µM, Cat. No. M7514, Invitrogen) for 60 min at 37°C in Waymouth’s medium followed by twice washing with fresh medium and loading with the red-fluorescing LysoTracker Red (LTR, 0.5 µM) for 20 min under identical conditions. After MTG and LTR loading, one third of the initial concentration of LTR was kept in the medium to maintain steady state loading. The fluorescence of MTG and LTR was monitored with a Zeiss LSM 510 inverted laser scanning confocal microscope using a 63X oil 1.4 N.A. planapochromat objective lens. Excitation of LTR at 543 nm was provided by a helium/neon laser, and fluorescence emission was measured through a 560-nm long pass barrier filter. Excitation of MTG at 488 nm was provided by an argon laser, and fluorescence emission was measured through 500–550 band pass barrier filter. Laser excitation energy was attenuated 100- to 1,000-fold to minimize photobleaching and photodamage.
Multiwell plate reader assay of lysotracker red labeling
Some hepatocytes were cultured in complete growth medium on Type 1 rat tail collagen-coated 48-well microtiter plates (7.5 × 10⁴ cells, Cat. No. 353078, BD Falcon). After 1 to 5 days of incubation, hepatocytes were washed with fresh Krebs-Ringer HEPES (KRH) buffer and loaded with LysoTracker Red (LTR, 50 nM), a selective marker for acidic organelles including autophagosomes, lysosomes and endosomes, for 20 min in humidified air at 37°C. After LTR loading, the cells were washed with fresh KRH and fixed with 2% paraformaldehyde in phosphate buffer for 10 min at 4°C. After an additional wash in KRH, red fluorescence (>590 nm) excited with green light (530 nm) was measured in a FLUOstar fluorescence plate reader (BMG LabTechnologies), as described.22 In some experiments, 3MA (10 mM, Cat. No. M9281, Sigma-Aldrich), cyclosporin A (CsA, 5 µM, Cat. No. 239835, Calbiochem-Novabiochem), NIM811 (5 µM, Novartis), or tacrolimus (5 µM, NDC 0469-3016-01, Fujisawa) was added 30 min before LTR loading.
Ultrastructure analysis
Hepatocytes were fixed by immersion after 1 to 3 days of culture in 1% glutaraldehyde, 1% tannic acid, 0.125 M sodium cacodylate buffer, pH 7.3 immediately after removal of the culture medium. Specimens were post-fixed with 1% OsO4 in 0.1 M sodium cacodylate buffer for 20 min and dehydrated in graded alcohols. Areas containing cells were cut out, removed from the culture dishes and embedded in 1:1 Epon:propylene oxide. Sections were cut orthogonally to the cell monolayer with a diamond knife (Diatome) to show the cells in cross section. Thin sections were observed in a JEOL 200CX electron microscope, and images were recorded with a Gatan 794 digital camera.
DNA content
The ratio of mitochondrial DNA (mtDNA) to nuclear DNA (nDNA) was determined, as described.41 Briefly, DNA was extracted from hepatocytes using DNAzol reagent (Cat. No. 10503-027, Invitrogen) according to the manufacturer’s instructions and digested with RNase A (Cat. No. 12091021, Invitrogen) and the restriction enzyme BamHI (Cat. No. 15201031, Invitrogen). The digest was extracted with phenol/ chloroform, precipitated with ethanol and redissolved in 1 mM tris-HCl buffer, pH 7.5 and 0.1 mM EDTA. Digested DNA (1 µg) was separated by 0.6% agarose gel electrophoresis, transferred to nylon membranes (Hybond-N, Cat. No. RPN1510N, GE Health Care), and hybridized with radiolabeled probes for a 1 kbp fragment of mtDNA and a 2 kbp fragment of the 18S rRNA gene.41 Hybridization was quantified with a STORM image scanner (Amersham Biosciences).
Quantitative RT-PCR
Total RNA from primary rat hepatocytes was isolated using an RNeasy kit (Cat. No. 74104, Qiagen). RNA was quantified using a NanoDrop ND-1000 Spectrophotometer (Thermo Fisher Scientific). cDNA was generated from 0.2 µg of RNA using an iScript cDNA Synthesis kit (Cat. No. 170-8890, Bio-Rad). Real-time quantitative PCR was performed on a MyiQ single-color real-time PCR detection system (BioRad). The forward and reverse primers used for each gene examined were: peroxisome proliferator-activated receptor-gamma co-activator 1α (PGC-1α), ACA GCT TTC TGG GTG GAT TG and GCA AGT TTG CCT CAT TCT CTT; hypoxanthine phophoribosyltransferase (HPRT), GCT TTC CCT GGT TAA GCA GTA CA and CAA ACT TGT CTG GAA TTT CAA ATC; and 18S ribosomal RNA (r18S), GGC CCG AAG CGT TTA CTT and CGG CCG TCC CTC TTA ATC. PCR reactions were performed in a 96-well plate with a reaction mixture containing 15 µl iQ SYBR Green Supermix (Cat. No. 170-8885, Bio-Rad), cDNA template, and 200 nM each of forward and reverse primers in a total volume of 30 µL. All reactions were performed in triplicate. The thermal cycling conditions were set at 95°C for 3 min, followed by 40 cycles of 2-step amplification (10 sec at 95°C and 45 sec at 55°C). Melting curves were analyzed to assess the specificity of the amplicon. Data were analyzed with BioRad MyiQ software. The abundance of PGC-1α was normalized against HPRT using the ΔΔCt method. r18S was used as a second housekeeping gene.
Cytochrome c oxidase assay
Cytochrome c oxidase activity (Vmax) was measured polarographically with a Clark oxygen electrode (50) in 10 mM potassium phosphate buffer, pH 7.4, 5 mM sodium ascorbate, 2.7 mM N,N,N,N’-tetramethylp-phenylenediamine dihydrochloride (Cat. No. 87890, Sigma- Aldrich), 0.02% Triton X-100 and 1 µM horse cytochrome c (Cat. No. 105201, Sigma-Aldrich). At the end of each trace, 10 mM sodium azide was added. Cytochrome c oxidase activity was calculated as the azide sensitive oxygen consumption rate.
Statistical analysis
Data points represent means ± S.E.M. Differences between means were evaluated using the Student’s t-test with p < 0.05 as the criterion of significance.
Acknowledgements
This work was supported, in part, by grants DK59340, DK37034 and DK073336 with support for imaging facilities by grants 5-P30-DK34987 and 1-P50-AA11605 from the National Institutes of Health. Dr. Rodriguez-Enriquez was supported by a postdoctoral fellowship from CONACyT-Mexico. NIM811 was the kind gift of Novartis.
Abbreviations
- 3MA
3-methyladenine
- CsA
cyclosporin A
- HPRT
hypoxanthine phophoribosyltransferase
- LTR
lysotracker red
- mtDNA
mitochondrial DNA
- MTG
mitotracker green
- MPT
mitochondrial permeability transition
- NIM811
N-methyl-4-isoleucine cyclosporin
- nDNA
nuclear DNA
- PGC-1α
peroxisome proliferator-activated receptor-gamma co-activator 1α
- r18S
18S ribosomal RNA
- TMRM
tetramethylrodamine methyl ester
References
- 1.Baker TK, Carfagna MA, Gao H, Dow ER, Li Q, Searfoss GH, Ryan TP. Temporal gene expression analysis of monolayer cultured rat hepatocytes. Chem Res Toxicol. 2001;14:1218–1231. doi: 10.1021/tx015518a. [DOI] [PubMed] [Google Scholar]
- 2.Blaheta RA, Kronenberger B, Woitaschek D, Auth MK, Scholz M, Weber S, et al. Dedifferentiation of human hepatocytes by extracellular matrix proteins in vitro: quantitative and qualitative investigation of cytokeratin 7, 8, 18, 19 and vimentin filaments. J Hepatol. 1998;28:677–690. doi: 10.1016/s0168-8278(98)80293-6. [DOI] [PubMed] [Google Scholar]
- 3.LeCluyse EL, Bullock PL, Parkinson A, Hochman JH. Cultured rat hepatocytes. Pharm Biotechnol. 1996;8:121–159. doi: 10.1007/978-1-4899-1863-5_9. [DOI] [PubMed] [Google Scholar]
- 4.Arterburn LM, Zurlo J, Yager JD, Overton RM, Heifetz AH. A morphological study of differentiated hepatocytes in vitro. Hepatology. 1995;22:175–187. [PubMed] [Google Scholar]
- 5.Steward AR, Dannan GA, Guzelian PS, Guengerich FP. Changes in the concentration of seven forms of cytochrome P-450 in primary cultures of adult rat hepatocytes. Mol Pharmacol. 1985;27:125–132. [PubMed] [Google Scholar]
- 6.Dunn JC, Yarmush ML, Koebe HG, Tompkins RG. Hepatocyte function and extracellular matrix geometry: long-term culture in a sandwich configuration. FASEB J. 1989;3:174–177. doi: 10.1096/fasebj.3.2.2914628. [DOI] [PubMed] [Google Scholar]
- 7.Knop E, Bader A, Boker K, Pichlmayr R, Sewing KF. Ultrastructural and functional differentiation of hepatocytes under long-term culture conditions. Anat Rec. 1995;242:337–349. doi: 10.1002/ar.1092420307. [DOI] [PubMed] [Google Scholar]
- 8.Mizushima N, Levine B, Cuervo AM, Klionsky DJ. Autophagy fights disease through cellular self-digestion. Nature. 2008;451:1069–1075. doi: 10.1038/nature06639. [DOI] [PMC free article] [PubMed] [Google Scholar]
- 9.Lardeux BR, Mortimore GE. Amino acid and hormonal control of macromolecular turnover in perfused rat liver. Evidence for selective autophagy. J Biol Chem. 1987;262:14514–14519. [PubMed] [Google Scholar]
- 10.Arstila A, Shelburne JD, Trump BF. Studies on cellular autophagocytosis. A histochemical study on sequential alterations of mitochondria in the glucagon-induced autophagic vacuoles of rat liver. Lab Invest. 1972;27:317–323. [PubMed] [Google Scholar]
- 11.Lemasters JJ. Selective mitochondrial autophagy, or mitophagy, as a targeted defense against oxidative stress, mitochondrial dysfunction and aging. Rejuvenation Res. 2005;8:3–5. doi: 10.1089/rej.2005.8.3. [DOI] [PubMed] [Google Scholar]
- 12.Fujiwara M, Marusawa H, Wang HQ, Iwai A, Ikeuchi K, Imai Y, et al. Parkin as a tumor suppressor gene for hepatocellular carcinoma. Oncogene. 2008;27:6002–6011. doi: 10.1038/onc.2008.199. [DOI] [PubMed] [Google Scholar]
- 13.Narendra D, Tanaka A, Suen DF, Youle RJ. Parkin is recruited selectively to impaired mitochondria and promotes their autophagy. J Cell Biol. 2008;183:795–803. doi: 10.1083/jcb.200809125. [DOI] [PMC free article] [PubMed] [Google Scholar]
- 14.Kopitz J, Kisen GO, Gordon PB, Bohley P, Seglen PO. Nonselective autophagy of cytosolic enzymes by isolated rat hepatocytes. J Cell Biol. 1990;111:941–953. doi: 10.1083/jcb.111.3.941. [DOI] [PMC free article] [PubMed] [Google Scholar]
- 15.Vargas JL, Roche E, Knecht E, Grisolia S. Differences in the half-lives of some mitochondrial rat liver enzymes may derive partially from hepatocyte heterogeneity. FEBS Lett. 1987;224:182–186. doi: 10.1016/0014-5793(87)80444-1. [DOI] [PubMed] [Google Scholar]
- 16.Davis AF, Clayton DA. In situ localization of mitochondrial DNA replication in intact mammalian cells. J Cell Biol. 1996;135:883–893. doi: 10.1083/jcb.135.4.883. [DOI] [PMC free article] [PubMed] [Google Scholar]
- 17.Kissova I, Deffieu M, Manon S, Camougrand N. Uth1p is involved in the autophagic degradation of mitochondria. J Biol Chem. 2004;279:39068–39074. doi: 10.1074/jbc.M406960200. [DOI] [PubMed] [Google Scholar]
- 18.Bergamini E, Cavallini G, Donati A, Gori Z. The role of macroautophagy in the ageing process, anti-ageing intervention and age-associated diseases. Int J Biochem Cell Biol. 2004;36:2392–2404. doi: 10.1016/j.biocel.2004.05.007. [DOI] [PubMed] [Google Scholar]
- 19.Kim JS, He L, Lemasters JJ. Mitochondrial permeability transition: a common pathway to necrosis and apoptosis. Biochem Biophys Res Commun. 2003;304:463–470. doi: 10.1016/s0006-291x(03)00618-1. [DOI] [PubMed] [Google Scholar]
- 20.Lemasters JJ, Nieminen AL, Qian T, Trost LC, Elmore SP, Nishimura Y, et al. The mitochondrial permeability transition in cell death: a common mechanism in necrosis, apoptosis and autophagy. Biochim Biophys Acta. 1998;1366:177–196. doi: 10.1016/s0005-2728(98)00112-1. [DOI] [PubMed] [Google Scholar]
- 21.Elmore SP, Qian T, Grissom SF, Lemasters JJ. The mitochondrial permeability transition initiates autophagy in rat hepatocytes. FASEB J. 2001;15:2286–2287. doi: 10.1096/fj.01-0206fje. [DOI] [PubMed] [Google Scholar]
- 22.Rodriguez-Enriquez S, Kim I, Currin RT, Lemasters JJ. Tracker dyes to probe mitochondrial autophagy (mitophagy) in rat hepatocytes. Autophagy. 2006;2:39–46. doi: 10.4161/auto.2229. [DOI] [PMC free article] [PubMed] [Google Scholar]
- 23.Zoratti M, Szabo I. The mitochondrial permeability transition. Biochim Biophys Acta. 1995;1241:139–176. doi: 10.1016/0304-4157(95)00003-a. [DOI] [PubMed] [Google Scholar]
- 24.Bernardi P, Forte M. The mitochondrial permeability transition pore. Novartis Found Symp. 2007;287:157–164. [PubMed] [Google Scholar]
- 25.Ehrenberg B, Montana V, Wei M-D, Wuskell JP, Loew LM. Membrane potential can be determined in individual cells from the Nernstian distribution of cationic dyes. Biophys J. 1988;53:785–794. doi: 10.1016/S0006-3495(88)83158-8. [DOI] [PMC free article] [PubMed] [Google Scholar]
- 26.Chacon E, Reece JM, Nieminen AL, Zahrebelski G, Herman B, Lemasters JJ. Distribution of electrical potential, pH free Ca2+, and volume inside cultured adult rabbit cardiac myocytes during chemical hypoxia: a multiparameter digitized confocal microscopic study. Biophys J. 1994;66:942–952. doi: 10.1016/S0006-3495(94)80904-X. [DOI] [PMC free article] [PubMed] [Google Scholar]
- 27.Bissell DM, Hammaker LE, Meyer UA. Parenchymal cells from adult rat liver in nonproliferating monolayer culture I. Functional studies. J Cell Biol. 1973;59:722–734. doi: 10.1083/jcb.59.3.722. [DOI] [PMC free article] [PubMed] [Google Scholar]
- 28.Wang GJ, Nutter LM, Thayer SA. Insensitivity of cultured rat cortical neurons to mitochondrial DNA synthesis inhibitors: evidence for a slow turnover of mitochondrial DNA. Biochem Pharmacol. 1997;54:181–187. doi: 10.1016/s0006-2952(97)00158-5. [DOI] [PubMed] [Google Scholar]
- 29.Seglen PO, Gordon PB. 3-Methyladenine: specific inhibitor of autophagic/lysosomal protein degradation in isolated rat hepatocytes. Proc Natl Acad Sci USA. 1982;79:1889–1892. doi: 10.1073/pnas.79.6.1889. [DOI] [PMC free article] [PubMed] [Google Scholar]
- 30.Perrino BA, Wilson AJ, Ellison P, Clapp LH. Substrate selectivity and sensitivity to inhibition by FK506 and cyclosporin A of calcineurin heterodimers composed of the alpha or beta catalytic subunit. Eur J Biochem. 2002;269:3540–3548. doi: 10.1046/j.1432-1033.2002.03040.x. [DOI] [PubMed] [Google Scholar]
- 31.Waldmeier PC, Feldtrauer JJ, Qian T, Lemasters JJ. Inhibition of the mitochondrial permeability transition by the nonimmunosuppressive cyclosporin derivative NIM811. Mol Pharmacol. 2002;62:22–29. doi: 10.1124/mol.62.1.22. [DOI] [PubMed] [Google Scholar]
- 32.Spiegelman BM. Transcriptional control of mitochondrial energy metabolism through the PGC1 coactivators. Novartis Found Symp. 2007;287:60–63. [PubMed] [Google Scholar]
- 33.Balkovetz DF, Gerrard ER, Jr, Li S, Johnson D, Lee J, Tobias JW, et al. Gene expression alterations during HGF-induced dedifferentiation of a renal tubular epithelial cell line (MDCK) using a novel canine DNA microarray. Am J Physiol Renal Physiol. 2004;286:702–710. doi: 10.1152/ajprenal.00270.2003. [DOI] [PubMed] [Google Scholar]
- 34.Chapman GS, Jones AL, Meyer UA, Bissell DM. Parenchymal cells from adult rat liver in nonproliferating monolayer culture II. Ultrastructural studies. J Cell Biol. 1973;59:735–747. doi: 10.1083/jcb.59.3.735. [DOI] [PMC free article] [PubMed] [Google Scholar]
- 35.Wiener J, Loud AV, Kimberg DV, Spiro D. A quantitative description of cortisone-induced alterations in the ultrastructure of rat liver parenchmal cells. J Cell Biol. 1968;37:47–61. doi: 10.1083/jcb.37.1.47. [DOI] [PMC free article] [PubMed] [Google Scholar]
- 36.Loud AV. A quantitative stereological description of the ultrastructure of normal rat liver parenchymal cells. J Cell Biol. 1968;37:27–46. doi: 10.1083/jcb.37.1.27. [DOI] [PMC free article] [PubMed] [Google Scholar]
- 37.Twig G, Elorza A, Molina AJ, Mohamed H, Wikstrom JD, Walzer G, et al. Fission and selective fusion govern mitochondrial segregation and elimination by autophagy. EMBO J. 2008;27:433–446. doi: 10.1038/sj.emboj.7601963. [DOI] [PMC free article] [PubMed] [Google Scholar]
- 38.Munafo DB, Colombo MI. A novel assay to study autophagy: regulation of autophagosome vacuole size by amino acid deprivation. J Cell Sci. 2001;114:3619–3629. doi: 10.1242/jcs.114.20.3619. [DOI] [PubMed] [Google Scholar]
- 39.Munafo DB, Colombo MI. Induction of autophagy causes dramatic changes in the subcellular distribution of GFP-Rab24. Traffic. 2002;3:472–482. doi: 10.1034/j.1600-0854.2002.30704.x. [DOI] [PubMed] [Google Scholar]
- 40.Yi J, Tang XM. Functional implication of autophagy in steroid-secreting cells of the rat. Anat Rec. 1995;242:137–146. doi: 10.1002/ar.1092420202. [DOI] [PubMed] [Google Scholar]
- 41.Kai Y, Takamatsu C, Tokuda K, Okamoto M, Irita K, Takahashi S. Rapid and random turnover of mitochondrial DNA in rat hepatocytes of primary culture. Mitochondrion. 2006;6:299–304. doi: 10.1016/j.mito.2006.10.002. [DOI] [PubMed] [Google Scholar]
- 42.Kim I, Rodriguez-Enriquez S, Lemasters JJ. Minireview: Selective degradation of mitochondria by mitophagy. Arch Biochem Biophys. 2007;462:245–253. doi: 10.1016/j.abb.2007.03.034. [DOI] [PMC free article] [PubMed] [Google Scholar]
- 43.Arstila AU, Shelburne JD, Trump BF. Studies on cellular autophagocytosis. A histochemical study on sequential alterations of mitochondria in the glucagoninduced autophagic vacuoles of rat liver. Lab Invest. 1972;27:317–323. [PubMed] [Google Scholar]
- 44.Lardeux BR, Mortimore GE. Amino acid and hormonal control of macromolecular turnover in perfused rat liver. Evidence for selective autophagy. J Biol Chem. 1987;262:14514–14519. [PubMed] [Google Scholar]
- 45.Hopgood MF, Clark MG, Ballard FJ. Stimulation by glucocorticoids of protein degradation in hepatocyte monolayers. Biochem J. 1981;196:33–40. doi: 10.1042/bj1960033. [DOI] [PMC free article] [PubMed] [Google Scholar]
- 46.Moshage HJ, de Haard HJ, Princen HM, Yap SH. The influence of glucocorticoid on albumin synthesis and its messenger RNA in rat in vivo and in hepatocyte suspension culture. Biochim Biophys Acta. 1985;824:27–33. doi: 10.1016/0167-4781(85)90025-9. [DOI] [PubMed] [Google Scholar]
- 47.Gores GJ, Nieminen AL, Fleishman KE, Dawson TL, Herman B, Lemasters JJ. Extracellular acidosis delays onset of cell death in ATP-depleted hepatocytes. Am J Physiol. 1988;255:315–322. doi: 10.1152/ajpcell.1988.255.3.C315. [DOI] [PubMed] [Google Scholar]
- 48.Russ JC. The Image Processing Handbook. 3rd ed. Vol. 77 Boca Raton, Florida: CRC Press; 2005. [Google Scholar]
- 49.Elmore SP, Nishimura Y, Qian T, Herman B, Lemasters JJ. Discrimination of depolarized from polarized mitochondria by confocal fluorescence resonance energy transfer. Arch Biochem Biophys. 2004;422:145–152. doi: 10.1016/j.abb.2003.12.031. [DOI] [PubMed] [Google Scholar]
- 50.Estabrook RW. Methods Enzymology. 1967:41–47. [Google Scholar]


