

Abstract
MicroRNAs (miRNAs) have been shown to regulate viral infection, but the miRNAs that target intracellular sensors and adaptors of innate immunity have not been fully uncovered. Here we conduct a miRNA mimic screen and validation with miRNA inhibitors in cells infected with vesicular stomatitis virus (VSV) to identify miRNAs that regulate viral-host interactions. We identify miR-576-3p as a robust regulator of infection by VSV and other RNA and DNA viruses. While a miR-576-3p mimic sensitizes cells to viral replication, inhibition of endogenous miR-576-3p prevents infection. miR-576-3p is induced by IRF3 concomitantly with interferon and targets STING, MAVS and TRAF3, which are critical factors for interferon expression. Interestingly, miR-576-3p and its binding sites are primate-specific and miR-576-3p levels are reduced in inflammatory diseases. These findings indicate that induction of miR-576-3p by IRF3 triggers a feedback mechanism to reduce interferon expression and set an antiviral response threshold to likely avoid excessive inflammation.
Although studies on the functions of host miRNAs during viral infection are still at early stages, increasing evidence suggests that miRNAs play a key role in the regulation of viral infection1. While viruses may utilize cellular miRNAs to promote their replication, miRNA expression can also facilitate the host antiviral response through interaction with viral RNA or by negatively regulating host factors required for viral proliferation. One example is miR-199a-3p, which has antiviral activity by regulating various pathways targeted by viruses such as the PI3K/AKT and ERK/MAPK pathways, oxidative stress signaling, and prostaglandin synthesis2. Studies in vivo by Otsuka et al demonstrated that mice harboring a mutant Dicer allele were hypersusceptible to VSV infection, suggesting that host miRNAs contribute to host resistance to viral infection3. VSV is a useful model virus for understanding viral infection processes as well as innate and adaptive immune responses. VSV is a negative sense RNA virus that replicates in the cytoplasm of most vertebrate and many invertebrate cell types4,5. During infection, viruses are susceptible to innate immune responses that induce type I IFN and inflammatory cytokines. Upon cytoplasmic entry, viral RNA is recognized by a family of DExD/H-box helicases that include retinoic acid inducible gene 1 (RIG-I) and melanoma differentiation associated antigen 5 (MDA5)6,7. Upon interaction with viral RNA, RIG-I and MDA5 associate with the adaptor protein MAVS (also known as IPS-1, VISA, or CARDIF) to facilitate activation of transcription factors that induce type I IFN signaling8–11. The efficient induction of antiviral response to intracellular viral RNA and also foreign DNA was shown to involve a central adaptor molecule STING (stimulator of IFN genes), an ER-associated protein that interacts with RIG-I and MAVS12,13. Recently, it was shown that foreign DNA such as that released by viruses in the cytoplasm is sensed by the enzyme cyclic GMP-AMP synthase (CGAS), which synthesizes cyclic-di-GMP-AMP molecules that are recognized by STING to induce IFN signaling14,15. Thus, type I IFN interferon production represents a major antiviral response pathway and STING is a key mediator of this response.
In this manuscript, we identify a novel primate-specific microRNA-driven feedback mechanism that prevents excessive innate immune signaling that can lead to abnormal inflammation. By using an unbiased genome-wide screening approach to search for miRNAs that regulate viral-host interactions, we identified miR-576-3p, which is induced by IRF3 and in turn down-regulates key constituents of the IFN expression pathway, such as STING, MAVS and TRF3, to avert sustained immune signaling.
Results and Discussion
Identification of miRNAs that regulate viral infection
To identify novel miRNAs that are key regulators of viral infection, we analyzed the impact of expressing a library of human miRNA mimics on the viability of cells infected with VSV (Fig. 1a). The miRNA mimics are synthetic RNA duplexes, which are functionally equivalent to mature miRNAs that have been processed by Dicer. Upon transfection into cells, the mimics lead to down-regulation of target genes. The screen was conducted in human bronchial epithelial cells (HBEC)16, which represent a common site of viral infection. To determine that transfection of miRNA mimics themselves do not impact viral infection, a non-targeting miRNA mimic from C. elegans was used as a negative control and was included in each plate to normalize variations between plates. In addition, an siRNA to Ubiquitin B (UBB), which leads to cell death, was used to monitor transfection efficiency and as a metric for total loss of cell viability. After transfection of miRNA mimics, cells were infected with a VSV strain that expresses GFP, so that the progression of infection could be monitored in live cells by fluorescence (Fig. 1b). Infection conditions were optimized so that control-transfected cells exhibited approximately 50% cell death after 20 hours of infection (Fig. 1c). This allowed for the identification of miRNAs that promote resistance or sensitivity to infection. A total of 810 mimics representing 723 unique miRNAs were analyzed. Those mimics that resulted in toxicity upon transfection in the absence of VSV infection were excluded from further analysis (Fig. 1d and Supplementary Data 1).
Figure 1. Identification of host miRNAs that regulate VSV infection.

a, Design of high-throughput miRNA mimic screen. HBEC were reverse transfected with a library of miRNA mimics at a concentration of 50 nM. Control miRNA mimics and siRNAs to Ubiquitin B (UBB) were included as negative and positive controls for cell death, respectively. After 72 h of transfection, cells were mock-infected or infected with VSV-GFP at MOI of 3 for 20 h. Cytotoxicity was determined by measuring ATP levels. Experimental values were normalized using two-point normalization to the medians of the miRNA mimic negative control and the UBB siRNA cytotoxicity control. b, HBEC were infected with VSV-GFP and infection was monitored by fluorescence microscopy. Scale bar, 100 µM. c, HBECs were infected with various multiplicities of infection (MOI) to determine the MOI resulting in 50% cell viability. Relative cell viability was determined by measuring ATP levels. d, Cell viability for each miRNA mimic-transfected well and infected as in a was measured. miRNA mimics were excluded as potential hits in the infected cell data set if viabilities in uninfected cells were < 0.8 (dotted red line). e,f, The top resisters (e) and sensitizers (f) selected from the miRNA mimic screen were reverse transfected into HBEC and infected with VSV-GFP at an MOI of 3 for 20 h. Cell viability was measured using Cell Titer Glo and was normalized to cells transfected with negative control miRNA mimic (Control). g,h, HBECs were transfected with inhibitors to the indicated miRNAs for 72 h. Infection and measurements of cell viability were performed as in e and normalized to cells transfected with negative control miRNA inhibitor (Control). Data are representative of at least 3 independent experiments and unpaired two tailed t-test was used. Error bars represent SD.*p<0.05, **p<0.01, ***p<0.001.
miRNAs that impact viral infection were identified by their ability to increase or decrease cell viability in the presence of VSV infection compared to non-targeting mimic control. Cell viability ratios between infected and uninfected cells expressing the same miRNA were calculated and ranked from highest to lowest (Supplementary Data 2). Those miRNAs that increased or decreased cell viability were identified as resisters and sensitizers of VSV infection, respectively, and the top hits were selected. For confirmation, these miRNA hits were again transfected into HBEC followed by infection as in the primary screen (Fig. 1e) and their basal levels were measured by microRNA array (Supplementary Data 3). Eight miRNA resisters (Fig. 1e) and 6 miRNA sensitizers (Fig.1f) were validated. miR-193b* was not confirmed as hit (Fig. 1f).
To determine if endogenous expression of the miRNAs could significantly impact viral infection, we transfected inhibitors of each of the confirmed hits from the miRNA mimic screen into HBEC and infected them with VSV. The inhibitors are single-stranded oligonucleotides that compete with a target mRNA for binding to endogenous mature miRNA. Transfection of inhibitors of miRNAs that resist VSV infection resulted in significantly decreased cell viability upon VSV infection for several hits, including miR-802, let-7e, let-7a, miR-98, and miR-125b (Fig. 1g). miR-98, let-7 miRNAs, and miR-125b have been previously shown to regulate responses to microbial infection, serving as validation to our screen17–19. Inhibition of miRNAs that sensitized HBEC to viral infection resulted in increased cell viability during VSV infection for many of the top hits. This effect was observed with five miRNAs including miR-576-3p, miR-550, miR-138, miR-888*, and miR-625 (Fig. 1h).
Since transfection of the mimic and inhibitor of miR-576-3p produced significant opposing effects on VSV infection (Fig.1 f,h) and because it more strongly promoted viral replication as compared to other novel hits, using the conditions shown in Fig. 2a, we investigated the unknown function of miR-576-3p in viral infection. Overexpression of miR-576-3p in VSV-GFP infected HBEC resulted in increased GFP production (Fig. 2a) and virus replication, as supernatants from these cells yielded an increase in viral titer compared to control transfected cells (Fig. 2b). Additional results of VSV replication in the presence or miR-576-3p mimic and inhibitor are shown in Supplementary Figure 1. Indeed, enhanced viral replication (Fig. 2b and Supplementary Fig. 1a) is corroborated by the increase in viral protein levels upon overexpression of miR-576-3p (Fig. 2c; Supplementary Fig. 6). In contrast, inhibition of endogenous miR-576-3p function dramatically decreased viral protein levels (Fig. 2c; Supplementary Fig. 6) and viral replication (Supplementary Fig. 1b). To determine if regulation of the host response to viral infection by miR-576-3p is specific to VSV, we infected cells treated with miR-576-3p with influenza virus. As shown in Figure 2d, miR-576-3p significantly sensitized HBEC to influenza virus infection and replication. Additionally, HBEC overexpressing miR-576-3p had significantly decreased cell viability and produced more viral particles upon infection with vaccinia virus and HSV-1, which are DNA viruses, compared to cells transfected with control miRNA (Fig. 2e,f). Altogether, our findings indicate that miR-576-3p sensitizes cell to viral infection and that it is a broad regulator of infections by both RNA and DNA viruses.
Figure 2. miR-576-3p is a broad regulator of viral infection.

a, HBEC were transfected with miRNA mimic control, miR-576-3p mimic (M-576-3p), and infected with VSV-GFP at an MOI of 1 for 20 h. VSV-GFP production was monitored by fluorescence microscopy. Scale bar, 100 µM. b, Samples of supernatant from infected cells in a were collected and viral titers were measured by plaque assays. c, HBEC were transfected with miRNA mimic control (Control), miR-576-3p mimic (M-576-3p) or miR-576-3p inhibitor (I-576-3p) and infected with VSV-GFP at an MOI of 1 for 20 h. Cell lysates were harvested and VSV protein levels were measured by western blot with anti-VSV antibodies. d, HBEC were transfected with control or miR-576-3p mimic (M-576-3p). After 72 h of transfection, cells were infected with the WSN strain of influenza virus at MOI of 5 for 18 h. Cell viability and viral replication were measured by Cell Titer Glo and plaque assays, respectively. e, HBEC were transfected as in d and infected with vaccinia virus at MOI of 3 for 18 h and cell viability was measured as in d. Viral titer was measured by plaque assay. f, HBEC were transfected as in d and infected with HSV-1 at MOI 0.1 for 96 h. Cell viability was measured as in d and viral titer was determined by plaque assay. Data are representative of at least 3 independent experiments and unpaired two tailed t-test was used. Error bars represent SD. *p<0.05, **p<0.01.
miR-576-3p targets constituents of innate immune signaling
In order to identify mRNA targets of miR-576-3p, we performed gene expression profiling with RNA obtained from HBEC transfected with a mimic or inhibitor of miR-576-3p, and compared individual mRNA levels to control transfected cells (Supplementary Data 4). Gene set enrichment analysis (GSEA) of these mimic and inhibitor conditions identified cellular pathways that are potentially targeted by miR-576-3p. Among the top pathways showing the best enrichment scores was cytokine signaling, which included mRNAs that encode constituents of the RIG-I signaling pathway. After leading edge analysis, mRNAs whose expression decreased upon miR-576-3p overexpression and increased upon inhibition of the endogenous miR-576-3p were selected as potential targets of miR-576-3p. A key response network regulated by miR-576-3p was then generated. Next, all mRNAs within the response network were analyzed for the presence of miR-576-3p seed regions using the TargetScan prediction program20. This analysis showed that 18 of the 94 mRNAs in the response network contained potential miR-576-3p target sites (Fig. 3a).
Figure 3. miR-576-3p targets key players of immune response pathways.

a, Gene expression profiling was performed with RNA obtained from HBEC transfected in triplicate with miRNA mimic control or miR-576-3p mimic, and miRNA inhibitor control or miR-576-3p inhibitor. GSEA was performed for both conditions. Response network illustrates the regulation of closely connected host immune signaling pathways in response to treatment of HBEC with miR-576-3p mimic or inhibitor. Nodes (proteins) in the network are connected by an edge based on physical and/or functional interactions. Red color nodes denote mRNAs containing miR-576-3p specific seed regions (p<0.0005). The parameters of network analysis are k=1 and l=5. b, Dual-luciferase assays were performed on HEK293T cells transfected with control or miR-576-3p mimic (M-576-3p) and luciferase constructs encoding wild-type 3’ UTR of genes predicted to be regulated by miR-576-3p inserted downstream of luciferase. Empty vector was transfected as a negative control. Luciferase expression was normalized to a Renilla luciferase expression and relative luciferase activity of miR-576-3p mimic (M-576-3p) transfected wells was compared to mimic control luciferase levels. Dashed red line indicates the threshold (75% of luciferase activity). c, Dual-luciferase assays of HEK293T cells transfected with control or miR-567-3p mimic (M-576-3p) as in b and luciferase constructs encoding wild-type (WT) or mutated (mut) 3’ UTR (with deletion of miR-576-3p seed sequence) of genes predicted to be targets in a. Data were normalized as in b and are representative of at least three independent experiments. ns indicates mutants that are not significantly different from wild-type 3’ UTRs. Unpaired two tailed t-test was used and error bars represent SD.
To assess whether differences in the levels of the selected mRNAs are a result of direct targeting by miR-576-3p, the 3’ UTR of each mRNA containing predicted target sites for miR-576-3p was cloned downstream of a luciferase reporter gene and co-transfected with miR-576-3p or control mimic into 293T cells. We found that miR-576-3p significantly decreased luciferase expression in 13 of the 18 UTRs identified in our GSEA (Fig. 3b). Furthermore, deletion of the region complementary to the miR-576-3p seed sequence in these UTRs significantly eliminated the inhibitory effect of miR-576-3p on luciferase expression in all but three of the mutant 3’ UTRs (Fig. 3c), indicating that these genes are direct targets of miR-576-3p. Among these targets is STING (Fig. 3b,c), which is critical for type I IFN expression and antiviral signaling12,13.
Examination of STING at the mRNA and protein levels revealed that expression of STING was reduced in mock and VSV infected cells transfected with miR-576-3p mimic, and STING protein levels increased in the presence of miRNA-576-3p inhibitor as compared to control (Fig. 4a–c; Supplementary Fig. 6). In addition, MAVS and TRAF3 mRNAs, which together with STING are constituents of the pathway that leads to IFN expression and antiviral signaling, also appear to be targets of miR-576-3p (Fig. 3b,c). In fact, MAVS and TRAF3 protein levels increased in the presence of miR-576-3p inhibitor during infection (Supplementary Fig. 2; Supplementary Fig. 6). These data thus indicate that miR-576-3p regulates antiviral signaling by targeting key factors within the pathogen recognition and host response pathway.
Figure 4. miR-576-3p regulates Type I IFN signaling.

a, Schematic showing the region of the 3’ UTR of STING that is recognized by the miR-576-3p seed sequence. b, HBEC were transfected with control or miR-576-3p (M-576-3p) mimic for 72 h. Cells were then mock infected or infected with VSV-GFP at an MOI 3 for 3 h. Total RNA was harvested from cells and STING mRNA levels were determined by qPCR and normalized to levels of β-actin. c, HBEC were transfected with miRNA mimic (M-576-3p) or inhibitor (I-576-3p) as in b and mock-infected or infected with VSV-GFP at MOI 0.1 for 18 h. Cell lysates were harvested and subjected to western blot analysis with anti-STING antibodies. β-actin serves as loading control. d,e, HBEC were transfected with 1 µg/ml of poly (I:C) for 6 h (d) or treated with 100 U/ml of IFNβ for 18 h (e) and levels of pri-mir-576 and SEC24B mRNA were analyzed by qPCR. f,g, HBEC were transfected with poly (I:C) as in d after siRNA knockdown of NFκB (P65) or IRF3. Relative pri-mir-576 (f) or SEC24B mRNA (g) levels were measured by qPCR. h, HBEC expressing control or miR-576-3p mimic (M-576-3p) or an siRNA targeting STING were transfected with poly (I:C) and levels of IFNβ mRNA were measured by qPCR. i, HBEC were transfected with control or miR-576-3p mimic (M-576-3p) and pre-treated with 100 U/ml of IFNβ prior to VSV infection. Cell viability was determined by measuring ATP levels of mock or infected cells. j, HBEC expressing control or miR-576-3p inhibitor (I-576-3p) were transfected with poly (I:C) and levels of IFNβ were measured by qPCR. Data are representative of three independent experiments. Unpaired two tailed t-test was used and error bars represent SD. *p<0.05, **p<0.01, ***p<0.001.
miR-576-3p is induced by IRF3
We then investigated whether expression of miR-576-3p was regulated upon viral genome recognition and induction of antiviral response. The primary transcript of mir-576 is encoded within an intron of the Sec24B gene. Thus, Sec24B mRNA and miR-576 primary miRNA levels were measured upon transfection of HBEC with a low molecular weight form of poly (I:C), a synthetic RNA that mimics the effect of viral infection by activating the RIG-I pathway and type I IFN expression21, or treatment with IFNβ. Both Sec24B and pri-mir-576 RNA levels were up-regulated upon transfection of poly (I:C) when compared to control transfected cells (Fig. 4d), whereas cells treated with IFNβ exhibited no increase in either Sec24B mRNA or pri-mir-576 (Fig. 4e). These findings indicate that pri-mir-576 is regulated by the RIG-I pathway but not by type I IFN. Since the RIG-I pathway induces cytokine production via IRF3 or NFκB, we tested both arms of the pathway to determine the mediator of pri-mir-576 expression. The increase in pri-mir-576 and Sec24B mRNA expression upon transfection of HBEC with poly (I:C) was abrogated upon siRNA knockdown of IRF3 but not the p65 component of the NFκB heterodimer (Fig. 4f,g; Supplementary Fig. 3; Supplementary Fig. 4; Supplementary Fig. 6), indicating that miR-576 expression was specifically up-regulated by IRF3. These results suggest that cells may up-regulate miR-576-3p in response to invading viruses as a feedback mechanism to fine-tune IFN expression and the innate immune response to avoid excessive inflammation, which could damage host tissues.
As miR-576-3p targets STING and other important antiviral signaling proteins in the RIG-I pathway, we then assessed the effect of miR-576-3p on the production of type I IFN. Upon transfection of poly (I:C), levels of IFN-β were significantly decreased in HBEC overexpressing miR-576-3p or with siRNA knockdown of STING when compared to control (Fig. 4h). Altogether, these results indicate that miR-576-3p directly regulates the production of type I IFN via STING and the RIG-I pathway. In support of this finding, pre-treatment of HBEC transfected with either miR-576-3p or mimic control with IFNβ restored the viability of cells upon infection with VSV (Fig. 4i). Furthermore, HBEC transfected with miR-576-3p inhibitor increased IFNβ production in the presence of poly (I:C) (Fig. 4j), further corroborating the role of miR-576-3p as a regulator of IFNβ expression.
Regulation of pri-mir-576 and STING proteins levels were also detected during infection with both RNA and DNA viruses. In the case of VSV infection, pri-mir-576 levels were up-regulated and then down-regulated over time (Supplementary Fig. 5a) and STING proteins levels followed the opposite pattern, as expected for a target of miR-576-3p (Supplementary Fig. 5b; Supplementary Fig. 6). Expression of miR-576-3p inhibitor then increased STING protein levels during VSV infection (Supplementary Fig. 5c; Supplementary Fig. 6), indicating a role for miR-576-3p on the regulation of STING levels during infection. HSV-1 infection also regulated pri-mir-576 and Sec24B mRNA levels (Fig. 5a) and STING protein levels (Fig. 5b; Supplementary Fig. 6). Cells transfected with miR-576-3p inhibitor and infected with HSV-1 showed increased STING protein levels, indicating again a role for miR-576-3p in regulating STING levels during HSV-1 infection as well (Fig. 5c; Supplementary Fig. 6). Like pri-mir-576, miR-576-3p levels were up-regulated upon poly (I:C) treatment or by viral infection, but not by interferon (Fig. 6). Taken together, miR-576-3p can target and down-regulate STING during infection by both RNA and DNA viruses. A model could be proposed in which up-regulation of miR-576-3p by IRF3, concomitantly with IFN, would down-regulate STING as a feedback mechanism to prevent continuous signaling and exacerbated inflammation (Fig. 7a). In fact, miR-576-3p levels are drastically down-regulated in patients with systemic lupus erythematosus (SLE) and rheumatoid arthritis (RA) (Fig. 7b)22,23, supporting the model of an anti-inflammatory function for miR-576-3p. Another study proposed a miRNA-driven feedback mechanism for miR-146, which targets TNF receptor-associated factor 6 and IL-1 receptor-associated kinase 1 genes and thereby regulates Toll-like receptor and cytokine signaling24.
Figure 5. Pri-mir-576 and STING protein levels are regulated during HSV-1 infection.
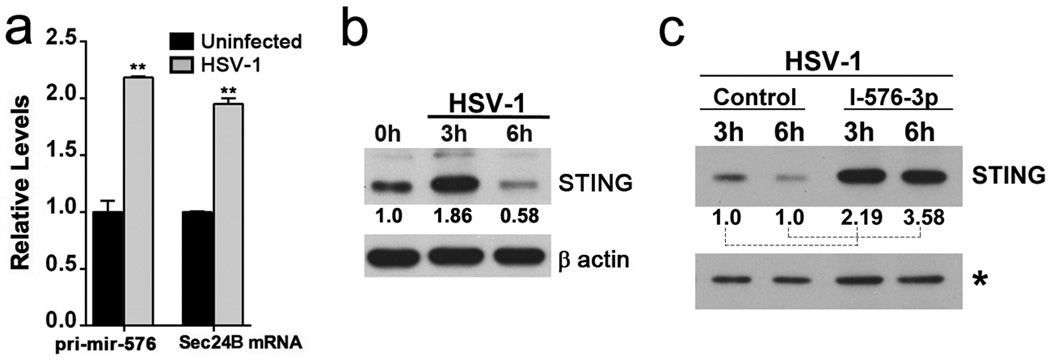
a, HBEC were mock infected or infected with HSV-1 at MOI 10 for 3 h and levels of pri-mir-576 and SEC24B were measured by qPCR. Unpaired two tailed t-test was used and error bars represent SD. **p<0.01 b, HBEC were mock infected or infected with HSV-1 at MOI 10 and STING proteins levels were measured by western blot. c, HBEC were transfected with miRNA control or miR-576-3p inhibitor (I-576-3p) and infected with HSV-1 at MOI 10. Cell lysates were harvested at the indicated time points and subjected to western blot analysis. Relative STING levels to controls were quantified using ImageJ. Control values at 3h and 6h were set to 1 for comparison with samples treated with I-576-3p. * denotes cross-reacting band that serves as loading control.
Figure 6. miR-576-3p is up-regulated by poly (I:C) and viral infection but not by interferon.

a, HBEC were transfected with 1 µg/ml of poly (I:C) for 6 h or treated with 100 U/ml of IFNβ for 18 h and levels of mature miR-576-3p were determined by qPCR. b, HBEC were mock infected or infected with HSV-1 at MOI 10 for 3 h and levels of miR-576-3p were measured by qPCR. Unpaired two tailed t-test was used and error bars represent SD. *p<0.05, **p<0.01. ns, non significant with respect to control.
Figure 7. miR-576-3p regulation in viral infection and other diseases.
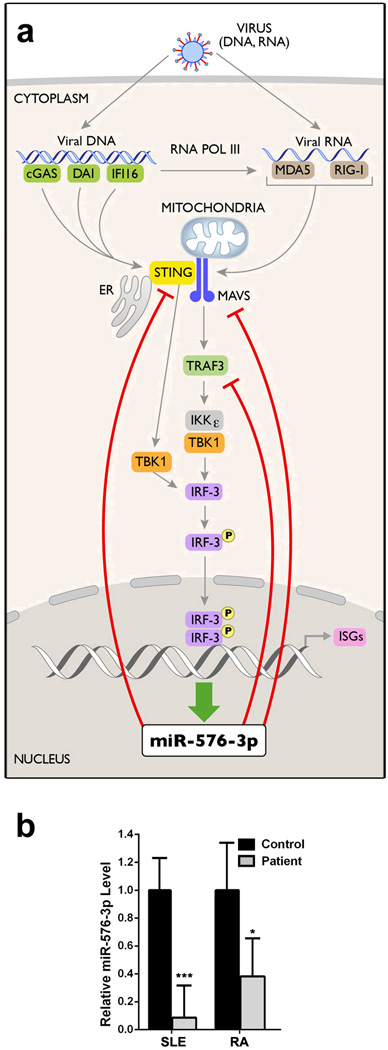
a, Model illustrates regulation of IFN expression by miR-576-3p as a feedback mechanism. Targets of miR-576-3p are indicated by inhibitory red lines. b, Public available microRNA array datasets (GSE37425 and GSE37426)23 of synovial or renal tissues from RA or SLE patients, respectively, along with controls were obtained from the GEO database22. Normalized expression values of miR-576-3p from each sample were used to calculate the relative levels and p-values of miR-576-3p for SLE or RA patients as compared to controls. Unpaired two tailed t-test was used and error bars represent SD. *p<0.05, **p<0.01, ***p<0.001.
miR-576-3p is primate-specific
Interestingly, pri-mir-576 is only present in higher primates. Furthermore, only mature miR-576-3p, but not miR-576-5p, is detected and is identical in higher primates (Fig. 8). Consequently, miR-576-3p target sites are only found at the 3’UTR of mRNAs from higher primates. STING, MAVS, and TRAF3 are present in lower organisms but their mRNAs lack miR-576-3p target sites as opposed to their mRNAs from higher primates (Fig. 8). Altogether, these findings define a new layer of complexity that appeared late in evolution that may provide higher primates with a sophisticated mechanism to fine-tune the immune response and to efficiently trigger an anti-inflammatory feedback mechanism.
Figure 8. miR-576-3p is primate-specific.
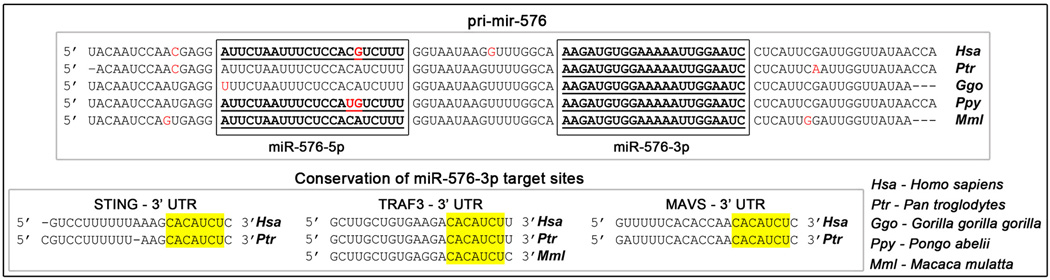
Top: Sequence alignment of pri-mir-576 from various species where it is present. miR-576-5p and miR-576-3p sequences are shown in boxes. Detected mature miR-576-5p and miR-576-3p are underlined. Red letters depict mismatched nucleotides between species. Bottom: Multiple sequence alignments of representative miR-576-3p target sites in the indicated 3’ UTR. The miRNA seed region is highlighted in yellow.
Methods
Cell culture and reagents
Immortalized human bronchial epithelial cells (HBEC) were obtained from J. Minna (UT Southwestern Medical Center) and were cultured in keratinocyte serum-free media (Invitrogen) supplemented with EGF and bovine pituitary extract. Human embryonic kidney (HEK) 293T cells were cultured in DMEM (Invitrogen) with 10% FBS (Atlas Biologicals). The following antibodies were used for immunoblot analysis according to the manufacturer’s instructions: anti-STING rabbit polyclonal (Cell Signaling), anti-MAVS rabbit polyclonal (Enzo Life Sciences), anti-TRAF3 rabbit polyclonal (Cell Signaling Technology), anti-P65 rabbit polyclonal (Santa Cruz), anti-IRF3 rabbit polyclonal (Santa Cruz), and anti-β-actin mouse monoclonal antibodies (Sigma). Antibodies against VSV proteins were used as previously reported25. The miRIDIAN human microRNA mimic library (miRBase version 10.1) was obtained from Dharmacon, Thermo. A total of 810 mimics were screened, which represented 723 unique mature miRNAs. Non-targeting control Caenorhabditis elegans miRNAs and siRNAs were purchased from Dharmacon. Recombinant human IFNβ was obtained from R&D systems.
miRNA mimic screening and transfection
The library of miRNA mimics was re-suspended and arrayed in 96-well plates. HBEC were reverse transfected in replicates of six with miRNA mimics at a concentration of 50 nM using Dharmafect 3 (Dharmacon), according to the manufacturer’s instructions. Cells were added to the transfection mix at a density of 1 × 10⁴ cells per well. Control miRNA mimics and siRNAs to Ubiquitin B (UBB) were included on each plate as negative and positive controls for cell death, respectively. After 72 h of transfection, cells were infected with VSV-GFP (Indiana strain) at a multiplicity of infection (MOI) of 3 for 20 h. Cytotoxicity was determined by measuring ATP levels using the CellTiter-Glo luminescent assay (Promega), according to manufacturer instructions. The Genedata Screener® software (version 10.1, GeneData, Inc. Basel, Switzerland) was used to process and analyze the primary screening data. Experimental results were obtained from EnVision multi-label plate reader and processed using the Assay Analyzer module of the Genedata Screener® Suite. In each 96-well assay plate, the miRIDIAN human microRNA mimic library (miRBase version 10.1) is located in columns 2 – 11, leaving columns 1 and 12 open for controls. For each plate, the raw data values for all wells were normalized using the positive and neutral controls on each plate according to the following equation:
In this equation, MC1 represents a C. elegans microRNA that does not target human mRNAs (neutral control wells B1, E1, B12, E12) and UBB served as the positive control (positive control wells D1, G1, D12, G12). Wells A1, C1, F1, H1, A12, C12, F12, and H12 were used as untreated controls. Normalized well values were then tested for positional effects using a proprietary pattern detection algorithm in the Assay Analyzer software (See GeneData user documentation and reference26). No reproducible positional effects were identified. The median of the normalized values for the 3 replicates for each miRNA was calculated for both infected and uninfected cells. Hits that sensitized cells to virus infection were selected using the following criteria: 0.8 < median uninfected cells < 1.2 and median infected cells < 0.4. miRNAs that protected cells from viral infection met the following criteria: 0.8 < median uninfected cells < 1.2 and median infected cells > 1.6.
Cell viability ratios between virus-infected and uninfected wells were calculated and miRNAs were ranked by their ability to increase cell viability upon infection. The top 8 miRNAs with the highest increases in cell viability were selected as resisters of viral infection. Six miRNAs with the highest decreases in cell viability were selected as sensitizers to viral infection. These miRNAs were selected and retested in the assay using the conditions of the screen. Relative cell viabilities were normalized to miRNA mimic control transfected wells and cell viability ratios were calculated between infected and uninfected wells. Basal levels of these miRNAs were determined by microRNA array analysis and showed significant levels.
microRNA array analysis
Total RNA was harvested in TRIzol, according to the manufacturer’s protocol. Two hundred nanograms of total RNA from 3 different HBEC samples were subjected to microRNA array analysis using the Human Illumina’s MicroRNA Expression Profiling platform (humanMI_V2). miRNA levels were detected and normalized to negative controls which are constituted of oligos targeting random sequences that are not present in the human genome. p-values were calculated using unpaired two tailed t-test.
miRNA inhibitor transfection
The endogenous activity of miRNAs that were selected as resisters and sensitizers to VSV infection was blocked by the transfection of miRNA inhibitors (Dharmacon) for the indicated miRNA. Inhibitors were reverse transfected in HBEC at a concentration of 75 nM using Dharmafect 3. After 72 h, cells were processed as indicated in the figure legends.
miR-576-3p target identification by microarray
For identification of genes regulated by miR-576-3p, HBEC were reverse transfected in triplicate with miR-576-3p mimic (50nM) or inhibitor (75 nM) and compared to cells transfected with miRNA mimic or inhibitor negative controls. After 72 h of transfection, total RNA was harvested in TRIzol, according to the manufacturer’s protocol. Five hundred nanograms of total RNA was labeled using the Illumina TotalPrep kit (Ambion) and the biotin-labeled cRNA was hybridized to an Illumina HumanHT-12 v4 Expression BeadChip array according to the manufacturer’s protocol.
Gene Set Enrichment Analysis of microarray data
Using raw data from the Illumina microarray, the expression values of genes from multiple oligonucleotide probes were averaged and the data file was formatted as required by the Gene Set Enrichment Analysis (GSEA) software27. GSEA was performed on microarray profile of mimic control against miR-576-3p mimic using standard mode with gene set permutations. Curated C2/CP canonical pathways Molecular Signatures Database (MSigDB, Broad Institute) v3.0 with 880 gene sets (pathways) has been used as reference in GSEA. GSEA was then repeated for inhibitor control against miR-576-3p inhibitor microarray data. Common gene sets between those genes down regulated by miR-576-3p mimic and up regulated by miR-576-3p inhibitor were selected and subjected to leading edge GSEA. The responding genes from leading edge analysis were further filtered for genes that were both down-regulated by miR-576-3p mimic and up-regulated by miR-576-3p inhibitor, resulting in 24 responding genes. These 24 responding genes, which were potential targets of miR-576-3p, were selected as seed nodes for protein network analysis, as previously reported28, using signal-to-noise ratios ranked based on GSEA. The response network contained 94 proteins and 164 interactions regulated by miR-576-3p. mRNAs encoding the 94 proteins were checked for miR-576-3p seed region using TargetScanHuman version 6.2 and 18 mRNAs were found to have seed regions for miR-576-3p. To identify the biological theme of the response network targeted by miR-576-3p, the 94 genes were subjected to overlap analysis using MSigDB gene sets (http://www.broadinstitute.org/gsea/msigdb/annotate.jsp) and showed enrichment for immune response pathways.
RNA isolation and qPCR
Total RNA was isolated using TRIzol reagent (Invitrogen) as recommended by the manufacturer. Reverse transcription of 1 µg of total RNA was performed using Superscript II reverse transcriptase (Invitrogen) and 250 ng of random hexamer primer, according to the manufacturer’s instructions. Real-time PCR was performed using TaqMan Universal PCR master mix (Applied Biosystems) and the TaqMan Pri-miRNA Assay (hsa-mir-576) for quantification of the primary transcript or TaqMan MicroRNA Assay (hsa-miR-576-3p) for quantification of miR-576-3p. Gene-specific primers were used to quantify SEC24B and GAPDH using the TaqMan system. For quantification of STING and IFNβ, real-time qPCR was performed using gene-specific primers, iQ SYBR green supermix (Bio-Rad) according to the manufacturer’s instructions, and the Bio-Rad CFX96 real-time PCR machine. The results were normalized to β-actin and GAPDH. Each PCR was performed in triplicate, and standard deviations were calculated. The amount of RNA is expressed in relative units with respect to mock treated samples.
Dual-luciferase assays
Targets of miR-576-3p were assessed by transfecting 293T cells with miR-576-3p mimic at a final concentration of 100 nM and a 10:1 ratio of the pMIR-REPORT plasmid (gift of Eric Olson; UT Southwestern Medical Center) containing the 3’ UTR of the indicated gene and a Renilla reporter plasmid for normalization of transfection efficiency using Lipofectamine 2000 (Invitrogen). Cells were transfected with 50 ng of pMIR-REPORT luciferase plasmid or plasmid containing a mutant 3’ UTR as a negative control. Mutated 3′ UTRs were obtained by deletion of the miR-576-3p microRNA-responsive element in the 3′ UTR by PCR mutagenesis. Firefly and renilla luciferase activity was measured using the Dual Luciferase Reporter assay system (Promega) in a luminometer (Fluoroskan Ascent; Thermo Fisher Scientific).
Poly (I:C) transfection
HBEC were reverse transfected for 72 h with miRNA control, or miR-576-3p mimic, or miR-576-3p inhibitor, or siRNAs to STING, P65, or IRF3 (Dharmacon), as indicated in the figure legends, at a concentration of 50 nM. Four to six hours before harvest, cells were transfected with Poly (I:C) (InvivoGen) at a final concentration of 1 µg/ml using Lipofectamine 2000 (Invitrogen), according to the manufacturer’s instructions. As additional control, cells were transfected with Lipofectamine 2000 alone.
VSV infection and plaque assay
HBEC were transfected with control miRNA or with miR-576-3p mimic or inhibitor, or with siRNAs to STING, MAVS, or TRAF3 (Dharmacon), as described above, and infected with VSV-GFP (Indiana strain) at MOI 0.1, 1, or 3, as indicated in the figure legends. Infection time is described in the figure legends for each condition. Supernatants were collected and used for titration on BHK cells. Supernatants containing virus were serially diluted in serum-free DMEM and added to BHK cells. One hour after infection, complete DMEM containing 1% agarose was added to each well. GFP-positive plaques were counted 18–24 h after infection and used to calculate relative viral titers.
Infections with WSN, VV, and HSV-1, cell viability, and plaque assays
HBEC were transfected in triplicate with miRNA mimics as described above. After 72 h of transfection, cells were infected with influenza virus (WSN strain), or vaccinia virus, or Herpes simplex virus (HSV-1) at MOI of 5, 3 and 0.1, respectively. Cell viabilities were measured after 18 h of infection with WSN and vaccinia virus and 96 h after HSV-1 infection using the CellTiter-Glo kit (Promega). Relative cell viabilities of miR-576-3p transfected cells were calculated relative to miRNA mimic control. Since HBEC are resistant to infection, the same infection conditions were used for viral replication assays except that TPCK (0.5 µg/ml) was added in the media during influenza virus and vaccinia virus infections. Supernatants were collected and plaque assays were performed in MDCK cells for influenza virus, in BHK cells for vaccinia virus, and in Vero cells for HSV-1.
Conservation analysis of miR-576-3p and its targets
Multiple sequence alignment of pri-mir-576 among different species was performed using microRNAviewer (http://people.csail.mit.edu/akiezun/microRNAviewer/index.html)29. The conservation of miR-576-3p target sites in 3’UTR of STING, MAVS and TRAF3 were tested using TargetScan Release 6.2 (http://www.targetscan.org/).
Supplementary Material
Acknowledgements
We thank J. Yang for technical assistance; S. Wei, G. Henry, and M. Vishwanath for assistance in the high-throughput screening facility; C. Bu for assistance with statistical analysis; E. Olson and A. Garcia-Sastre for reagents; D. Levy for helpful suggestions and critical reading of the manuscript; and M. Potts for help with the miRNA mimic library. We thank Angela Diehl for outstanding illustration. Funding was provided by NIH R01 GM067159, R01 AI079110, R01 AI089539, CPRIT RP121003-RP120718-P2, T32-CA124334, and F32-AI091409.
Footnotes
Author contributions
Conceived and designed the experiments: M.L.Y., K.Z., G.N.B., B.A.P., M.A.W, and B.M.A.F.. Performed the experiments: M.L.Y. and K.Z.. Analyzed the data: M.L.Y., K.Z., R.S., C.V.F., G.N.B., B.A.P., M.A.W, and B.M.A.F.. Contributed reagents/materials/analysis tools: R.S., C.V.F., G.N.B., B.A.P., M.A.W, and B.M.A.F. Wrote the paper: M.L.Y. and B.M.A.F.
Conflict of interest statement
The authors declare no conflict of interest.
References
- 1.Gottwein E, Cullen BR. Viral and cellular microRNAs as determinants of viral pathogenesis and immunity. Cell Host Microbe. 2008;3:375–387. doi: 10.1016/j.chom.2008.05.002. doi:S1931-3128(08)00150-9 [pii] 10.1016/j.chom.2008.05.002. [DOI] [PMC free article] [PubMed] [Google Scholar]
- 2.Santhakumar D, et al. Combined agonist-antagonist genome-wide functional screening identifies broadly active antiviral microRNAs. Proceedings of the National Academy of Sciences of the United States of America. 2010;107:13830–13835. doi: 10.1073/pnas.1008861107. [DOI] [PMC free article] [PubMed] [Google Scholar]
- 3.Otsuka M, et al. Hypersusceptibility to vesicular stomatitis virus infection in Dicer1-deficient mice is due to impaired miR24 and miR93 expression. Immunity. 2007;27:123–134. doi: 10.1016/j.immuni.2007.05.014. [DOI] [PubMed] [Google Scholar]
- 4.Lichty BD, Power AT, Stojdl DF, Bell JC. Vesicular stomatitis virus: re-inventing the bullet. Trends Mol Med. 2004;10:210–216. doi: 10.1016/j.molmed.2004.03.003. doi:10.1016/j.molmed.2004.03.003 S1471491404000760 [pii] [DOI] [PubMed] [Google Scholar]
- 5.Barber GN. VSV-tumor selective replication and protein translation. Oncogene. 2005;24:7710–7719. doi: 10.1038/sj.onc.1209042. doi:1209042 [pii] 10.1038/sj.onc.1209042. [DOI] [PubMed] [Google Scholar]
- 6.Yoneyama M, et al. The RNA helicase RIG-I has an essential function in double-stranded RNA-induced innate antiviral responses. Nat Immunol. 2004;5:730–737. doi: 10.1038/ni1087. doi:10.1038/ni1087 ni1087 [pii] [DOI] [PubMed] [Google Scholar]
- 7.Takeuchi O, Akira S. Recognition of viruses by innate immunity. Immunological reviews. 2007;220:214–224. doi: 10.1111/j.1600-065X.2007.00562.x. [DOI] [PubMed] [Google Scholar]
- 8.Kawai T, et al. IPS-1, an adaptor triggering RIG-I- and Mda5-mediated type I interferon induction. Nat Immunol. 2005;6:981–988. doi: 10.1038/ni1243. [DOI] [PubMed] [Google Scholar]
- 9.Meylan E, et al. Cardif is an adaptor protein in the RIG-I antiviral pathway and is targeted by hepatitis C virus. Nature. 2005;437:1167–1172. doi: 10.1038/nature04193. [DOI] [PubMed] [Google Scholar]
- 10.Seth RB, Sun L, Ea CK, Chen ZJ. Identification and characterization of MAVS, a mitochondrial antiviral signaling protein that activates NF-kappaB and IRF 3. Cell. 2005;122:669–682. doi: 10.1016/j.cell.2005.08.012. [DOI] [PubMed] [Google Scholar]
- 11.Xu LG, et al. VISA is an adapter protein required for virus-triggered IFN-beta signaling. Molecular cell. 2005;19:727–740. doi: 10.1016/j.molcel.2005.08.014. [DOI] [PubMed] [Google Scholar]
- 12.Ishikawa H, Barber GN. STING is an endoplasmic reticulum adaptor that facilitates innate immune signalling. Nature. 2008;455:674–678. doi: 10.1038/nature07317. [DOI] [PMC free article] [PubMed] [Google Scholar]
- 13.Ishikawa H, Ma Z, Barber GN. STING regulates intracellular DNA-mediated, type I interferon-dependent innate immunity. Nature. 2009;461:788–792. doi: 10.1038/nature08476. [DOI] [PMC free article] [PubMed] [Google Scholar]
- 14.Sun L, Wu J, Du F, Chen X, Chen ZJ. Cyclic GMP-AMP synthase is a cytosolic DNA sensor that activates the type I interferon pathway. Science. 2013;339:786–791. doi: 10.1126/science.1232458. [DOI] [PMC free article] [PubMed] [Google Scholar]
- 15.Wu J, et al. Cyclic GMP-AMP is an endogenous second messenger in innate immune signaling by cytosolic DNA. Science. 2013;339:826–830. doi: 10.1126/science.1229963. [DOI] [PMC free article] [PubMed] [Google Scholar]
- 16.Ramirez RD, et al. Immortalization of human bronchial epithelial cells in the absence of viral oncoproteins. Cancer Res. 2004;64:9027–9034. doi: 10.1158/0008-5472.CAN-04-3703. doi:64/24/9027 [pii] 10.1158/0008-5472.CAN-04-3703. [DOI] [PubMed] [Google Scholar]
- 17.Hu G, et al. MicroRNA-98 and let-7 confer cholangiocyte expression of cytokine-inducible Src homology 2-containing protein in response to microbial challenge. J Immunol. 2009;183:1617–1624. doi: 10.4049/jimmunol.0804362. [DOI] [PMC free article] [PubMed] [Google Scholar]
- 18.Tili E, et al. Modulation of miR-155 and miR-125b levels following lipopolysaccharide/TNF-alpha stimulation and their possible roles in regulating the response to endotoxin shock. J Immunol. 2007;179:5082–5089. doi: 10.4049/jimmunol.179.8.5082. [DOI] [PubMed] [Google Scholar]
- 19.Wang D, et al. MiR-125b reduces porcine reproductive and respiratory syndrome virus replication by negatively regulating the NF-kappaB pathway. PLoS ONE. 2013;8:e55838. doi: 10.1371/journal.pone.0055838. [DOI] [PMC free article] [PubMed] [Google Scholar]
- 20.Lewis BP, Burge CB, Bartel DP. Conserved seed pairing, often flanked by adenosines, indicates that thousands of human genes are microRNA targets. Cell. 2005;120:15–20. doi: 10.1016/j.cell.2004.12.035. [DOI] [PubMed] [Google Scholar]
- 21.Kato H, et al. Length-dependent recognition of double-stranded ribonucleic acids by retinoic acid-inducible gene-I and melanoma differentiation-associated gene 5. J Exp Med. 2008;205:1601–1610. doi: 10.1084/jem.20080091. [DOI] [PMC free article] [PubMed] [Google Scholar]
- 22.Barrett T, et al. NCBI GEO: archive for functional genomics data sets--update. Nucleic acids research. 2013;41:D991–D995. doi: 10.1093/nar/gks1193. [DOI] [PMC free article] [PubMed] [Google Scholar]
- 23.Zhu S, et al. The microRNA miR-23b suppresses IL-17-associated autoimmune inflammation by targeting TAB2, TAB3 and IKK-alpha. Nature medicine. 2012;18:1077–1086. doi: 10.1038/nm.2815. [DOI] [PubMed] [Google Scholar]
- 24.Taganov KD, Boldin MP, Chang KJ, Baltimore D. NF-kappaB-dependent induction of microRNA miR-146, an inhibitor targeted to signaling proteins of innate immune responses. Proceedings of the National Academy of Sciences of the United States of America. 2006;103:12481–12486. doi: 10.1073/pnas.0605298103. [DOI] [PMC free article] [PubMed] [Google Scholar]
- 25.Balachandran S, Barber GN. Defective translational control facilitates vesicular stomatitis virus oncolysis. Cancer cell. 2004;5:51–65. doi: 10.1016/s1535-6108(03)00330-1. [DOI] [PubMed] [Google Scholar]
- 26.Wu Z, Liu D, Sui Y. Quantitative assessment of hit detection and confirmation in single and duplicate high-throughput screenings. J Biomol Screen. 2008;13:159–167. doi: 10.1177/1087057107312628. [DOI] [PubMed] [Google Scholar]
- 27.Subramanian A, et al. Gene set enrichment analysis: a knowledge-based approach for interpreting genome-wide expression profiles. Proceedings of the National Academy of Sciences of the United States of America. 2005;102:15545–15550. doi: 10.1073/pnas.0506580102. [DOI] [PMC free article] [PubMed] [Google Scholar]
- 28.Mata MA, et al. Chemical Inhibition of RNA Viruses Reveals REDD1 as Host Defense Factor. Nat Chem Biol. 2011;7:712–719. doi: 10.1038/nchembio.645. [DOI] [PMC free article] [PubMed] [Google Scholar]
- 29.Kiezun A, et al. miRviewer: a multispecies microRNA homologous viewer. BMC research notes. 2012;5:92. doi: 10.1186/1756-0500-5-92. [DOI] [PMC free article] [PubMed] [Google Scholar]
Associated Data
This section collects any data citations, data availability statements, or supplementary materials included in this article.