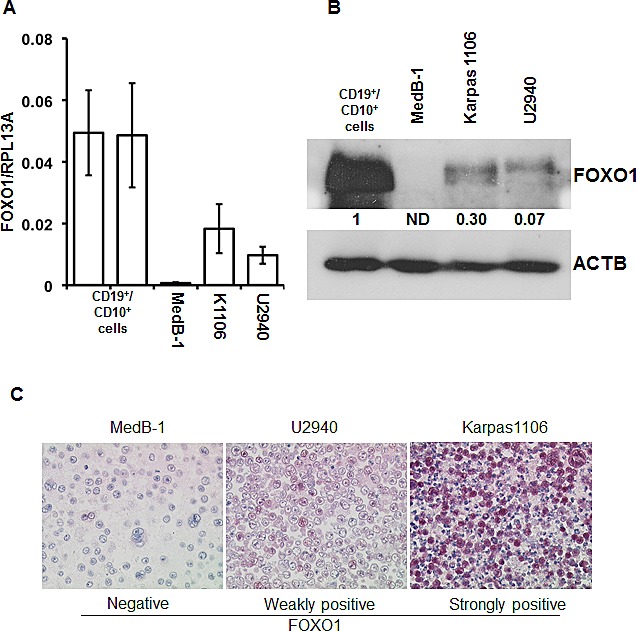
Figure 2. FOXO1 expression differs in PMBL cell lines.

(A) FOXO1 mRNA expression in PMBL cell lines and in CD19+/CD10+ tonsillar cells was measured by Q-RT-PCR. The data are shown as mean±SD FOXO1/PRL13A ratio calculated by delta Ct method. The total RNA was isolated from at least three samples of each cell line. (B) Expression of FOXO1 protein in PMBL cell lines and in CD19+/CD10+ tonsillar cells was analyzed by immunoblot. ACTB was used as loading control. Here and in the following immunoblot images the representative of at least three analyses of protein lysates of cells harvested at different time points of culturing are shown. All immonoblot analyses yielded similar results. (C) FOXO1 expression in paraffin embedded PMBL cell lines. The cells were stained with anti-FOXO1 antibody and microscopy was done as described in legend to Figure 1A. The experiment was repeated two times and yielded identical results.
