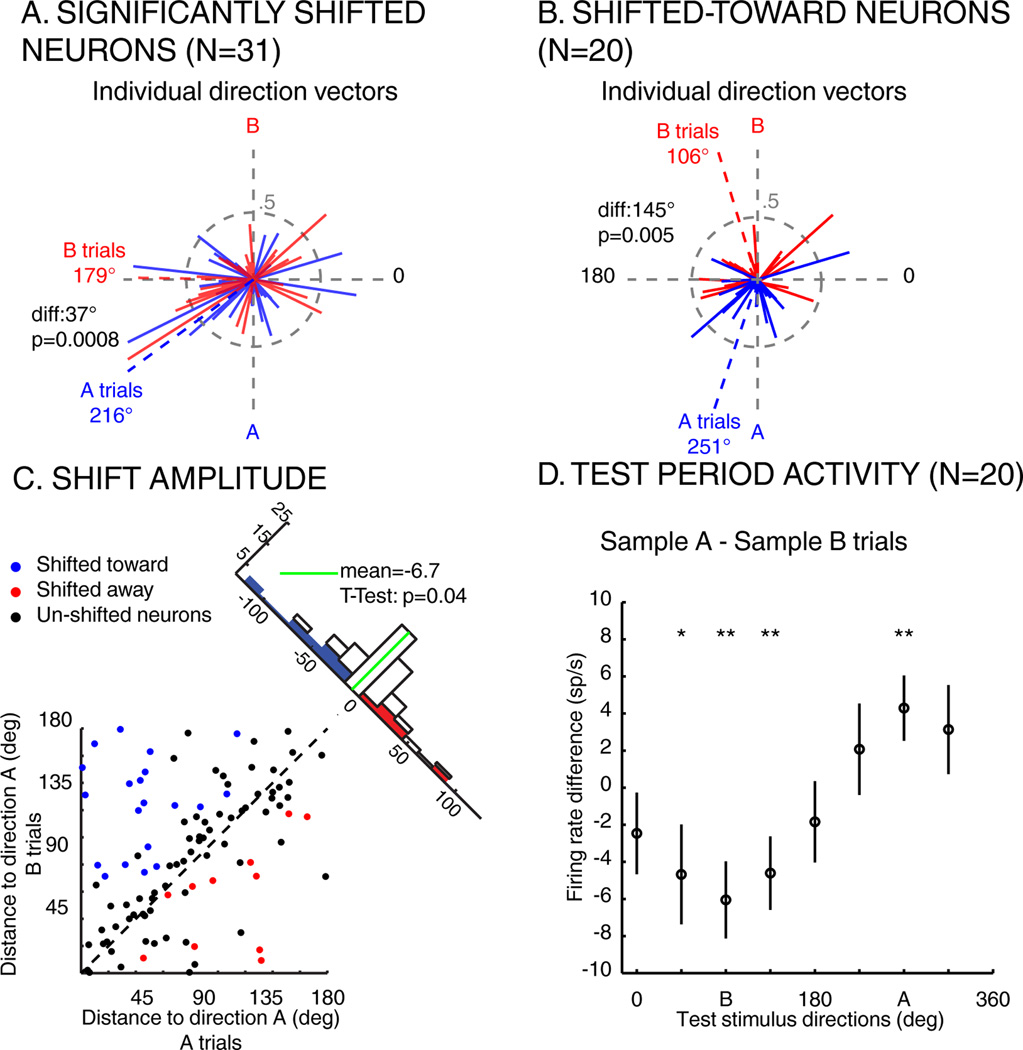
Figure 3.
Impact of task demands on LIP direction tuning. A) Individual direction vectors and normalized activity of shifted neurons (N=31) during sample A (blue) and B (red) trials. Solid lines represent the direction vector of each neuron during sample A (blue) or B (red) trials. Blue and red dashed lines represent the sum of the blue and red (respectively) direction vectors. diff: angular distance between sample A and sample B vectors. B) Individual direction vectors and normalized population activity of shifted-toward neurons, same conventions as in A. C) Angular distance between the preferred direction of each direction selective neuron (N=99) and the direction of sample A (270 degrees), when monkeys are looking for sample A (x-axis) or for sample B (y-axis). Blue points: neurons whose preferred direction is significantly shifted toward the relevant direction. Red points: neurons whose preferred direction is significantly shifted away from the relevant direction. Black points: neurons whose preferred direction is not significantly shifted. Histogram along diagonal: projection of each point of the scatter plot on the diagonal. D) Average difference of response to each direction (+/− SEM) between sample A and B trials (N=20, shifted toward neurons; *P<0.05, **P<0.01, paired T-Test).

