

Abstract
Ultrasound contrast agents (UCAs) have the potential to nucleate cavitation and promote both beneficial and deleterious bioeffects in vivo. Previous studies have elucidated the pulse-duration dependent pressure amplitude threshold for rapid loss of echogenicity due to UCA fragmentation. Previous studies have demonstrated that UCA fragmentation was concomitant with inertial cavitation. The purpose of this study was to evaluate the relationship between stable and inertial cavitation thresholds and loss of echogenicity of UCAs as a function of pulse duration. Determining the relationship between cavitation thresholds and loss of echogenicity of UCAs would enable monitoring of cavitation based upon the on-screen echogenicity in clinical applications. Two lipid-shelled UCAs, echogenic liposomes (ELIP) and Definity®, were insonified by a clinical ultrasound scanner in duplex spectral Doppler mode at four pulse durations (“sample volumes”) in both a static system and a flow system. Cavitation emissions from the UCAs insonified by Doppler pulses were recorded using a passive cavitation detection system and stable and inertial cavitation thresholds ascertained. Loss of echogenicity from ELIP and Definity® was assessed within regions of interest on B-mode images. A numerical model based on UCA rupture predicted the functional form of the loss of echogenicity from ELIP and Definity®. Stable and inertial cavitation thresholds were found to have a weak dependence on pulse duration. Stable cavitation thresholds were lower than inertial cavitation thresholds. The power of cavitation emissions was an exponential function of the loss of echogenicity over the investigated range of acoustic pressures. Both ELIP and Definity® lost more than 80% echogenicity before the onset of stable or inertial cavitation. Once this level of echogenicity loss occurred, both stable and inertial cavitation were detected in the physiologic flow phantom. These results imply that stable and inertial cavitation are necessary in order to trigger complete loss of echogenicity acoustically from UCAs and this finding can be used when planning diagnostic and therapeutic applications.
Keywords: cavitation thresholds, echogenic liposomes, echogenicity, passive cavitation detection, physiologic flow
1. Introduction
Ultrasound contrast agents (UCAs) have been investigated for novel imaging (Qin et al 2009) and therapeutic applications (Stride and Coussios 2010, Bekeredjian et al 2005). Definity®, a commercially available UCA, has been approved by the United States Food and Drug Administration for left ventricular opacification (FDA 2011). However, the agent has also been used off label in other imaging applications, such as contrast enhanced blood flow imaging (Kalantarinia et al 2009), subharmonic imaging (SHI) (Eisenbrey et al 2011), and flash echocardiography (Pelberg et al 1999). Definity® consists of octafluoropropane gas microbubbles encapsulated in lipid monolayers. Definity® can also be used as a cavitation nucleation agent to enhance sonothrombolysis (Datta et al 2008, Hitchcock et al 2011) and to promote ultrasound-triggered gene transfection (Song et al 2011). Therapeutic applications of UCAs have fuelled the development of theragnostic agents, such as echogenic liposomes (ELIP), for detecting and treating cardiovascular disease (Britton et al 2010, Huang 2008, Sutton et al 2013). ELIP are lipid bilayer vesicles, ranging from 40 nm to 6 μm in diameter (Kopechek et al 2011), each encapsulating an aqueous core and gas pocket (Huang 2008, Kopechek et al 2011). ELIP can be loaded with several cardiovascular therapeutic agents (Britton et al 2010, Buchanan et al 2010, Herbst et al 2010, Tiukinhoy-Laing et al 2007, Huang et al 2007, Huang et al 2009) and targeted to specific molecular receptors in diseased vasculature (Hamilton et al 2004, Laing et al 2011). In addition, ultrasound exposure has been shown to mediate delivery of therapeutic-loaded ELIP into vascular tissue (Herbst et al 2010, Hitchcock et al 2010).
UCAs are effective nuclei for stable and inertial cavitation and can cause both beneficial and deleterious bioeffects when driven into volumetric oscillation upon exposure to ultrasound (Coussios and Roy 2008, Miller et al 2008, Skyba et al 1998). Sustained stable cavitation, which is characterized by subharmonic and ultraharmonic acoustic emissions from microbubbles, has been shown to facilitate penetration of thrombolytics into clots (Datta et al 2008, Hitchcock et al 2011) and delivery of therapeutic-loaded ELIP into tissue (Hitchcock et al 2010). The subharmonic response of UCAs has also been employed in subharmonic imaging to enhance the contrast to tissue ratio (Sridharan et al 2013) and to estimate blood pressure non-invasively (Dave et al 2013). Inertial cavitation, which is characterized by broadband acoustic emissions from inertially collapsing microbubbles, has been shown to facilitate ablation of cancerous tissue (Coussios et al 2007) and delivery of genes into tissue through extravasation (Bazan-Peregrino et al 2012). Acoustically-induced rapid destruction of UCA contrast and the resultant acoustic emissions of inertially collapsing microbubbles have been exploited in imaging techniques such as the stimulated acoustic emissions imaging technique (SAE) (Tiemann et al 2000), flash echo imaging (Kamiyama et al 1999), and destruction-reperfusion imaging (Wei et al 1998) to improve delineation of regions with poor contrast. Ultrasound-induced UCA destruction at high mechanical indices (MI > 0.4) can also trigger inertial cavitation near cellular membranes resulting in microvascular damage, cellular apoptosis and petechial hemorrhage (Miller et al 2008, Skyba et al 1998, Miller and Dou 2004, Chen et al 2003a, Samuel et al 2009).
Such bioeffects indicate that there is a need to monitor the onset and type of cavitation in order to optimize the nonlinear response of UCAs for improved imaging contrast and therapeutic effects whilst ensuring bio-safety in the presence of ultrasound-induced UCA destruction. Based on high-speed optical images of UCAs (Chomas et al 2001) and the rate of change of echogenicity of UCAs (Smith et al 2007, Porter et al 2006), ultrasound-induced UCA destruction has been classified into three regimes: passive diffusion, acoustically driven diffusion, and rapid fragmentation. Chen et al (2003b) and Chomas et al (2001), have described rapid fragmentation as the acoustically-induced inertial collapse of microbubbles resulting in microbubble fragments. These studies have suggested that rapid changes in echogenicity due to UCA fragmentation are concomitant with inertial cavitation and could be used to monitor the likelihood of inertial cavitation nucleated by UCAs. The hypothesis of the present study is that the onset of rapid loss of UCA echogenicity is concomitant with the threshold of inertial cavitation. Two different lipid-shelled UCAs, ELIP and Definity®, were insonified by 6-MHz duplex spectral Doppler ultrasound from a clinical ultrasound imaging system (HDI 5000, Philips, Bothell, WA, USA). Acoustic cavitation emissions and B-mode ultrasound images of ELIP and Definity® were acquired. Stable and inertial cavitation thresholds and loss of echogenicity (LOE) from UCAs were quantified. Cavitation thresholds and LOE thresholds in a static fluid system were compared to the rapid fragmentation thresholds as defined by Smith et al (2007). Because these UCAs are being investigated for use in small and medium arteries (Lindner 2004, Laing and McPherson 2009) the cavitation emissions and LOE were also measured in a physiologic flow phantom (Radhakrishnan et al 2012). Numerical calculations of UCA LOE were used to predict the mechanism of LOE in the flow system.
2. Materials and Methods
Ultrasound contrast agents
The UCAs used in this study, ELIP and Definity®, were diluted in porcine plasma (Lampire Biologicals, Pipersville, PA, USA) at 37 °C and at 93 ± 2 % dissolved oxygen (DO). ELIP were prepared at the University of Texas Health Science Center, Houston as described by Buchanan et al (2008) and were shipped on dry ice to the University of Cincinnati. This particular lipid formulation has been found to be stable under physiologic temperature (Buchanan et al 2008) and hydrodynamic pressure (Radhakrishnan et al 2012). Each vial containing 6 mg of lyophilized lipids were reconstituted with 0.6 ml of 0.2 μm filtered deionized water (NANOPure, Barnstead International, Dubuque, IA, USA) and diluted in porcine plasma to yield a final lipid concentration of 0.05 mg/ml (6.4 × 10⁸ liposomes/ml) (Kopechek et al 2011, Hamilton et al 2004, Smith et al 2007). Definity® (Lantheus Medical Imaging, North Billerica, MA, USA) was activated at room temperature by agitating the vials for 45 s using a VialMix® (Lantheus Medical Imaging) according to the manufacturer's instructions. Based on the manufacturer's recommended maximum bolus dose of 20 μl/kg and assuming a blood volume of 65 ml/kg (Geigy et al 1975), Definity® was diluted in porcine plasma to a final concentration of 0.31 μl/ml (3.7 × 10⁶ microbubbles/ml). Degassed water (DO=25 ± 2%) was used as a control to assess acoustic emissions and background echogenicity from the tubing alone. All UCAs were used in flow experiments within 10 minutes after reconstitution or withdrawal from an activated vial.
Experimental setup
Cavitation thresholds and loss of echogenicity from ELIP and Definity® were measured in the absence of flow in a static fluid shown in Figure 1. UCAs diluted in porcine plasma were pumped by a peristaltic pump (Mettler Toledo, Columbus, OH, USA) into a compliant flow system consisting of latex tubing with dimensions based on physiologically relevant values for small and medium arteries (Holubkov et al 2002, Korosoglou et al 2008, Masuo et al 2002, Weidinger et al 2002). An after-load with an adjustable height was used to maintain a hydrostatic pressure corresponding to a mean arterial pressure of 93 ± 4 mmHg. ELIP or Definity® were infused into the sample chamber and flow was turned off prior to insonation. The temperature and pressure in the flow system were monitored throughout the experiments using inline pressure and temperature sensors (PendoTECH, Princeton, NJ, USA).
Figure 1.

Schematic of the experimental setup. Measurements of cavitation and echogenicity were carried out in a static fluid by infusing UCAs or degassed water into the sample chamber using a peristaltic pump and turning the flow off prior to insonation. For measurements in physiologic flow, the peristaltic pump was replaced with a pulsatile pump to infused fluid (UCAs or degassed water) continuously into the sample chamber. The linear array transducer (L12-5) was driven by the Philips HDI 5000 scanner operated in the duplex spectral Doppler mode and insonified the fluid in the sample chamber. The 10-MHz passive cavitation detector was confocally aligned with the Doppler beam and acquired cavitation emissions.
The stable and inertial cavitation thresholds and loss of echogenicity from ELIP and Definity® were also measured in the physiological flow system previously described by Radhakrishnan et al (2012) (Figure 1). ELIP or Definity® were diluted in porcine plasma and added to a temperature-controlled reservoir (Radnoti, Monrovia, CA, USA) and pumped (Model 1407, Harvard Apparatus, Holliston, MA, USA) through temperature-controlled tubing (Radnoti) at 37 °C. The stroke rate of the pulsatile pump was maintained at 60 strokes per minute and the stroke volume was adjusted in conjunction with the height of the after-load to maintain a hydrodynamic pressure of 120/80 mmHg in the flow system.
Ultrasound parameters
A linear array transducer (L12-5) driven by a clinical diagnostic ultrasound scanner (HDI 5000, Philips, Bothell, WA, USA) (Figure 1) in duplex spectral Doppler mode (6-MHz center-frequency) insonified ELIP or Definity® or degassed water in a tubing placed 1 cm from the transducer face. Measurements in degassed water determined the baseline noise level of the cavitation detection system. The Doppler pulse duration and peak rarefactional pressures were varied as shown in Table 1 and cavitation emissions and images were acquired. The range and step size of insonation pressures was limited by the Philips HDI 5000 scanner output. The acoustic peak rarefactional pressure of the Doppler pulse was measured inside the tubing at each transducer output setting. Calibration of the L12-5 transducer output were performed in a tank of degassed water by placing a section of the thin-walled latex tubing (Piercan, San Marcos, CA, USA) at the Doppler focus 1 cm from the transducer face. A 0.2 mm needle hydrophone (Precision Acoustics, Dorchester, UK) was aligned to the focus of the Doppler sample volume inside the latex tubing through a slit cut into the tubing. A three-dimensional positioning system (Velmex NF90 Series, Velmex Inc., 291 Bloomfield, NY) was used to translate the hydrophone within the latex tubing. The -3dB focal beam of the Doppler pulse was 0.8 mm × 1.8 mm × 13.2 mm (azimuth × elevation × range) at a focal distance of 1 cm from the transducer face. The acoustic pressure waveforms of the Doppler pulse and the B-mode pulse were also recorded at their respective focii for each transducer output setting and pulse duration.
Table 1.
Duplex spectral Doppler pulse parameters. Pulse repetition frequency (PRF) was maintained at 1250 Hz.
| Pulse duration (μs) | # Cycles | Range of mechanical indices (MI) | Range of peak rarefactional pressures (MPa) |
|---|---|---|---|
| 1.67 | 10 | 0.04-0.9 | 0.06-1.84 |
| 3.33 | 20 | 0.04-0.7 | 0.06-1.48 |
| 5.83 | 35 | 0.04-0.56 | 0.06-1.17 |
| 8.33 | 50 | 0.02-0.34 | 0.03-0.7 |
Cavitation thresholds
Previous studies have established spectral methods to identify different types of bubble activity as stable cavitation (Datta et al 2008, Eller and Flynn 1969, Flynn 1964, Hitchcock et al 2010, Neppiras 1980) and inertial cavitation (Chen et al 2003, Coussios et al 2007, TG Leighton 1997, Cramer and Lauterborn 1982). In the present study, a focused single element 10-MHz transducer (Valpey Fisher, Hopkinton, MA, USA) was used as a passive cavitation detector (PCD) (Roy et al 1990). The PCD was aligned confocally and orthogonally to the L12-5 pulsed Doppler focus (Figure 1). A custom trigger from the clinical scanner was used to synchronize data acquisition and to range gate the acoustic emissions received by the PCD. The acoustic emissions were filtered through a 35-MHz low pass filter (TTE, Los Angeles, CA, USA), amplified by 13 dB (Comlinear, Loveland, CO, USA), and recorded using a digital oscilloscope (LeCroy, Chestnut Ridge, NY, USA) operated in sequence mode. At each insonation pressure, two sequences were recorded over 3 s. Each sequence contained 50 traces and each trace comprised 2000 samples at a sampling frequency of 100 MHz. Spectral analysis was performed using MATLAB (Mathworks, Natick, MA, USA) to obtain the stable and inertial cavitation thresholds.
Examples of the average power spectra from ELIP and degassed water are shown in Figure 2(a). The subharmonic and odd multiples of the subharmonic (ultraharmonic) frequency components (blue bands) and inharmonic or broadband frequency components (red bands) were extracted (Figure 2(a)). Inharmonic bands are broadband frequency components excluding the fundamental, harmonic, subharmonic and ultraharmonic bands (Haworth et al 2012).
Figure 2.


(a) Example of cavitation spectrum from ELIP (solid line) and degassed water (DW) (dotted line). The blue bands indicate the sub- and ultraharmonics (centered at 3, 9, 15, 21 MHz). The red bands indicate the inharmonic bands or broadband at frequencies outside the fundamental (6 MHz), harmonics (12, 18 and 24 MHz) and sub- and ultraharmonics. (b) Example of subharmonic emissions from ELIP as a function of insonation peak rarefactional pressures. A three-segment piecewise linear fit was performed and the inflection between the first two segments was defined as the stable cavitation threshold. (c) Example of broadband emissions from ELIP as a function of insonation peak rarefactional pressures. A two-segment piecewise linear fit was performed and the inflection between the two segments was defined as the inertial cavitation threshold.
The root-mean-squared (RMS) values of the subharmonic (and ultraharmonic) emissions and broadband emissions are given by equation (1).
| (1) |
where PowerUCA and PowerDW are the detected acoustic emission powers from the UCAs (ELIP or Definity®) in the tubing and degassed water in the tubing, respectively. fBand includes the subharmonic and ultraharmonic frequency bands to calculate the stable cavitation threshold or the inharmonic (broadband) frequency bands to calculate the inertial cavitation threshold indicated in (Figure 2(a)).
Figure 2(b) shows the RMS subharmonic emissions as a function of the Doppler pulse peak rarefactional pressure. The cavitation threshold was defined as the lowest insonation pressure that elicited emissions which increased linearly with insonation pressure. This definition was used to ascertain the lowest insonation pressure at which cavitation emissions were detected and therefore the threshold of a particular type of cavitation (Fabiilli et al 2009). A three segment piecewise linear fit of the RMS subharmonic emissions was performed using the ‘slmengine’ function in MATLAB. The slopes of the first and the third segments were forced to be zero. The peak rarefactional pressure at the inflection between the first two segments was defined as the stable cavitation threshold as shown in Figure 2(b). A two-segment piecewise linear fit was performed on the RMS broadband emissions (Figure 2(c)) because the broadband signals, unlike the subharmonic signals, did not saturate at the higher peak rarefactional pressures. The peak rarefactional pressure at the inflection between the first two segments was defined as the inertial cavitation threshold as shown in Figure 2(c). Stable and inertial cavitation thresholds were ascertained for the range of pulse durations shown in Table 1.
Assessment of Loss of echogenicity
At each insonation pressure a B-mode image of ELIP or Definity® was saved on the ultrasound scanner and later post-processed in MATLAB. The B-mode imaging center frequency was 6.9 MHz in the duplex spectral Doppler mode. The frame rate, persistence, grayscale map, time gain compensation (TGC) and 2-D gain were kept constant throughout the experiments. Previous studies demonstrated that unlike the mean gray scale value (MGSV) computed from B-mode images, the mean digital intensity (MDI) computed on cine-loops, is directly proportional to the backscattered acoustic power and independent of the grayscale color map (Smith et al 2007, Porter et al 2006). Using a previously established technique (Radhakrishnan et al 2012) the linear MDIs were computed.
The ROIs were defined at locations unexposed to Doppler insonation and within the Doppler pulse to evaluate the loss of echogenicity of ELIP and Definity® in the static system as shown in Figure 3(a).
Figure 3.
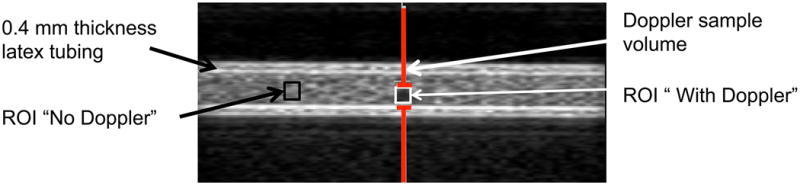
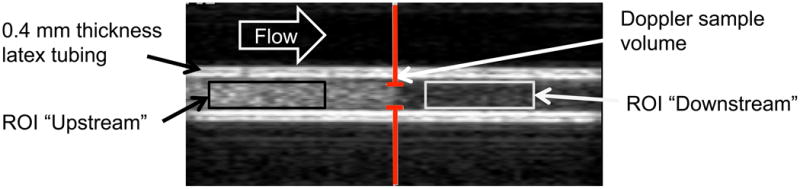
(a) Example of ELIP in the 0.4 mm thick latex tubing with no flow. The gray bars indicate the location of the Doppler “sample volume” or spatial pulse length. The echogenicity was analyzed within regions of interest (ROIs) that were unexposed (No Doppler) and exposed (With Doppler) to Doppler pulses. (b) Example of ELIP flowing through the 0.4 mm thick latex tubing. The gray bars indicate the location of the Doppler “sample volume” or spatial pulse length. The echogenicity was analyzed in regions of interest (ROIs) located upstream and downstream of the Doppler “sample volume”.
The percent loss of echogenicity (LOE) was computed using equation (2a).
| (2a) |
where MDANo Doppler and MDIWith Doppler are the mean digital intensities in the ROIs corresponding to locations unexposed and exposed to Doppler insonation respectively. Smith et al (2007) defined the rapid fragmentation threshold as the lowest pressure at which the MDI of ELIP reduced to the background value which corresponded to a 90% LOE within 5 s from the start of Doppler insonation. Thus the lowest peak rarefactional pressure causing a LOE of 90% was used to define the threshold for rapid loss of echogenicity of ELIP and Definity® in the static system.
For flowing ELIP or Definity®, the same definition of LOE threshold could not be used due to continuous replenishment of the destroyed contrast at the Doppler focus. Therefore, regions of interest (ROIs) were defined upstream and downstream of the Doppler focus as shown in Figure 3(b). The mean transit time between the upstream and downstream ROIs was 600 ms and the time to traverse the -6 dB beamwidth of the spectral Doppler pulse was 50 ms, which corresponds to approximately 62 Doppler pulses at the 1250 Hz pulse repetition frequency. LOE was computed for each insonation pressure using equation (2b).
| (2b) |
where MDIUp and MDIDown are the mean digital intensities in the ROIs upstream and downstream of the Doppler focus respectively. A numerical model was also developed to predict the cavitation phenomena causing LOE in ELIP and Definity® in the flow system.
Numerical calculations of the Loss of echogenicity (Theory)
The Mechanical Index (Apfel and Holland 1991), or MI, is the current onscreen display to gauge the potential for the onset of cavitation activity. However, the MI was not developed to gauge the loss of (Chen et al 2003) UCA echogenicity. In a recent numerical study, Bader and Holland (2013) used the Marmottant model (Marmottant et al 2005) to develop a cavitation index that gauges the potential for the onset of stable cavitation and UCA shell rupture. Prior work has indicated that stable cavitation (Uhlendorf and Hoffmann 1994, Biagi et al 2007, Sboros 2008), inertial cavitation (Chen et al 2003, Ammi et al 2006, Tortoli et al 2005), and shell rupture (Bouakaz et al 2005, Stride and Saffari 2003) can lead to changes in microbubble size or destruction and therefore a loss of echogenicity (Porter et al 2006, Smith et al 2007). Therefore, numerical calculations were performed in order to predict the loss of echogenicity of ELIP and Definity® due to either stable cavitation, inertial cavitation, or shell rupture (but not simultaneous combinations of these effects). The loss of echogenicity (LOE) was computed at each Doppler pressure (Pr) from the backscatter coefficients prior to and after Doppler exposure:
| (3) |
where ηinitial is the backscatter coefficient of ELIP or Definity® microbubbles prior to Doppler exposure, and ηSurviving is the backscatter coefficient of ELIP or Definity® microbubbles surviving after Doppler exposure. The backscatter coefficient is given by:
| (4) |
where σSC is the size-dependent scattering cross section of the microbubbles, n is the size-dependent number of microbubbles per unit volume, and d is the diameter of the microbubble. Exposure to pulsed Doppler was hypothesized to cause loss of echogenicity of UCAs by four potential cavitation phenomena: rupture of the UCA shell, subharmonic oscillations of the UCAs, subharmonic oscillations of free microbubbles (liberated from the UCA shell) and inertial cavitation of free microbubbles (liberated from the UCA shell). In order to determine the number of surviving microbubbles from the Doppler pulse exposure, the size-dependent thresholds for the four cavitation phenomena were computed. The size-dependent scattering cross section of the microbubbles exposed to B-mode ultrasound pulses was also computed. The loss of echogenicity was predicted using equations (3) and (4) following a three step process as described below.
In the first step, the acoustic pressure thresholds were numerically calculated for the four cavitation phenomena potentially responsible for LOE: (i) rupture of the shell of UCAs, (ii) subharmonic oscillations of UCAs (i.e. lipid-shelled microbubbles, ELIP and Definity®), (iii) subharmonic oscillations of free bubbles (i.e. liberated microbubbles), and (iv) inertial cavitation of free bubbles (i.e. liberated microbubbles). The rupture radius and subharmonic oscillations for ELIP and Definity® were calculated by numerical integration (fourth-order Runge-Kutta) of the Marmottant model (Marmottant et al 2005) in MATLAB (Bader and Holland 2013). The Marmottant model was developed for phospholipidshelled ultrasound contrast agents (Marmottant et al 2005), and has previous been used to determine the volumetric oscillations of Definity (Santin et al 2010, King and O'Brien Jr 2011).The Marmottant model is also applicable for ELIP, as the encapsulated gas is thought to be surrounded by a lipid monolayer (Kopechek et al 2011). The rupture radius, RRUPT, was defined following Marmottant et al (2005) as
| (5) |
where, RBUCK is the buckling radius, σ0 is the surface tension of the host fluid and χ is the elastic compression modulus. The pressure threshold for rupture of an UCA was reached once the radius of the UCA exceeded (Bader and Holland 2013). Calculations using this definition for UCA rupture are consistent with previously reported values of UCA rupture (Chen et al 2003) and LOE (Yeh and Su 2008). Note that diffusion of gas across the lipid shell is neglected. For subharmonic emissions, the scattered pressure was calculated following Leighton (TG Leighton 1997). The threshold for subharmonic emissions from UCAs was defined following Bader and Holland (2013) as the peak rarefactional pressure required for the frequency spectrum of the radiated pressure to be 20 dB lower than the fundamental amplitude. An example of the threshold rupture pressure for ELIP as a function of microbubble diameter is shown in Figure 4(a). The oscillations of free bubbles were modeled following the Gilmore equation (Gilmore 1952, Church 1989), which is valid to high Mach numbers (Prosperetti and Lezzi 1986) and accounts for damping due to acoustic radiation and viscosity. The pressure radiated by the free bubble was calculated following Akulichev (1971). The subharmonic pressure threshold for free bubbles was defined in the same manner as for shelled bubbles. For the rupture pressure threshold of UCAs and subharmonic pressure thresholds of UCAs and free bubbles, experimentally measured Doppler waveforms, described in section 2.3, were used as the acoustic excitation. Finally, the inertial cavitation pressure threshold was calculated using Newton's method for the analytic model derived by Holland and Apfel (1989).
Figure 4.


(a) The UCA shell rupture threshold (PRUPT) for the 1.67 μs Doppler pulse as a function of the initial UCA size (D0). The shell parameters correspond to ELIP from Kopechek et al (2011), and the rupture threshold is reported in terms of the peak rarefactional pressure amplitude of the Doppler pulse. Once the size-dependent threshold for a particular cavitation phenomena was exceeded by the Doppler pulse, it was assumed to be no longer echogenic. (b) Measured beam profile of the Doppler pressure field across the tubing cross-section. No field measurements were made in the black region. The number of surviving contrast agent microbubbles that contribute to backscatter were calculated via (equation 8) to account for the non-constant pressure amplitude of the Doppler pulse across the cross-section of the tube. (c) Scattering cross section as a function of initial UCA size (D0). Pr corresponds to the peak rarefactional pressure amplitude of the B-mode pulse.
In the second step, the number of microbubbles contributing to the backscatter coefficient was determined. Literature values for the initial size distributions (i.e. before Doppler exposure) of ELIP (Kopechek et al 2011) and Definity® (Faez et al 2011) were employed. The mean volume-weighted size for ELIP was 1.8 μm and for Definity® was 1.9 μm, and a size range of 200 nm to 6 μm was considered for both UCAs. The origin of unshelled microbubbles was assumed to be liberated microbubbles. This assumed size distribution likely overestimates the contribution of free microbubbles. The number of microbubbles surviving the Doppler pulse was determined from the spatial profile of the Doppler pulse within the lumen (Figure 4(b)) and the threshold for the particular cavitation phenomena (Figure 4(a)). Once the threshold for the particular cavitation phenomenon was reached for a given size, the microbubbles of that size were assumed to no longer contribute to the backscattered coefficient. The pressure amplitude beam profile of the Doppler pulse across the latex tube is shown in Figure 4(b). Note that the pressure amplitude varies across the tube lumen. Thus the acoustic exposure will depend on location. The number of surviving microbubbles, NSurviving with diameter d, was calculated from the fraction of the cross sectional area exceeding the (size-dependent) threshold for the cavitation phenomena, given by (6):
| (6) |
where NInitial is the number of microbubbles of diameter d prior to Doppler exposure, Adestroyed is the area of the beam profile exceeding the microbubble activity threshold, and Alumen is the cross sectional area of the lumen.
In the third step, the size-dependent scattering cross-section was calculated for ELIP and Definity® microbubbles. The scattering cross section σSC is defined as the scattered power normalized to the incident intensity (Church 1995):
| (7) |
where r is the radial distance from the scattering source, and the intensities (scattered ISC and incident IINC) were computed as
| (8) |
where P is the amplitude of the scattered or incident pressure, ρ0 is the fluid density and c0 is sound speed in the fluid. Experimentally measured B-mode waveforms described in section 2.3 were used to calculate the incident intensity. To calculate the scattered intensity, the volumetric oscillations of either ELIP or Definity® exposed to B-mode pulses were calculated using the Marmottant equation (Marmottant et al 2005). The scattered pressure was calculated following Leighton (1997), and subsequently multiplied by the frequency-dependent response of the L12-5 transducer (6 MHz center frequency, 4.8 MHz -6 dB bandwidth). Example size-dependent scattering cross sections are shown in Figure 4(c). Thus the backscatter intensities ηinitial and ηsurviving were ascertained separately for each of the four cavitation phenomena with Equation (4) using the computed scattering cross sections (Equation (7)), the initial number of microbubbles taken from literature values, and the calculated number of microbubbles surviving the Doppler pulse (Equation (6)). The predicted loss of echogenicity was calculated using equation (3) for each of the four cavitation phenomena individually. The physical constants of the fluid (plasma) and shell parameters used to calculate the loss of echogenicity were adopted from literature values. The values of these constants, and the references from which they were taken, are listed in Table 2.
Table 2. Physical constants used in the numerical calculations of loss of echogenicity.
| Notation | Physical constant | Value |
|---|---|---|
| c0 | Speed of sound in fluid | 1540 m/s |
| P0 | Ambient pressure in fluid | 0.1 MPa |
| μ | Fluid viscosity | 1.1 cP |
| σ0 | Surface tension of fluid | 0.06 kg/s2 |
| Ks | Surface dilatational viscosity of the UCA shell | 2.4 × 10⁻⁹ kg/s (Definity® (Santin et al 2010)) |
| 1.35 × 10⁻⁹ kg/s (ELIP (Kopechek et al 2011)) | ||
| χ | Elastic compression modulus of the UCA shell | 0.38 N/m (Definity® (Santin et al 2010)) |
| 0.56 N/m (ELIP (Kopechek et al 2011) | ||
| κ | Ratio of specific heats in encapsulated gas | 1.09 (octafluoropropane (Macdonald et al 2004)) |
| 1.4 (air) |
Statistical Analysis
Statistical analysis was performed in MATLAB (Mathworks). An unequal variance t-test was performed to compare the stable and inertial cavitation thresholds. A three-way ANOVA was performed to compare the cavitation thresholds ascertained for the two UCAs (ELIP and Definity®) with and without flow exposed to pulsed Doppler using four pulse duration settings. Bonferroni multiple comparison post-hoc tests were conducted to elucidate the factors that contributed to significant changes in cavitation thresholds. A two-way ANOVA with Bonferroni multiple comparison was performed to compare the LOE thresholds in the static system with the rapid fragmentation thresholds determined by Smith et al (2007). This statistical test was also used to compare the LOE thresholds and the cavitation thresholds in the static system. The Kolmogorov–Smirnov test (K-S) was used to compare the numerical prediction of LOE with the measured LOE for ELIP and Definity® in the flow system (α=0.05).
3. Results
Cavitation Thresholds
Figures 5(a) and (b) show the stable and inertial cavitation thresholds of ELIP and Definity®, respectively, as a function of pulse duration in flow and static conditions. The cavitation thresholds of both UCAs had a weak dependence on pulse duration. For each pulse duration, flow setting, and type of UCA, the stable cavitation thresholds were found to be significantly lower than the inertial cavitation thresholds (p<0.01). There was no difference in the cavitation thresholds (stable and inertial) at the two shortest pulse durations 1.67 μs and 3.33 μs. However, the cavitation thresholds (stable and inertial) at the longer pulse durations (5.83 μs and 8.33 μs) were found to decrease with increasing pulse duration (p<0.01). This decrease indicated a weak dependence of cavitation thresholds on pulse duration. Flow conditions did not have a significant effect on the stable and inertial cavitation thresholds. The type of UCA (ELIP or Definity®) also did not have an effect on the cavitation thresholds.
Figure 5.

Stable and inertial cavitation thresholds in (a) ELIP, and (b) Definity® in flow and static conditions.
Loss of echogenicity
The LOE thresholds in the static system were defined as the minimum insonation pressure at which the LOE was 90% based on criteria for rapid fragmentation ascertained by Smith et al (2007). Figure 6(a) shows the LOE thresholds and cavitation thresholds of ELIP in a static system compared with the rapid fragmentation thresholds reported by Smith et al (2007). There was no difference between the LOE thresholds of ELIP in the static system and the rapid fragmentation thresholds of ELIP measured by Smith et al (2007) (p>0.05) (Figure 6(a)). Figure 6(b) shows the LOE thresholds and cavitation thresholds for Definity® in a static system. The thresholds of LOE from ELIP and Definity® were not different for the four pulse durations. For ELIP and Definity® in a static fluid exposed to short ultrasound pulse durations (1.67 μs and 3.33 μs) shown in Figures 6 (a) and (b), the threshold of LOE was higher than the threshold for stable and inertial cavitation. However, there was no difference between the LOE thresholds and the inertial cavitation thresholds at the longer pulse durations (5.83 μs and 8.33 μs) in the static system.
Figure 6.

Comparison of loss of echogenicity, rapid fragmentation (Smith et al 2007) and stable and inertial cavitation thresholds in (a) ELIP and (b) Definity® in the static fluid.
Because only a fraction of UCAs were exposed to the Doppler pulses in the flow system, the LOE did not have a well-defined threshold similar to that measured by Smith et al (2007). Inherent to the numerical calculations of LOE was the assumption that either UCA shell rupture, subharmonic oscillations of UCAs, subharmonic oscillations of liberated microbubbles, or inertial cavitation of liberated microbubbles caused the disappearance of contrast. The numerical calculation and experimental measurement of the LOE for ELIP was determined at the four pulse durations (see Figure 7(b) and Table 3(a)). The K-S tests disproved the null hypothesis that the numerically calculated LOE from ELIP rupture and the experimentally measured LOE (p=0.006) came from the same parent distribution. Also, the numerically calculated LOE based on subharmonic emissions and inertial collapse had substantially worse agreement with the measured LOE (p≪0.0001). The numerical calculation and experimental determination of LOE for Definity® was compared for Doppler exposures with four pulse durations (see Figure 7(b) and Table 3(b)). The numerically calculated LOE from Definity® rupture appeared to have the same functional form and intercept as the experimentally measured LOE for all pulse durations. The numerical calculation of LOE from subharmonic oscillations or inertial collapse did not follow the functional trend of the experimentally measured LOE. K-S tests were used to test the null hypothesis that the numerically calculated and experimentally measured LOEs came from the same distribution. The numerical calculation of LOE from Definity® rupture had similar distributions as the measured LOE curves for Doppler exposures at all four pulse durations (p>0.05) (Table 3(b)). Also, the numerically calculated LOEs based on subharmonic emissions and inertial collapse did not agree with the measured LOE for Definity® at any of the four pulse duration settings (p≪0.001).
Figure 7.


Comparison of experimentally measured loss of echogenicity with the numerically calculated loss of echogenicity from (a) ELIP and (b) Definity®. Flowing ELIP or Definity® were exposed to a Doppler pulse of duration 1.66 μs. The numerically calculated loss of echogenicity was based on ELIP or Definity® rupture (
 ), subharmonic (SH) emissions from ELIP or Definity® (
 ), (SH) emissions from bubbles without a stabilizing shell (
 ), or inertial collapse of bubbles without a stabilizing shell (
 ).
).
Table 3(a). K-S test between numerical calculation and measured loss of echogenicity from ELIP.
| Pulse duration (μs) | ELIP p-value | |||
|---|---|---|---|---|
| UCA Rupture | UCA SH | Free bubble SH | Inertial cavitation | |
| 1.67 | 0.006 | 2.2 × 10⁻¹⁵ | 2.6 × 10⁻⁹ | 4.1 × 10⁻²⁰ |
| 3.33 | 1.7 × 10⁻⁵ | 3.9 × 10⁻¹⁶ | 4.5 × 10⁻¹⁴ | 8.2 × 10⁻²⁴ |
| 5.83 | 7.6 × 10⁻⁵ | 2.6 × 10⁻¹⁹ | 3.3 × 10⁻¹³ | 4.7 × 10⁻²⁸ |
| 8.33 | 2.3 × 10⁻⁵ | 1.5 × 10⁻¹⁹ | 2 × 10-15 | 3.7 × 10⁻³⁴ |
Table 3(b). K-S test between numerical calculation and measured loss of echogenicity from Definity®.
| Pulse duration (μs) | Definity p-value | |||
|---|---|---|---|---|
| UCA Rupture | UCA SH | Free bubble SH | Inertial cavitation | |
| 1.67 | 0.07 | 1.8 × 10⁻¹⁸ | 1.4 × 10⁻¹² | 5 × 10-23 |
| 3.33 | 0.09 | 3.7 × 10⁻⁹ | 1.1 × 10⁻¹¹ | 1.6 × 10⁻²² |
| 5.83 | 0.08 | 1.9 × 10⁻⁶ | 2.8 × 10⁻¹¹ | 3.5 × 10⁻²⁵ |
| 8.33 | 0.14 | 1.2 × 10⁻⁸ | 3 × 10⁻⁸ | 4 × 10-30 |
The stable and inertial cavitation emissions had an exponential relationship with LOE from ELIP and Definity®. The relationship between subharmonic emissions and broadband emissions and LOE of ELIP for a 1.67 μs pulse duration are shown in Figures 8(a) and (b) respectively. The relationship between subharmonic emissions and broadband emissions and LOE of Definity® for a 1.67 μs pulse duration are shown in Figures 9(a) and 9(b) respectively. Also shown are exponential fits to the experimental data (R2 > 0.90). The exponential fits (Sfit) were of the form given by equation (10)
Figure 8.

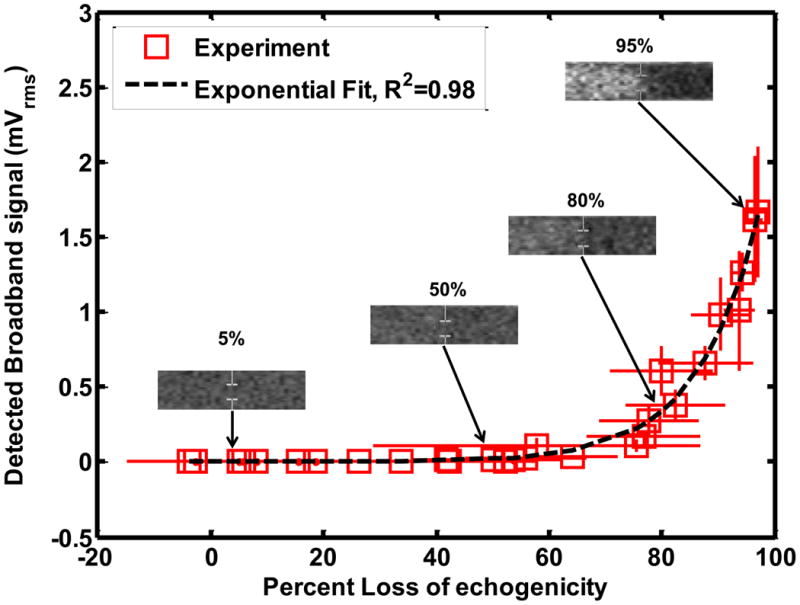
Relationship between loss of echogenicity and (a) subharmonic emissions, and (b) broadband emissions from ELIP insonified by Doppler pulses of duration 1.66 μs. The open squares represent the experimental data. The x and y error bars represent the standard deviation of four measurements. The dotted line represents an exponential fit. The insets show the onscreen echogenicity of ELIP flowing through the Doppler focus and the corresponding percent loss of echogenicity.
Figure 9.

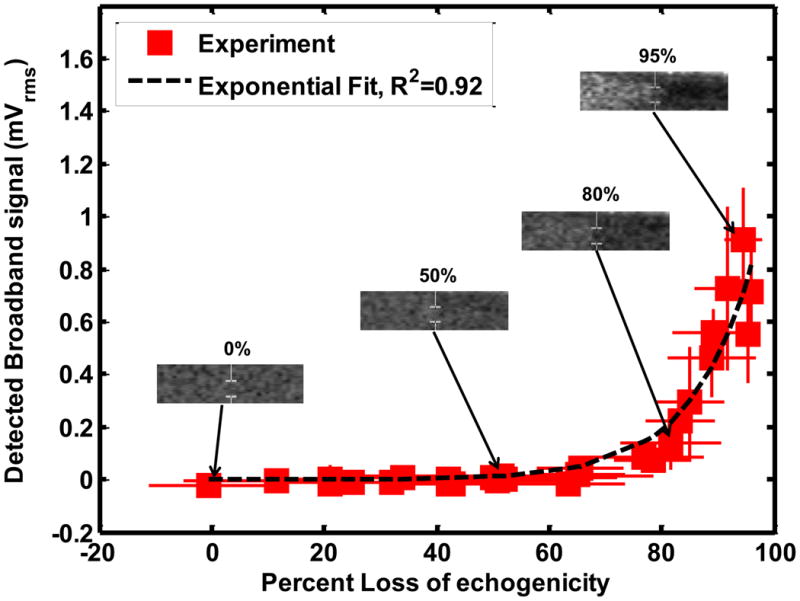
Relationship between loss of echogenicity and (a) subharmonic emissions, and (b) broadband emissions from Definity® insonified by Doppler pulses of duration 1.66 μs. The solid squares represent the experimental data. The x and y error bars represent the standard deviation of four measurements. The dotted line represents an exponential fit. The insets show the onscreen echogenicity of ELIP flowing through the Doppler focus and the corresponding percent loss of echogenicity.
| (10) |
Where So is the cavitation signal corresponding to 0% LOE and k is the exponential growth constant. Figures 8(b) and 9(b) also show insets of the onscreen echogenicity of ELIP and Definity®, respectively, as these agents flow through the Doppler focus.
4. Discussion
Cavitation thresholds and loss of echogenicity from ELIP and Definity® were assessed in a physiologic fluid system. In the following discussion, the cavitation and LOE thresholds are compared with the cavitation and rapid fragmentation thresholds reported in the literature. The relationship between cavitation and loss of echogenicity and the limitations of the study are also discussed.
Cavitation thresholds
The stable cavitation thresholds were found to be lower than the inertial cavitation thresholds at all four pulse duration settings, for both ELIP and Definity®, in the static and the flow system. Theoretical computations by Bader and Holland (2013) predict that the stable cavitation threshold of resonant-sized bubbles exposed to 6-MHz pulsed ultrasound will be lower than their inertial cavitation threshold. Hitchcock et al (2010) ascertained the stable and inertial cavitation thresholds of ELIP insonified by 1-MHz continuous wave (CW) ultrasound. These authors also found that the threshold for ultraharmonic emissions (characteristic of stable cavitation) was lower than the inertial cavitation threshold. The pressure amplitude of the cavitation threshold of ELIP exposed to 1-MHz CW ultrasound (Hitchcock et al 2010) was found to be lower than the cavitation threshold found in this study for ELIP exposed to 6-MHz pulsed ultrasound. This difference is likely due to the frequency dependence of the stable and inertial cavitation thresholds. A higher cavitation threshold is expected for higher frequency ultrasound exposure (Bader and Holland 2013). In addition, the cavitation threshold also exhibited a weak dependence on pulse duration, as seen in Figures 5(a) and (b), which may have contributed to the difference. The inertial cavitation pressure threshold of ELIP and Definity® at the lowest pulse duration (1.67 μs) was 0.63 ± 0.01 MPa and 0.56 ± 0.09 MPa respectively. These inertial cavitation thresholds matched the inertial cavitation threshold (0.64 MPa) predicted for free microbubbles exposed to 6-MHz single cycle pulses (Apfel and Holland 1991).
The dependence of the cavitation threshold on pulse duration has also been investigated by other authors (Atchley et al 1988, Fowlkes and Crum 1988, Lo et al 2007). Ammi et al (2006) found that the post-excitation inertial collapse thresholds in Optison® decreased with increasing number of cycles at three different insonation frequencies. The results in Figure 4 indicating a decrease in inertial cavitation threshold for ELIP and Definity® with increasing pulse duration were consistent with the observations by Ammi et al (2006). A decrease in stable cavitation threshold with increasing pulse duration (Figure 5) is consistent with studies by Andersen and Jensen (2009) and Vykhodtseva et al (1995) who observed an increase in the stable cavitation dose and a decrease in the stable cavitation threshold with increasing pulse duration.
The presence or absence of flow did not affect the cavitation thresholds. The type of UCA (ELIP or Definity®) also did not affect the cavitation thresholds. Both ELIP and Definity® are lipid shelled UCAs. However, ELIP and Definity® have different lipid compositions, microbubble concentrations and microbubble size distributions. Further, ELIP encapsulate air pockets and aqueous cores (Huang 2008, Kopechek et al 2011) whereas Definity® microbubbles have lipid monolayers encapsulating octafluoropropane gas. However other studies (Bader and Holland 2013, Stride and Saffari 2003) have suggested that the UCA shells must first be disrupted in order to liberate the gas microbubbles to nucleate bubble activity once the pressure threshold is exceeded. Thus the shell properties of UCAs may not have affected the cavitation thresholds because gas was effectively liberated. Other studies (Kwan and Borden 2010, Kabalnov et al 1998, Sarkar et al 2009) have shown that UCAs containing low-solubility gases, when diluted in air-saturated fluids, undergo gas equilibration and become saturated with air within a few seconds. For these reasons the type of gas in lipid-shelled UCAs also may not have influenced the cavitation thresholds in these experiments.
Loss of Echogenicity
Several studies have been carried out in static fluids to investigate the relationship between cavitation and ultrasound-induced UCA destruction, specifically rapid fragmentation (Stride and Saffari 2003, Sboros 2008). In some studies, the broadband emissions and post-excitation signals characteristic of inertial cavitation were used as indicators of rapid fragmentation of UCAs (Chen et al 2003b, Ammi et al 2006). However, other studies contend that inertial cavitation thresholds were higher than the rapid fragmentation thresholds of UCAs (Chen et al 2000, Uhlendorf et al 2000). UCA rapid fragmentation thresholds elucidated in previous studies by Smith et al (2007) were verified in the current study by measuring the pressure threshold of the loss of echogenicity in a static system (Figure 6(a)). At a pulse repetition frequency of 1250 kHz, significant acoustic streaming and radiation force were not observed. These LOE thresholds were found to be statistically similar to the inertial cavitation thresholds at the longer pulse durations (5.83 μs and 8.33 μs). However, the LOE thresholds were found to be higher than the inertial cavitation thresholds at the shorter pulse durations (1.67 μs and 3.33 μs). Spectral broadening at the shorter pulse durations may have resulted in an underestimation of the inertial cavitation threshold.
The numerical calculation of the loss of echogenicity from Definity® shell rupture matched the experimentally measured loss of echogenicity threshold for all four pulse durations (p >0.05) (Figure 7(a)). Based on these results we postulate that the rupture of UCA shells liberates the encapsulated gas which undergoes dissolution and causes the loss of echogenicity on B-mode images. Numerous studies have acoustically (Uhlendorf et al 2000, De Jong et al 2002) and optically (Bouakaz et al 2005, Bloch et al 2004) recorded the liberation of gas from ruptured UCAs. Liberated gas microbubbles dissolve into the surrounding medium within several hundred milliseconds (Kwan and Borden 2010, Kabalnov et al 1998, Sarkar et al 2009, Bevan et al 2008) and would not survive transport to the downstream ROI. Other groups have also posited that microbubbles liberated from a lipid shell may be stabilized by lipid fragments that re-organize after rupture (Chomas et al 2001, Mehier-Humbert et al 2007, Postema et al 2004). Thus the post-rupture microbubbles may be smaller in size than the initial UCAs (Chomas et al 2001) and therefore non-echogenic at the B-mode center frequency (6.9 MHz). As a larger fraction of the microbubble population undergoes rupture, an exponential increase in loss of echogenicity occurs. An exponential relationship between loss of echogenicity and insonation pressure was also observed by Yeh et al (2008).
The numerical calculation of the loss of echogenicity exposed to Doppler pulses based on ELIP rupture was found to be different from the measured loss of echogenicity using a K-S test (Table 3(a)). There are several confounding effects that may account for the discrepancies between the measurement and prediction shown in Figure 7(b) but not for Definity® (Figure 7(a)). Both the shell parameters and the size distribution strongly influence the rupture thresholds and the backscattered pressures. In the current study, the ELIP shell parameters and size distributions used in the numerical computation of loss of echogenicity were taken from a previously published study (Kopechek et al 2011). The lipid formulation of ELIP used by Kopechek et al (2011) is different from the one used in the current study (Buchanan et al 2010). Lipid composition may have an effect on shell properties and size distribution of the encapsulated gas. Further studies are required to establish the shell parameters and encapsulated microbubble size distributions for the modified lipid formulation used in this study. Additionally, the influence of the lipid bilayer of the liposome on the oscillations of the encapsulated microbubble has not been considered in these calculations.
The numerical calculations suggest the LOE depends on shell rupture. The threshold for UCA rupture can occur prior to subharmonic emissions or inertial cavitation (Bader and Holland 2013). Hence, the onset of LOE may occur without stable or inertial cavitation emissions, shown in Figures 8 and 9. The exponential relationship between the disappearance of contrast and inertial cavitation activity in Definity® was also observed by Tung et al (2010) in a vessel phantom placed inside a murine skull. It is evident from Figures 8 and 9 that ELIP and Definity® lost more than 80% echogenicity even before the onset of inertial cavitation. As shown in Figure 7, the rupture of UCAs was predicted to be the main source of loss of echogenicity. Thus the loss of echogenicity may occur at low insonation pressures without concomitant cavitation activity. This disproves the original hypothesis of this study that the onset of rapid loss of UCA echogenicity is concomitant with the threshold of inertial cavitation. However, an 80% loss of echogenicity could serve as an indicator of the onset of stable and inertial cavitation.
Limitations
The insonation pressures and pulse durations used in this study were limited by the settings on the Philips HDI 5000 scanner in the duplex Doppler mode. Also the elevational beamwidth of the clinical L12-5 transducer did not cover the entire diameter of the lumen. As a result there was residual echogenicity downstream of the Doppler even at high insonation pressures. However, the choice of transducer and tubing diameter in this study were both clinically and physiologically relevant (Holubkov et al 2002, Masuo et al 2002).
Cavitation emissions were acquired using a single element transducer aligned confocally with the Doppler sample volume. Note that, the Doppler beam profile had side-lobes that could have interacted with the UCAs as they flowed into the Doppler sample volume. Unlike other studies (Kopechek et al 2012, Farny et al 2009), no corrections were made to the power spectra based on the frequency response of the passive cavitation detector and frequency dependent attenuation of the tubing. Cavitation thresholds were defined as the lowest insonation pressure beyond which there was a steady increase in cavitation power with insonation pressure. Thus the thresholds are limited by the sensitivity of the detector, the detection electronics and the noise in the system. However, a fairly broadband detector with a -3dB bandwidth of 13 MHz was chosen to detect subharmonics, ultraharmonics and broadband emissions. Also, spectral boardening at shorter pulse durations may have resulted in an underestimation of the inertial cavitation threshold.
Inherent to the numerical calculations of loss of echogenicity was the assumption that once the size-dependent threshold for a particular cavitation phenomenon was reached, the microbubble underwent dissolution and no longer contributed to the echogenicity. This assumption was not verified experimentally in this study. The definition of the stable cavitation threshold used in the numerical calculations of loss of echogenicity was different than the definition of the stable cavitation threshold used in the experiments. Unlike the experimental measurements, there was no baseline degassed water control for the numerical calculations. Hence, a previously published definition based on the amplitude relative to the fundamental was used (Bader and Holland 2013). Furthermore, the calculations neglect the diffusion of gas through the lipid shell. The passive diffusion of gas from UCAs typically occurs on time scales on the order of seconds to hours (Sarkar et al 2009), which are much longer than the several microsecond Doppler pulses considered here. Acoustically driven diffusion (Porter et al 2006) can occur on millisecond time scales for both unshelled and shelled microbubbles (Chomas et al 2001). The presence of a shell on UCAs retards gas diffusion (Fyrillas and Szeri 1996).
5. Conclusions
This study ascertained the stable and inertial cavitation thresholds for two lipid-shelled UCAs, ELIP and Definity®, as a function of Doppler pulse duration. The cavitation threshold decreased with increasing pulse duration. For each pulse duration, the ELIP and Definity® cavitation thresholds did not differ substantially. The loss of echogenicity was quantified as a function of insonation pressure at the four pulse durations. Numerical calculation of the loss of echogenicity elucidated that UCA shell rupture is likely the main source of loss of echogenicity. Stable or inertial cavitation emissions were not detected until approximately 80% loss of echogenicity was observed. Once 80% loss of echogenicity occured, both stable and inertial cavitation were evident.
Acknowledgments
This work has been funded in part by NIH grants R01HL059586, R01HL074002, and F32HL104916. The authors would also like to acknowledge the contribution of Bin Huang (Ph.D.) in providing statistical methods to ascertain cavitation thresholds. This collaboration with Dr. Huang was enabled by the National Center for Advancing Translational Sciences, National Institutes of Health, through Grant 8 UL1 TR000077-04.
References
- Akulichev V. Pulsations of cavitation voids. High-Power Ultrasonic Fields 1971 [Google Scholar]
- Ammi AY, Cleveland RO, Mamou J, Wang GI, Bridal SL, O'Brien WD., Jr Ultrasonic contrast agent shell rupture detected by inertial cavitation and rebound signals. IEEE Trans Ultrason Ferroelectr Freq Control. 2006;53(1):126–35. doi: 10.1109/tuffc.2006.1588398. [DOI] [PMC free article] [PubMed] [Google Scholar]
- Andersen KS, Jensen JA. Ambient pressure sensitivity of microbubbles investigated through a parameter study. J Acoust Soc Am. 2009;126(6):3350–8. doi: 10.1121/1.3242359. [DOI] [PubMed] [Google Scholar]
- Apfel RE, Holland CK. Gauging the likelihood of cavitation from short-pulse, low-duty cycle diagnostic ultrasound. Ultrasound Med Biol. 1991;17(2):179–85. doi: 10.1016/0301-5629(91)90125-g. [DOI] [PubMed] [Google Scholar]
- Atchley AA, Frizzell LA, Apfel RE, Holland CK, Madanshetty S, Roy RA. Thresholds for cavitation produced in water by pulsed ultrasound. Ultrasonics. 1988;26(5):280–5. doi: 10.1016/0041-624x(88)90018-2. [DOI] [PubMed] [Google Scholar]
- Bader KB, Holland CK. Gauging the likelihood of stable cavitation from ultrasound contrast agents. Phys Med Biol. 2013;58(1):127–44. doi: 10.1088/0031-9155/58/1/127. [DOI] [PMC free article] [PubMed] [Google Scholar]
- Bazan-Peregrino M, Arvanitis CD, Rifai B, Seymour LW, Coussios C. Ultrasound-induced cavitation enhances the delivery and therapeutic efficacy of an oncolytic virus in an in vitro model. J Controlled Release. 2012;157(2):235–42. doi: 10.1016/j.jconrel.2011.09.086. [DOI] [PubMed] [Google Scholar]
- Bekeredjian R, Grayburn PA, Shohet R. Use of ultrasound contrast agents for gene or drug delivery in cardiovascular medicine. J Am Coll Cardiol. 2005;45(3):329–35. doi: 10.1016/j.jacc.2004.08.067. [DOI] [PubMed] [Google Scholar]
- Bevan PD, Karshafian R, Burns P. The Influence of Fragmentation on the Acoustic Response from Shrinking Bubbles. Ultrasound in Medicine and Biology. 2008;34(7):1152–62. doi: 10.1016/j.ultrasmedbio.2007.12.016. [DOI] [PubMed] [Google Scholar]
- Bloch SH, Wan M, Dayton PA, Ferrara KW. Optical observation of lipid- and polymer-shelled ultrasound microbubble contrast agents. Appl Phys Lett. 2004;84(4):631–3. [Google Scholar]
- Bouakaz A, Versluis M, De Jong N. High-speed optical observations of contrast agent destruction. Ultrasound in Medicine and Biology. 2005;31(3):391–9. doi: 10.1016/j.ultrasmedbio.2004.12.004. [DOI] [PubMed] [Google Scholar]
- Britton GL, Kim H, Kee PH, Aronowski J, Holland CK, McPherson DD, Huang S. In vivo therapeutic gas delivery for neuroprotection with echogenic liposomes. Circulation. 2010;122(16):1578–87. doi: 10.1161/CIRCULATIONAHA.109.879338. [DOI] [PMC free article] [PubMed] [Google Scholar]
- Buchanan KD, Huang S, Kim H, MacDonald RC, McPherson DD. Echogenic liposome compositions for increased retention of ultrasound reflectivity at physiologic temperature. J Pharm Sci. 2008;97(6):2242–9. doi: 10.1002/jps.21173. [DOI] [PMC free article] [PubMed] [Google Scholar]
- Buchanan KD, Huang S, Kim H, McPherson DD, MacDonald RC. Encapsulation of NF-κB decoy oligonucleotides within echogenic liposomes and ultrasound-triggered release. J Controlled Release. 2010;141(2):193–8. doi: 10.1016/j.jconrel.2009.09.017. [DOI] [PMC free article] [PubMed] [Google Scholar]
- Chen W, Brayman AA, Matula TJ, Crum LA. Inertial cavitation dose and hemolysis produced in vitro with or without Optison®. Ultrasound in Medicine and Biology. 2003a;29(5):725–37. doi: 10.1016/s0301-5629(03)00013-9. [DOI] [PubMed] [Google Scholar]
- Chen W, Matula TJ, Brayman AA, Crum LA. A comparison of the fragmentation thresholds and inertial cavitation doses of different ultrasound contrast agents. J Acoust Soc Am. 2003b;113(1):643–51. doi: 10.1121/1.1529667. [DOI] [PubMed] [Google Scholar]
- Chen W, Matula TJ, Crum LA. Ultrasound contrast agent behavior near the fragmentation threshold. Proceedings of the IEEE Ultrasonics Symposium. 2000:1935–8. [Google Scholar]
- Chomas JE, Dayton P, Allen J, Morgan K, Ferrara KW. Mechanisms of contrast agent destruction. Ultrasonics, Ferroelectrics and Frequency Control, IEEE Transactions on. 2001;48(1):232–48. doi: 10.1109/58.896136. [DOI] [PubMed] [Google Scholar]
- Church CC. The effects of an elastic solid surface layer on the radial pulsations of gas bubbles. J Acoust Soc Am. 1995;97:1510. [Google Scholar]
- Church CC. A theoretical study of cavitation generated by an extracorporeal shock wave lithotripter. J Acoust Soc Am. 1989;86(1):215–27. doi: 10.1121/1.398328. [DOI] [PubMed] [Google Scholar]
- Coussios CC, Farny CH, ter Haar G, Roy RA. Role of acoustic cavitation in the delivery and monitoring of cancer treatment by high-intensity focused ultrasound (HIFU) International Journal of Hyperthermia. 2007;23(2):105–20. doi: 10.1080/02656730701194131. [DOI] [PubMed] [Google Scholar]
- Coussios CC, Roy RA. Applications of Acoustics and Cavitation to Noninvasive Therapy and Drug Delivery. 2008:395–420. [Google Scholar]
- Cramer E, Lauterborn W. Acoustic cavitation noise spectra. Applied Scientific Research. 1982;38(1):209–14. [Google Scholar]
- Datta S, Coussios C, Ammi AY, Mast TD, de Courten-Myers GM, Holland CK. Ultrasound-Enhanced Thrombolysis Using Definity® as a Cavitation Nucleation Agent. Ultrasound in Medicine and Biology. 2008;34(9):1421–33. doi: 10.1016/j.ultrasmedbio.2008.01.016. [DOI] [PMC free article] [PubMed] [Google Scholar]
- Dave JK, et al. On the implementation of an automated acoustic output optimization algorithm for subharmonic aided pressure estimation. Ultrasonics. 2013 doi: 10.1016/j.ultras.2012.12.010. [DOI] [PMC free article] [PubMed] [Google Scholar]
- De Jong N, Bouakaz A, Ten Cate FJ. Contrast harmonic imaging. Ultrasonics. 2002;40(1-8):567–73. doi: 10.1016/s0041-624x(02)00171-3. [DOI] [PubMed] [Google Scholar]
- Eisenbrey JR, et al. Simultaneous grayscale and subharmonic ultrasound imaging on a modified commercial scanner. Ultrasonics. 2011;51(8):890–7. doi: 10.1016/j.ultras.2011.05.003. [DOI] [PMC free article] [PubMed] [Google Scholar]
- Eller A, Flynn H. Generation of Subharmonics of Order One-Half by Bubbles in a Sound Field. J Acoust Soc Am. 1969;46:722. [Google Scholar]
- Fabiilli ML, Haworth KJ, Fakhri NH, Kripfgans OD, Carson PL, Fowlkes JB. The role of inertial cavitation in acoustic droplet vaporization. Ultrasonics, Ferroelectrics and Frequency Control, IEEE Transactions on. 2009;56(5):1006–17. doi: 10.1109/TUFFC.2009.1132. [DOI] [PMC free article] [PubMed] [Google Scholar]
- Faez T, Goertz D, De Jong N. Characterization of Definity™ Ultrasound Contrast Agent at Frequency Range of 5-15 MHz. Ultrasound in Medicine and Biology. 2011;37(2):338–42. doi: 10.1016/j.ultrasmedbio.2010.11.014. [DOI] [PubMed] [Google Scholar]
- Farny CH, Holt RG, Roy RA. Temporal and Spatial Detection of HIFU-Induced Inertial and Hot-Vapor Cavitation with a Diagnostic Ultrasound System. Ultrasound in Medicine and Biology. 2009;35(4):603–15. doi: 10.1016/j.ultrasmedbio.2008.09.025. [DOI] [PubMed] [Google Scholar]
- FDA. Joint Meeting of the Cardiovascular and Renal Drugs Advisory Committee and the Drug Safety and Risk Management Advisory Committee. 2011:79. [Google Scholar]
- Fowlkes JB, Crum LA. Cavitation threshold measurements for microsecond length pulses of ultrasound. J Acoust Soc Am. 1988;83(6):2190–201. doi: 10.1121/1.396347. [DOI] [PubMed] [Google Scholar]
- Flynn H. Physics of acoustic cavitation in liquids. Physical acoustics. 1964;1:57–172. Part B. [Google Scholar]
- Fyrillas MM, Szeri AJ. Surfactant dynamics and rectified diffusion of microbubbles. J Fluid Mech. 1996;311:361–78. [Google Scholar]
- Geigy JR, Diem K, Lentner C. Scientific Tables 1975 [Google Scholar]
- Gilmore FR. The growth or collapse of a spherical bubble in a viscous compressible liquid 1952 [Google Scholar]
- Hamilton AJ, Huang S, Warnick D, Rabbat M, Kane B, Nagaraj A, Klegerman M, McPherson DD. Intravascular Ultrasound Molecular Imaging of Atheroma Components In Vivo. J Am Coll Cardiol. 2004;43(3):453–60. doi: 10.1016/j.jacc.2003.07.048. [DOI] [PubMed] [Google Scholar]
- Haworth KJ, Mast TD, Radhakrishnan K, Burgess MT, Kopechek JA, Huang S, McPherson DD, Holland CK. Passive imaging with pulsed ultrasound insonations. J Acoust Soc Am. 2012;132(1):544–53. doi: 10.1121/1.4728230. [DOI] [PMC free article] [PubMed] [Google Scholar]
- Herbst SM, et al. Delivery of stem cells to porcine arterial wall with echogenic liposomes conjugated to antibodies against CD34 and intercellular adhesion molecule-1. Molecular Pharmaceutics. 2010;7(1):3–11. doi: 10.1021/mp900116r. [DOI] [PMC free article] [PubMed] [Google Scholar]
- Hitchcock KE, et al. Ultrasound-enhanced delivery of targeted echogenic liposomes in a novel ex vivo mouse aorta model. J Controlled Release. 2010;144(3):288–95. doi: 10.1016/j.jconrel.2010.02.030. [DOI] [PMC free article] [PubMed] [Google Scholar]
- Hitchcock KE, Ivancevich NM, Haworth KJ, Caudell Stamper DN, Vela DC, Sutton JT, Pyne-Geithman GJ, Holland CK. Ultrasound-Enhanced rt-PA Thrombolysis in an ex vivo Porcine Carotid Artery Model. Ultrasound in Medicine and Biology. 2011;37(8):1240–51. doi: 10.1016/j.ultrasmedbio.2011.05.011. [DOI] [PMC free article] [PubMed] [Google Scholar]
- Holland CK, Apfel RE. Improved theory for the prediction of microcavitation thresholds. IEEE Trans Ultrason Ferroelectr Freq Control. 1989;36(2):204–8. doi: 10.1109/58.19152. [DOI] [PubMed] [Google Scholar]
- Holubkov R, et al. Large brachial artery diameter is associated with angiographic coronary artery disease in women. Am Heart J. 2002;143(5):802–7. doi: 10.1067/mhj.2002.121735. [DOI] [PubMed] [Google Scholar]
- Huang S. Liposomes in ultrasonic drug and gene delivery. Adv Drug Deliv Rev. 2008;60(10):1167–76. doi: 10.1016/j.addr.2008.03.003. [DOI] [PubMed] [Google Scholar]
- Huang SL, Kee P, McPherson DD, MacDonald RC. Multi-functional echogenic liposomes for image-guided and ultrasound-controlled ppar agonist delivery. J Am Coll Cardiol. 2007;49 [Google Scholar]
- Huang S, Kee PH, Kim H, Moody MR, Chrzanowski SM, MacDonald RC, McPherson DD. Nitric Oxide-Loaded Echogenic Liposomes for Nitric Oxide Delivery and Inhibition of Intimal Hyperplasia. J Am Coll Cardiol. 2009;54(7):652–9. doi: 10.1016/j.jacc.2009.04.039. [DOI] [PMC free article] [PubMed] [Google Scholar]
- Kabalnov A, Klein D, Pelura T, Schutt E, Weers J. Dissolution of multicomponent microbubbles in the bloodstream: 1. Theory. Ultrasound in Medicine and Biology. 1998;24(5):739–49. doi: 10.1016/s0301-5629(98)00034-9. [DOI] [PubMed] [Google Scholar]
- Kalantarinia K, Belcik JT, Patrie JT, Wei K. Real-time measurement of renal blood flow in healthy subjects using contrast-enhanced ultrasound. American Journal of Physiology-Renal Physiology. 2009;297(4):F1129–34. doi: 10.1152/ajprenal.00172.2009. [DOI] [PMC free article] [PubMed] [Google Scholar]
- Kamiyama N, Moriyasu F, Mine Y, Goto Y. Analysis of flash echo from contrast agent for designing optimal ultrasound diagnostic systems. Ultrasound Med Biol. 1999;25(3):411–20. doi: 10.1016/s0301-5629(98)00182-3. [DOI] [PubMed] [Google Scholar]
- Katiyar A, Sarkar K. Excitation threshold for subharmonic generation from contrast microbubbles. J Acoust Soc Am. 2011;130(5):3137–47. doi: 10.1121/1.3641455. [DOI] [PMC free article] [PubMed] [Google Scholar]
- King DA, O'Brien WD., Jr Comparison between maximum radial expansion of ultrasound contrast agents and experimental postexcitation signal results. J Acoust Soc Am. 2011;129(1):114. doi: 10.1121/1.3523339. [DOI] [PMC free article] [PubMed] [Google Scholar]
- Kopechek JA, Haworth KJ, Radhakrishnan K, Huang S, Klegerman ME, McPherson DD, Holland CK. The Impact of Bubbles on Measurement of Drug Release from Echogenic Liposomes. Ultrason Sonochem. 2012 doi: 10.1016/j.ultsonch.2012.12.005. [DOI] [PMC free article] [PubMed] [Google Scholar]
- Kopechek JA, Haworth KJ, Raymond JL, Douglas Mast T, Perrin SR, Jr, Klegerman ME, Huang S, Porter TM, McPherson DD, Holland CK. Acoustic characterization of echogenic liposomes: Frequency-dependent attenuation and backscatter. J Acoust Soc Am. 2011;130(5):3472–81. doi: 10.1121/1.3626124. [DOI] [PMC free article] [PubMed] [Google Scholar]
- Korosoglou G, et al. Noninvasive Detection of Macrophage-Rich Atherosclerotic Plaque in Hyperlipidemic Rabbits Using “Positive Contrast” Magnetic Resonance Imaging. J Am Coll Cardiol. 2008;52(6):483–91. doi: 10.1016/j.jacc.2008.03.063. [DOI] [PMC free article] [PubMed] [Google Scholar]
- Kwan JJ, Borden MA. Microbubble dissolution in a multigas environment. Langmuir. 2010;26(9):6542–8. doi: 10.1021/la904088p. [DOI] [PubMed] [Google Scholar]
- Laing ST, McPherson DD. Cardiovascular therapeutic uses of targeted ultrasound contrast agents. Cardiovasc Res. 2009;83(4):626–35. doi: 10.1093/cvr/cvp192. [DOI] [PMC free article] [PubMed] [Google Scholar]
- Laing ST, Moody M, Smulevitz B, Kim H, Kee P, Huang S, Holland CK, McPherson DD. Ultrasound-enhanced thrombolytic effect of tissue plasminogen activator-loaded echogenic liposomes in an in vivo rabbit aorta thrombus model-brief report. Arterioscler Thromb Vasc Biol. 2011;31(6):1357–9. doi: 10.1161/ATVBAHA.111.225938. [DOI] [PMC free article] [PubMed] [Google Scholar]
- Lindner JR. Microbubbles in medical imaging: current applications and future directions. Nature Reviews Drug Discovery. 2004;3(6):527–33. doi: 10.1038/nrd1417. [DOI] [PubMed] [Google Scholar]
- Lo AH, Kripfgans OD, Carson PL, Rothman ED, Fowlkes JB. Acoustic droplet vaporization threshold: Effects of pulse duration and contrast agent. IEEE Trans Ultrason Ferroelectr Freq Control. 2007;54(5):933–45. doi: 10.1109/tuffc.2007.339. [DOI] [PubMed] [Google Scholar]
- Macdonald C, Gomatam J, Sboros V, Pye S, Moran C, McDicken W. The Blake Threshold in Microbubble Dynamics. International Congresses on Acoustics. 2004:I–461. [Google Scholar]
- Marmottant P, Van Der Meer S, Emmer M, Versluis M, De Jong N, Hilgenfeldt S, Lohse D. A model for large amplitude oscillations of coated bubbles accounting for buckling and rupture. J Acoust Soc Am. 2005;118(6):3499–505. [Google Scholar]
- Masuo O, Terada T, Walker G, Tsuura M, Matsumoto H, Tohya K, Kimura M, Nakai K, Itakura T. Study of the patency of small arterial branches after stent placement with an experimental in vivo model. Am J Neuroradiol. 2002;23(4):706–10. [PMC free article] [PubMed] [Google Scholar]
- Mehier-Humbert S, Yan F, Frinking P, Schneider M, Guy RH, Bettinger T. Ultrasound-mediated gene delivery: Influence of contrast agent on transfection. Bioconjug Chem. 2007;18(3):652–62. doi: 10.1021/bc0602432. [DOI] [PubMed] [Google Scholar]
- Miller DL, Averkiou MA, Brayman AA, Everbach EC, Holland CK, Wible JH, Jr, Wu J. Bioeffects considerations for diagnostic ultrasound contrast agents. Journal of Ultrasound in Medicine. 2008;27(4):611–32. doi: 10.7863/jum.2008.27.4.611. [DOI] [PubMed] [Google Scholar]
- Miller DL, Dou C. Membrane damage thresholds for pulsed or continuous ultrasound in phagocytic cells loaded with contrast agent gas bodies. Ultrasound in Medicine and Biology. 2004;30(3):405–11. doi: 10.1016/j.ultrasmedbio.2003.11.013. [DOI] [PubMed] [Google Scholar]
- Pelberg RA, Wei K, Kamiyama N, Sklenar J, Bin J, Kaul S. Potential advantage of flash echocardiography for digital subtraction of B-mode images acquired during myocardial contrast echocardiography. Journal of the American Society of Echocardiography. 1999;12(2):85–93. doi: 10.1016/s0894-7317(99)70119-7. [DOI] [PubMed] [Google Scholar]
- Porter TM, Smith DAB, Holland CK. Acoustic techniques for assessing the optison destruction threshold. Journal of Ultrasound in Medicine. 2006;25(12):1519–29. doi: 10.7863/jum.2006.25.12.1519. [DOI] [PMC free article] [PubMed] [Google Scholar]
- Postema M, Marmottant P, Lancée CT, Hilgenfeldt S, Jong ND. Ultrasound-induced microbubble coalescence. Ultrasound in Medicine and Biology. 2004;30(10):1337–44. doi: 10.1016/j.ultrasmedbio.2004.08.008. [DOI] [PubMed] [Google Scholar]
- Prosperetti A, Lezzi A. Bubble dynamics in a compressible liquid. Part 1. First-order theory. J FLUID MECH. 1986;1986(168):457–78. [Google Scholar]
- Qin S, Caskey CF, Ferrara KW. Ultrasound contrast microbubbles in imaging and therapy: Physical principles and engineering. Phys Med Biol. 2009;54(6):R27–57. doi: 10.1088/0031-9155/54/6/R01. [DOI] [PMC free article] [PubMed] [Google Scholar]
- Radhakrishnan K, Haworth KJ, Huang S, Klegerman ME, McPherson DD, Holland CK. Stability of Echogenic Liposomes as a Blood Pool Ultrasound Contrast Agent in a Physiologic Flow Phantom. Ultrasound in Medicine and Biology. 2012;38(11):1970–81. doi: 10.1016/j.ultrasmedbio.2012.06.012. [DOI] [PMC free article] [PubMed] [Google Scholar]
- Roy RA, Madanshetty SI, Apfel RE. An acoustic backscattering technique for the detection of transient cavitation produced by microsecond pulses of ultrasound. J Acoust Soc Am. 1990;87:2451. doi: 10.1121/1.399091. [DOI] [PubMed] [Google Scholar]
- Samuel S, Cooper MA, Bull JL, Fowlkes JB, Miller DL. An ex vivo Study of the Correlation Between Acoustic Emission and Microvascular Damage. Ultrasound in Medicine and Biology. 2009;35(9):1574–86. doi: 10.1016/j.ultrasmedbio.2009.04.013. [DOI] [PMC free article] [PubMed] [Google Scholar]
- Santin MD, King DA, Foiret J, Haak A, O'Brien WD, Jr, Bridal SL. Encapsulated contrast microbubble radial oscillation associated with postexcitation pressure peaks. J Acoust Soc Am. 2010;127(2):1156–64. doi: 10.1121/1.3277216. [DOI] [PMC free article] [PubMed] [Google Scholar]
- Sarkar K, Katiyar A, Jain P. Growth and Dissolution of an Encapsulated Contrast Microbubble: Effects of Encapsulation Permeability. Ultrasound in Medicine and Biology. 2009;35(8):1385–96. doi: 10.1016/j.ultrasmedbio.2009.04.010. [DOI] [PMC free article] [PubMed] [Google Scholar]
- Sboros V. Response of contrast agents to ultrasound. Adv Drug Deliv Rev. 2008;60(10):1117–36. doi: 10.1016/j.addr.2008.03.011. [DOI] [PubMed] [Google Scholar]
- Skyba DM, Price RJ, Linka AZ, Skalak TC, Kaul S. Direct in vivo visualization of intravascular destruction of microbubbles by ultrasound and its local effects on tissue. Circulation. 1998;98:290. doi: 10.1161/01.cir.98.4.290. [DOI] [PubMed] [Google Scholar]
- Smith DAB, Porter TM, Martinez J, Huang S, MacDonald RC, McPherson DD, Holland CK. Destruction Thresholds of Echogenic Liposomes with Clinical Diagnostic Ultrasound. Ultrasound in Medicine and Biology. 2007;33(5):797–809. doi: 10.1016/j.ultrasmedbio.2006.11.017. [DOI] [PubMed] [Google Scholar]
- Song S, Shen Z, Chen L, Brayman AA, Miao CH. Explorations of high-intensity therapeutic ultrasound and microbubble-mediated gene delivery in mouse liver. Gene Ther. 2011;18(10):1006–14. doi: 10.1038/gt.2011.34. [DOI] [PMC free article] [PubMed] [Google Scholar]
- Sridharan A, Eisenbrey JR, MacHado P, Demuinck ED, Doyley MM, Forsberg F. Delineation of atherosclerotic plaque using subharmonic imaging filtering techniques and a commercial intravascular ultrasound system. Ultrason Imaging. 2013;35(1):30–44. doi: 10.1177/0161734612469511. [DOI] [PMC free article] [PubMed] [Google Scholar]
- Stride E, Coussios C. Cavitation and contrast: the use of bubbles in ultrasound imaging and therapy. Proc Inst Mech Eng Part H J Eng Med. 2010;224(2):171–91. doi: 10.1243/09544119JEIM622. [DOI] [PubMed] [Google Scholar]
- Stride E, Saffari N. Microbubble ultrasound contrast agents: A review. Proc Inst Mech Eng Part H J Eng Med. 2003;217(6):429–47. doi: 10.1243/09544110360729072. [DOI] [PubMed] [Google Scholar]
- Sutton JT, Haworth KJ, Pyne-Geithman G, Holland CK. Ultrasound-mediated drug delivery for cardiovascular disease. Expert Opinion on Drug Delivery. 2013;0:1–20. doi: 10.1517/17425247.2013.772578. [DOI] [PMC free article] [PubMed] [Google Scholar]
- Leighton TG. The Acoustic Bubble. Academic Pr; 1997. [Google Scholar]
- Tiemann K, Pohl C, Schlosser T, Goenechea J, Bruce M, Veltmann C, Kuntz S, Bangard M, Becher H. Stimulated acoustic emission: Pseudo-Doppler shifts seen during the destruction of nonmoving microbubbles. Ultrasound in Medicine and Biology. 2000;26(7):1161–7. doi: 10.1016/s0301-5629(00)00261-1. [DOI] [PubMed] [Google Scholar]
- Tiukinhoy-Laing SD, Buchanan K, Parikh D, Huang S, Macdonald RC, Mcpherson DD, Klegerman ME. Fibrin targeting of tissue plasminogen activator-loaded echogenic liposomes. J Drug Target. 2007;15(2):109–14. doi: 10.1080/10611860601140673. [DOI] [PubMed] [Google Scholar]
- Tortoli P, Boni E, Corsi M, Arditi M, Frinking P. Different effects of microbubble destruction and translation in Doppler measurements. Ultrasonics, Ferroelectrics and Frequency Control, IEEE Transactions on. 2005;52(7):1183–8. doi: 10.1109/tuffc.2005.1504005. [DOI] [PubMed] [Google Scholar]
- Tung Y, Choi JJ, Baseri B, Konofagou EE. Identifying the inertial cavitation threshold and skull effects in a vessel phantom using focused ultrasound and microbubbles. Ultrasound in Medicine and Biology. 2010;36(5):840–52. doi: 10.1016/j.ultrasmedbio.2010.02.009. [DOI] [PMC free article] [PubMed] [Google Scholar]
- Uhlendorf Vand, Hoffmann C. Nonlinear acoustical response of coated microbubbles in diagnostic ultrasound. Proceedings of the IEEE Ultrasonics Symposium. 1994:1559–62. [Google Scholar]
- Uhlendorf V, Scholle F, Reinhardt M. Acoustic behaviour of current ultrasound contrast agents. Ultrasonics. 2000;38(1):81–6. doi: 10.1016/s0041-624x(99)00128-6. [DOI] [PubMed] [Google Scholar]
- Vykhodtseva NI, Hynynen K, Damianou C. Histologic effects of high intensity pulsed ultrasound exposure with subharmonic emission in rabbit brain in vivo. Ultrasound in Medicine and Biology. 1995;21(7):969–79. doi: 10.1016/0301-5629(95)00038-s. [DOI] [PubMed] [Google Scholar]
- Wei K, Jayaweera AR, Firoozan S, Linka A, Skyba DM, Kaul S. Quantification of myocardial blood flow with ultrasound-induced destruction of microbubbles administered as a constant venous infusion. Circulation. 1998;97(5):473–83. doi: 10.1161/01.cir.97.5.473. [DOI] [PubMed] [Google Scholar]
- Weidinger F, Frick M, Alber HF, Ulmer H, Schwarzacher SP, Pachinger O. Association of wall thickness of the brachial artery measured with high-resolution ultrasound with risk factors and coronary artery disease. Am J Cardiol. 2002;89(9):1025–9. doi: 10.1016/s0002-9149(02)02269-5. [DOI] [PubMed] [Google Scholar]
- Yeh C, Su S. Effects of Acoustic Insonation Parameters on Ultrasound Contrast Agent Destruction. Ultrasound in Medicine and Biology. 2008;34(8):1281–91. doi: 10.1016/j.ultrasmedbio.2007.12.020. [DOI] [PubMed] [Google Scholar]