

Abstract
Few studies have examined both the relative magnitude of association and the discriminative capability of multiple indicators of obesity with cardiovascular disease (CVD) mortality risk. We conducted an individual-participant meta-analysis of 9 cohort studies of men and women drawn from the British general population resulted in sample of 82,864 individuals. Body mass index (BMI), waist circumference (WC), and waist-to-hip ratio (WHR) were measured directly. There were 6,641 deaths (1,998 CVD) during a mean of 8.1 years of follow-up. After adjustment, a one SD higher in WHR and WC was related to a higher risk of CVD mortality (HR (95% CI)): 1.15 (1.05-1.25) and 1.15 (1.04-1.27), respectively. The risk of CVD also increased linearly across quintiles of both these abdominal obesity markers with a 66% increased risk in the highest quintile of WHR. In age- and sex-adjusted models only, BMI was related to CVD mortality but not in any other analyses. No major differences were revealed in the discrimination capabilities of models with BMI, WC or WHR for cardiovascular or total mortality outcomes. In conclusion, measures of abdominal adiposity, but not BMI, were related to an increased risk of cardiovascular disease mortality. No difference was observed in discrimination capacities between adiposity markers.
Keywords: body mass index, waist circumference, waist-to-hip ratio, cardiovascular disease mortality
Introduction
There has been a well documented increase in the prevalence of overweight and obesity in developing and developed countries, with over one billion adults worldwide meeting current definitions for excess weight(1). The role of overweight and obesity in the aetiology of cardiovascular disease (CVD) risk has a long research tradition(2). Using body mass index (BMI, kg/m2) as a marker of excess body fat accumulation, studies have revealed null, linear, J- or U-shaped relationships with mortality risk(3-5).
BMI comprises a combination of both fat mass and fat free mass which have opposing effects on health(6). Hence, more recently, investigators have examined the predictive significance of abdominal adiposity markers, such as waist circumference (WC) and waist-hip ratio (WHR), for CVD risk. Based on the few studies conducted, there is a suggestion that the adiposity-CVD association is strongest for WHR followed by WC then BMI(7-12).
However, a number of outstanding issues remain. First, it is unclear if the impact of each indicator of adiposity on CVD mortality is independent of the effects of potential mediating factors, such as blood cholesterol, diabetes, and blood pressure. Second, beyond comparison of areas under the curves - an insensitive approach - no prospective study has, to our knowledge, assessed the difference in discriminative capability of these adiposity markers for CVD mortality. Recent statistical techniques, such as the relative integrated discrimination improvement (RIDI %) statistic, potentially represent a major advance in assessing differences in the performance of predictive models but have yet to be well utilised in this area(13;14). The aim of the present study is examine these two outstanding research questions on all-cause and CVD mortality, using a pooled analysis of a series of 9 cohort studies of men and women drawn from the British general population.
Methods
Participants were drawn from 9 cross-sectional UK surveys comprising of the Scottish Health Surveys (SHS, 3 cohorts) and the Health Survey for England (HSE, 6 cohorts). Sampling individuals living in households in each country, all studies are representative of the general population. The characteristics of the individual cohorts are presented in table 1. The mean age at baseline ranged between 49 and 57 years, with women marginally comprising the majority of study members (range: 54-62%). Study participants gave full informed consent and ethical approval was obtained from the London Research Ethics Council or the Local Research Ethics Councils.
Table 1. Characteristics of each study contributing to present individual-participant meta-analysis.
| Cohort | Year of survey | Total participants, n | Included study members , % | Characteristics of included study members |
|||
|---|---|---|---|---|---|---|---|
| women, n | Age, y * | Total death, n | CVD death, n | ||||
| HSE | 1994 | 10599 | 81.7 | 4667 | 55.4 (14.0) | 1854 | 375 |
| HSE | 1997 | 5875 | 79.4 | 2474 | 54.7 (13.3) | 651 | 204 |
| HSE | 1998 | 11058 | 76.7 | 4589 | 55.2 (13.7) | 1090 | 381 |
| HSE | 2001 | 11283 | 68.1 | 4119 | 54.9 (13.3) | 503 | 177 |
| HSE | 2002 | 5399 | 68.7 | 2055 | 54.7 (13.7) | 199 | 81 |
| HSE | 2003 | 10887 | 66.3 | 3905 | 55.2 (13.3) | 286 | 104 |
| SHS | 1995 | 4525 | 73.0 | 1804 | 49.3 (8.9) | 444 | 124 |
| SHS | 1998 | 11636 | 66.4 | 4260 | 50.1 (11.6) | 1196 | 388 |
| SHS | 2003 | 11602 | 50.9 | 3226 | 57.2 (13.4) | 418 | 164 |
HSE: Health Survey for England; SHS: Scottish Health Survey;
mean±SD
“Included study members” are those who consented to follow-up and had data on body mass index, BMI; waist circumference, WC and waist-to-hip ratio, WHR.
The full protocols for the HSE and SHS data collection have been described in detail elsewhere(15;16). In brief, study members were visited twice in their homes. During the first visit, trained interviewers collected data on demographics and health behaviours, including socioeconomic status (as indexed by occupational social class), self-reported smoking, and physical activity. During the second visit, conducted within a few days of the first, nurses gathered clinical data. In the seated position and after five minutes rest, systolic and diastolic blood pressure was measured on three occasions using an Omron HEM-907; an average of the second and third readings was used in the present analyses. Nurses also collected information about physician-diagnosed CVD (stroke, ischemic heart disease, angina symptoms), other medical conditions (hypertension and diabetes), and blood-pressure lowering medication (beta-blockers, angiotensin converting enzyme-inhibitors, diuretics, calcium blockers).
Height and weight were measured directly by the interviewers using Chasmors stadiometers (Chasmors Ltd., London, UK) and Tanita electronic digital scales (Tanita Incorporation, Japan), respectively. Body mass index (BMI) was calculated using the usual formulae (weight [kg]/height[m]2). Waist and hip circumferences were measured using a tape with an insertion buckle at one end. Waist circumference was measured at the midpoint between the lower rib and the upper margin of the iliac crest. Hip circumference was denoted by the widest circumference around the buttocks, below the iliac crest. Both measurements were taken twice, using the same tape, and were recorded to the nearest even millimetre. Those whose two waist or hip measurements differed by more than 3 cm had a third measurement taken. The mean of the two valid measurements was used in our analysis. For waist and hip measurements all those who reported that they had a colostomy or ileostomy, or were chairbound or pregnant, were excluded from the measurement. All those with measurements considered invalid by the nurse, for example due to refusals to remove excessive clothing or movement, were excluded from the analysis.
Ascertainment of disease-specific mortality
Consenting study members (73,219, 88%) were linked to National Health Service mortality records from which a death certificate was located. Classification of the underlying cause of death was based on information on the death certificate together with any additional observations made by the certifying physician. Diagnoses for primary cause of death was made using the ninth and tenth revisions of the International Classification of Diseases with 390-459 (ICD-9) and IO01-I99 (ICD-10) denoting cardiovascular disease deaths.
Statistical analysis
Cox proportional hazard regression models were used to estimate the hazard ratio (HR) and accompanying 95% confidence intervals (95% CIs) for a one standard deviation (SD) higher in each anthropometric index in relation to the risk of total and CVD mortality. Cox models were used to compute the HRs for the participants in the upper quintiles as compared to those in the lower quintiles of each anthropometric variable. Corresponding 95% CIs were calculated by the floating absolute risk method(17), in order to provide a CI for the reference group, chosen here as lowest level of each anthropometric variable. Log-linearity of the associations between each anthropometric variable was explored both by fitting the fifths of each anthropometric variable and by fitting a continuous predictor that takes the value of each fifth for each participant within that fifth. The likelihood ratio chi square from the model with the continuous predictor and its difference from that of the model with fifths of each variable were then used to characterise the linearity and non-linearity of the association respectively. Baseline models were adjusted for age and sex, followed by socio-economic status, cigarette smoking, systolic blood pressure, total blood cholesterol, diabetes status, physical activity and history of CVD. In preliminary analyses based on individual studies, the relationship between each of the three adiposity indicators and mortality were in the same direction. There was also no strong evidence for effect modification by gender. We therefore pooled the data, stratified by cohort and adjusted for gender and other covariates.
The ability of anthropometric variables to discriminate between participants who developed an event during follow-up and those who did not was assessed using area under the receiver operating characteristic curves (AUC) and the relative integrated discrimination improvement (RIDI), which measures the percentage increased discrimination when an extra variable is added to a prediction model(13;18). RIDI indicates the magnitude of improvement in the performance of a model that is attributable to adding a further variable, as compared with to the average of predictors already present in the model. RIDI is a continuous variable that can take both positive and negative values. No improvement is indicated by a value of zero. AUC comparisons were examined with nonparametric methods(19). Bootstrap techniques were used to derive the 95% CI for the RIDI estimates which were based on 1000 replications. The likelihood ratio χ2 statistics for each event category were calculated by comparing multivariate regression models with and without a single anthropometric variable to assess improvement in model fit. Additional analyses were conducted to ascertain the combination of anthropometric variables (BMI+WC or BMI+WHR) and BMI2, WC2 or WHR2 in the Cox models. All analyses used SAS software v.9.2 (SAS Institute Inc., Cary, NC, USA).
Results
Selection of the analytical sample and characteristics of each study contributing to the present meta-analysis are presented in Table 1 and Figure 1. A comparison was made of the baseline characteristics of men and women included in the present analytical sample versus those excluded (Table 2). As a result of missing data and lack of consent for mortality follow-up, around a quarter of the starting sample was excluded. Owing to the large sample size, the differences between these two groups attained statistical significance at conventional levels for all of the listed variables, however, importantly, the absolute differences were very small and not in a consistent direction.
Figure 1. Derivation of the analytic sample.

HSE: Health Survey for England, SHS: Scottish Health Survey
Table 2. Baseline characteristics of participants according to inclusion in the present analysis.
| Included study members | Excluded study members | ||||
|---|---|---|---|---|---|
|
| |||||
| Variables | N | Mean (SD) | N | Mean (SD) | P value for difference |
| N | 57356 | 25508 | |||
| Age (years) | 57356 | 54.8 (13.2) | 25508 | 56.3 (14.8) | <0.0001 |
| Men (%) | 57356 | 45.8 | 25508 | 42.1 | <0.0001 |
| Systolic blood pressure (mmHg) | 55831 | 136.0 (20.1) | 10690 | 136.2 (20.3) | 0.27 |
| Total cholesterol (mg/dl) | 32772 | 5.9 (1.2) | 6319 | 5.8 (1.2) | <0.0001 |
| HDL-cholesterol (mg/dl) | 22316 | 1.49 (0.42) | 5211 | 1.48 (0.41) | 0.37 |
| BMI (kg/m2) | 57356 | 27.3 (4.8) | 49840 | 27.4 (5.1) | 0.0001 |
| WC (cm) | 57356 | 91.3 (13.2) | 49840 | 92.3 (14.4) | 0.007 |
| WHR | 57356 | 0.87 (0.09) | 10153 | 0.87 (0.09) | 0.003 |
| History of CVD* | 41285 | 4219 (10.2) | 19007 | 2010 (10.6) | 0.18 |
| History of diabetes* | 41283 | 1650 (4) | 19008 | 1040 (4.6) | 0.0009 |
| History of hypertension* | 41127 | 10608 (25.8) | 18942 | 5101 (26.9) | 0.003 |
| Smoking* | 57251 | 13972 (24.4) | 25347 | 6445 (25.4) | 0.002 |
BMI, body mass index; WC, waist circumference; WHR, waist to hip ratio; CVD, cardiovascular disease.
Results are N ( %)
“Included study members” were study members who gave consent for follow-up and had full data for BMI, WC and WHR.
“Excluded study members” were study members who did not give consent for follow-up or who had missing data for BMI, or WC or WHR.
A mean of 98.7 months of mortality surveillance gave rise to 6641 deaths, 1998 of which were ascribed to CVD. As anticipated, established risk factors for CVD were also predictive in the present pooled analyses (Table 3). Thus, CVD mortality risk was elevated in study members who were male, had increased age and systolic blood pressure, lower HDL cholesterol, had a history of diabetes or CVD and who were smokers. The magnitude of these relationships with total mortality was typically lower.
Table 3. Hazard ratios (95% confidence intervals) for the association between conventional risk factors and mortality outcomes.
| All death | CVD death | |
|---|---|---|
| Age (per one SD increase) | 3.84 (3.72-3.95) | 4.79 (4.52-5.08) |
| Sex (women vs. men) | 0.64 (0.61-0.67) | 0.56 (0.52-0.62) |
| Systolic blood pressure (per one SD increase) | 1.03 (1.01-1.06) | 1.09 (1.04-1.14) |
| History of diabetes (yes vs. no) | 1.79 (1.62-1.97) | 2.27 (1.94 −2.66) |
| Total cholesterol (per one SD increase) | 0.92 (0.89-0.95) | 0.99 (0.93-1.05) |
| HDL-cholesterol (per one SD increase) | 0.94 (0.90-0.99) | 0.77 (0.71-0.84) |
| History of cardiovascular disease (yes vs. no) | 1.65 (1.55-1.76) | 2.44 (2.20-2.72) |
| Smoking (yes vs. no) | 2.17 (2.06-2.30) | 2.14 (1.93-2.37) |
| Socioeconomic status (Non-manual occupation [high] vs. manual [low]) | 0.54 (0.47-0.62) | 0.39 (0.29-0.52) |
Hazard ratios are adjusted for age, sex and cohort except age (sex and cohort adjusted) and sex (age and cohort adjusted). CVD, cardiovascular disease
Figures 2 (age- and sex-adjusted analyses) and Figures 3 (fully-adjusted analyses) depict the association of the three indicators of adiposity with total (figures in upper row) and CVD mortality (figures in lower row). While a higher BMI appeared to confer protection against total mortality [HRs (95% CI) for a one higher SD in BMI: 0.95 (0.91-0.99)] in a fully-adjusted model (Figure 3), it was not related to CVD death. However, the markers of visceral obesity were consistently positively associated with the risk of total and CVD mortality. A higher magnitude of association was generally observed for WHR than for WC. For example, in age- and sex-adjusted analyses, the risks for CVD mortality was 1.35 (1.27-1.43) and 1.24 (1.18-1.30) for each higher SD in WHR and WC, respectively (Figure 2). For fifths of each adiposity variable, a ‘J’-shaped curve was evident for BMI and CVD mortality. On comparing the top fifth with the bottom one, again, WHR was most strongly associated with total and CVD mortality. Sensitivity analyses excluding study members with a CVD event recorded during the first three years of follow-up did not materially alter these results (data not shown but available upon request).
Figure 2. Age and sex-adjusted associations between anthropometric variables and mortality Upper row of figures is for all-cause mortality, lower for CVD mortality.
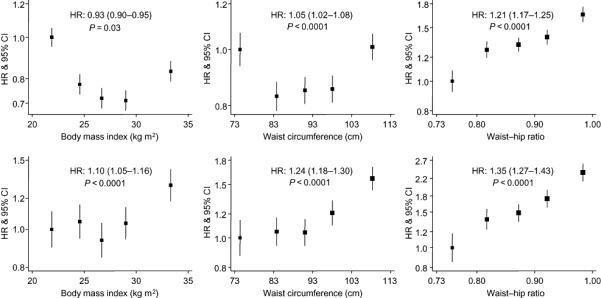
For the association between each anthropometric variable and the outcome of interest, boxes are for the effect estimate (hazard ratio) and the vertical bars about are for the 95% confidence interval (CI). On the horizontal axis, the hazard ratio for each quintile is plotted against the quintile specific median of the anthropometric variable. For each figure, the hazard ratio (HR) and the 95% CI for a standard deviation for a one higher standard deviation in each anthropometric variables are shown. The p-value is for the log-linearity of the association. The vertical axis is on log scale to allow equal distribution of the CI about the estimates.
Figure 3. Multivariable adjusted associations between anthropometric variables and mortality.

Conventions are as per figure 2. Covariates in the models are age, sex, cohorts, diabetes status, systolic blood pressure, history of CVD, social class, physical activity, smoking status, total cholesterol
As presented in Table 4, we examined the predictive value of anthropometric variables for these outcomes by calculating the area under the receiver operating characteristic curves (AUC). There was no major difference in AUCs between the three anthropometric variables, nor when comparing combinations of variables or testing for BMI2, WC2 or even WHR2 (data not shown). Using the RIDI statistics (Table 5), a significant but marginal increase (< 1%) in discrimination capacity was observed when baseline WHR was substituted for body mass index. These results indicate a very modest enhancement in the discriminative capability of the models using WHR instead of BMI. The advantage of using WHR instead of WC was also marginal. Models combining two anthropometric variables such as BMI and WC, or BMI and WHR, did not provide improvements in the prediction of mortality.
Table 4. Area under the receiver operating characteristic curves (95% confidence intervals) for the prediction of total and cardiovascular disease mortality.
| Model | Total death | CVD death |
|---|---|---|
| BMI (A) | 0.847 (0.840-0.855) | 0.868 (0.856-0.880) |
| WC (B) | 0.847 (0.839-0.855) | 0.868 (0.856-0.880) |
| WHR (C) | 0.848 (0.840-0.856) | 0.868 (0.856-0.880) |
| P for the difference in AUC | ||
| A-B | 0.03 | 0.86 |
| A-C | 0.22 | 0.80 |
| B-C | <0.0001 | 0.68 |
BMI, body mass index; WC, waist circumference; WHR, waist to hip ratio; CVD, cardiovascular disease.
Multivariate models are adjusted for: cohorts, age, sex, diabetes status, systolic blood pressure, history of CVD, social class, physical activity, smoking status and total cholesterol
Table 5. Relative integrated discrimination improvement statistics (RIDI, 95% confidence intervals) comparing models with a given anthropometric variable with models for which the variable has been replaced by another anthropometric variable.
| Model 1 | Model 2 | All death | CVD death |
|---|---|---|---|
| BMI | WC | 0.150 (0.140-0.160) | 0.543 (0.524-0.563) |
| BMI | WHR | 0.335 (0.321-0.348) | 0.265 (0.236-0.295) |
| WC | WHR | 0.184 (0.175-0.193) | −0.276 (−0.302 to −0.250) |
BMI, body mass index; WC, waist circumference; WHR, waist to hip ratio; CVD, cardiovascular disease.
Multivariate models are adjusted for: cohorts, age, sex, diabetes status, systolic blood pressure, history of CVD, social class, physical activity, smoking status and total cholesterol
Discussion
The aims of this study were two-fold: first, to examine if the association of each indicator of adiposity with CVD mortality was independent of potential mediating factors such as blood cholesterol, diabetes, and blood pressure. Second, to evaluate the difference in discriminative capability of BMI, WC and WHR for CVD mortality.
In this large, well characterised individual-participant meta-analysis of 9 cohorts we found that measures of central adiposity were associated with an increased risk of cardiovascular disease mortality. In a fully-adjusted model, taking into account potential mediating variables such as systolic blood pressure and diabetes status, the effects were not statistically significant at conventional levels for BMI. This suggests that some, if not all, of the impact of BMI on CVD risk occurs via these variables. In all models, WHR showed the strongest association with CVD mortality compared to either WC or even BMI. The present dataset also confirmed the expected associations for a range of established CVD risk factors that strengthen the validity of our findings. Overall comparison of the discrimination capacity of the three adiposity indices revealed no difference using the AUC and a marginal benefit when using the relative integrated discrimination improvement (RIDI) statistics.
Study strengths and limitations
The present study has a number of strengths, including direct measurement of anthropometric markers, the range of covariates available, and our use of recently developed discriminative statistical techniques. Indeed, the AUC has been the most frequently used tool to discriminate between competing models. However, some limitations of the AUC have been suggested and more recently, the RIDI statistic has been proposed for assessing differences in the performance of predictive models. These differences in statistical techniques may explain discrepancies between study results as we previously observed when comparing blood pressure variables in individuals with type 2 diabetes(18). However, in the current report, the benefit of the RIDI did not provide competing results compared to AUCs. Some limitations also need to be mentioned. Our cohorts, while representative of the people living in Scotland and England, were not sufficiently ethnically diverse to facilitate extrapolation to all ethnic groups. It is also the case that, as described, a series of covariates were measured, but there were insufficient blood analytics for inclusion in the present analyses. Excluded participants tended to have less favourable risk factor profiles than those included, which is often the case in large population based studies. Our results may therefore have underestimated the true risks associated with adiposity.
Comparison with previous studies
The links between obesity and all-cause or cardiovascular disease mortality has been debated in the last two decades with an advisory committee from the American Heart Association recently summarized the findings(20). Methodological issues explain the apparent opposing directions of association observed between BMI and mortality across studies. Among the potential sources of bias is the inability to take into account pre-existing diseases such as smoking-related cancers (reverse causality) that may partially explain the U- or J-shaped relationship between BMI and mortality. Previous meta-analyses investigating the association with BMI and mortality concluded that removing early death occurring during follow-up or taking into account pre-existing disease was not sufficient to modify the shape of the association between body mass index and mortality(5;21). This was also observed in our analyses.
In age- and sex-adjusted models, we observed that when using either a continuous or categorical coding, BMI was related to CVD mortality. This was not evident after adjustment for intermediary variables in the fully-adjusted models. For both levels of adjustment, the associations followed a ‘U’- or ‘J’-shaped curve. Such an observation was also described in a recent pooled analysis of over one million white adults (1). Thus, in the total population, BMI followed a ‘J’-shaped relationship that did not attain statistical significance with all cause mortality until a BMI of > 30 kg/m2, especially in men. When restricting the analyses to healthy subjects who never smoked, the ‘J’-shaped remained but significant associations were also seen at lower levels of BMI > 25 kg/m2. This large new study emphasizes the importance of taking into account prevalent illness (reverse causality) but also the role of smoking. Another potential hypothesis for the non-linear association is that BMI does not take into account for the potentially different role for fat mass and fat-free mass. For example, findings from the Paris Prospective Study(2) supported the differential impact of body compartments on mortality. Intra-abdominal fat was related to cardiovascular disease mortality, whereas lower muscle mass and lower subcutaneous fat increased cancer mortality, independently of smoking. Fat distribution may explain the differential associations observed for CVD with BMI on the one hand, and with central adiposity markers (WHR or WC) on the other side. As such, an increased WHR/WC may reflect a larger intra-abdominal fat mass or a decreased gluteo-femoral muscle mass - two body compartments that are not well captured by using BMI alone.
Conclusions
In this individual-participant data meta-analysis of 82,864 individuals from 9 nationwide British cohorts, we found that greater WC and WHR were associated with an increased risk for CVD and all-cause mortality, with WHR showing the highest magnitude of association. In multivariate models, global adiposity assessed by BMI was not associated with CVD risk and was inversely related to all-cause mortality risk. No clinically relevant difference in discrimination capabilities was observed between these three adiposity variables.
Supplementary Material
Supplementary table 1. Fully-adjusted hazard ratios and 95% confidence intervals (95% CI) for major cardiovascular outcomes per standard deviation increment in anthropometric variables in participants without prior history of cardiovascular disease at baseline
Acknowledgments
We would like to thank the Health Survey for England and Scottish Health survey respondents for offering their valuable time and the Information Services Division Scotland team for their outstanding Scottish Health Survey data provision and data updating services.
Source of funding: MH is supported by the British Heart Foundation (RG 05/006), ES by the National Institute for Health Research (English Department of Health/National Health Service), and David Batty by a Wellcome Trust Career Development Fellow (WBS U.1300.00.006.00012.01). The Medical Research Council (MRC) Social and Public Health Sciences Unit receives funding from the UK MRC and the Chief Scientist Office at the Scottish Government Health Directorates.
Footnotes
Disclosures: none.
REFERENCES
- 1.Haslam DW, James WP. Obesity. Lancet. 2005;366:1197–209. doi: 10.1016/S0140-6736(05)67483-1. [DOI] [PubMed] [Google Scholar]
- 2.Larsson B, Svardsudd K, Welin L, Wilhelmsen L, Bjorntorp P, Tibblin G. Abdominal adipose tissue distribution, obesity, and risk of cardiovascular disease and death: 13 year follow up of participants in the study of men born in 1913. Br Med J (Clin Res Ed) 1984;288:1401–4. doi: 10.1136/bmj.288.6428.1401. [DOI] [PMC free article] [PubMed] [Google Scholar]
- 3.Wilcosky T, Hyde J, Anderson JJ, Bangdiwala S, Duncan B. Obesity and mortality in the Lipid Research Clinics Program Follow-up Study. J Clin Epidemiol. 1990;43:743–52. doi: 10.1016/0895-4356(90)90232-e. [DOI] [PubMed] [Google Scholar]
- 4.McGee DL. Body mass index and mortality: a meta-analysis based on person-level data from twenty-six observational studies. Ann Epidemiol. 2005;15:87–97. doi: 10.1016/j.annepidem.2004.05.012. [DOI] [PubMed] [Google Scholar]
- 5.Whitlock G, Lewington S, Sherliker P, Clarke R, Emberson J, Halsey J, Qizilbash N, Collins R, Peto R. Body-mass index and cause-specific mortality in 900 000 adults: collaborative analyses of 57 prospective studies. Lancet. 2009;373:1083–96. doi: 10.1016/S0140-6736(09)60318-4. [DOI] [PMC free article] [PubMed] [Google Scholar]
- 6.Oppert JM, Charles MA, Thibult N, Guy-Grand B, Eschwege E, Ducimetiére P. Anthropometric estimates of muscle and fat mass in relation to cardiac and cancer mortality in men: the Paris Prospective Study. Am J Clin Nutr. 2002;75:1107–13. doi: 10.1093/ajcn/75.6.1107. [DOI] [PubMed] [Google Scholar]
- 7.Yusuf S, Hawken S, Ounpuu S, Bautista L, Franzosi MG, Commerford P, Lang CC, Rumboldt Z, Onen CL, Lisheng L, Tanomsup S, Wangai P, Jr., Razak F, Sharma AM, Anand SS. Obesity and the risk of myocardial infarction in 27,000 participants from 52 countries: a case-control study. Lancet. 2005;366:1640–9. doi: 10.1016/S0140-6736(05)67663-5. [DOI] [PubMed] [Google Scholar]
- 8.de Koning L, Merchant AT, Pogue J, Anand SS. Waist circumference and waist-to-hip ratio as predictors of cardiovascular events: meta-regression analysis of prospective studies. Eur Heart J. 2007;28:850–6. doi: 10.1093/eurheartj/ehm026. [DOI] [PubMed] [Google Scholar]
- 9.Pischon T, Boeing H, Hoffmann K, Bergmann M, Schulze MB, Overvad K, van der Schouw YT, Spencer E, Moons KG, Tjonneland A, Halkjaer J, Jensen MK, Stegger J, Clavel-Chapelon F, Boutron-Ruault MC, Chajes V, Linseisen J, Kaaks R, Trichopoulou A, Trichopoulos D, Bamia C, Sieri S, Palli D, Tumino R, Vineis P, Panico S, Peeters PH, May AM, Bueno-de-Mesquita HB, van Duijnhoven FJ, Hallmans G, Weinehall L, Manjer J, Hedblad B, Lund E, Agudo A, Arriola L, Barricarte A, Navarro C, Martinez C, Quiros JR, Key T, Bingham S, Khaw KT, Boffetta P, Jenab M, Ferrari P, Riboli E. General and abdominal adiposity and risk of death in Europe. N Engl J Med. 2008;359:2105–20. doi: 10.1056/NEJMoa0801891. [DOI] [PubMed] [Google Scholar]
- 10.van D I, Kromhout D, Geleijnse JM, Boer JM, Verschuren WM. Body mass index and waist circumference predict both 10-year nonfatal and fatal cardiovascular disease risk: study conducted in 20,000 Dutch men and women aged 20-65 years. Eur J Cardiovasc Prev Rehabil. 2009;16:729–34. doi: 10.1097/HJR.0b013e328331dfc0. [DOI] [PubMed] [Google Scholar]
- 11.Taylor AE, Ebrahim S, Ben Shlomo Y, Martin RM, Whincup PH, Yarnell JW, Wannamethee SG, Lawlor DA. Comparison of the associations of body mass index and measures of central adiposity and fat mass with coronary heart disease, diabetes, and all-cause mortality: a study using data from 4 UK cohorts. Am J Clin Nutr. 2010;91:547–56. doi: 10.3945/ajcn.2009.28757. [DOI] [PubMed] [Google Scholar]
- 12.Zhang C, Rexrode KM, van Dam RM, Li TY, Hu FB. Abdominal obesity and the risk of all-cause, cardiovascular, and cancer mortality: sixteen years of follow-up in US women. Circulation. 2008;117:1658–67. doi: 10.1161/CIRCULATIONAHA.107.739714. [DOI] [PubMed] [Google Scholar]
- 13.Pencina MJ, D’Agostino RB, Sr., D’Agostino RB, Jr., Vasan RS. Evaluating the added predictive ability of a new marker: from area under the ROC curve to reclassification and beyond. Stat Med. 2008;27:157–72. doi: 10.1002/sim.2929. [DOI] [PubMed] [Google Scholar]
- 14.Cook NR, Ridker PM. Advances in measuring the effect of individual predictors of cardiovascular risk: the role of reclassification measures. Ann Intern Med. 2009;150:795–802. doi: 10.7326/0003-4819-150-11-200906020-00007. [DOI] [PMC free article] [PubMed] [Google Scholar]
- 15.Scottish Health Survey Publications [accessed November 2007];The Scottish Government Statistics. 2007 http://www scotland gov uk/Topics/Statistics/Browse/Health/scottish-health survey/Publications.
- 16.Joint Health Surveys Unit . Health Survey for England 1998. Cardiovascular Disease. Volume 2: Methodology and Documentation. The Stationery Office London; 1999. [Google Scholar]
- 17.Easton DF, Peto J, Babiker AG. Floating absolute risk: an alternative to relative risk in survival and case-control analysis avoiding an arbitrary reference group. Stat Med. 1991;10:1025–35. doi: 10.1002/sim.4780100703. [DOI] [PubMed] [Google Scholar]
- 18.Kengne AP, Czernichow S, Huxley R, Grobbee D, Woodward M, Neal B, Zoungas S, Cooper M, Glasziou P, Hamet P, Harrap SB, Mancia G, Poulter N, Williams B, Chalmers J. Blood Pressure Variables and Cardiovascular Risk. New Findings From ADVANCE. Hypertension. 2009;54:399–404. doi: 10.1161/HYPERTENSIONAHA.109.133041. [DOI] [PubMed] [Google Scholar]
- 19.DeLong ER, DeLong DM, Clarke-Pearson DL. Comparing the areas under two or more correlated receiver operating characteristic curves: a nonparametric approach. Biometrics. 1988;44:837–45. [PubMed] [Google Scholar]
- 20.Lewis CE, McTigue KM, Burke LE, Poirier P, Eckel RH, Howard BV, Allison DB, Kumanyika S, Pi-Sunyer FX. Mortality, health outcomes, and body mass index in the overweight range: a science advisory from the American Heart Association. Circulation. 2009;119:3263–71. doi: 10.1161/CIRCULATIONAHA.109.192574. [DOI] [PubMed] [Google Scholar]
- 21.Allison DB, Faith MS, Heo M, Townsend-Butterworth D, Williamson DF. Meta-analysis of the effect of excluding early deaths on the estimated relationship between body mass index and mortality. Obes Res. 1999;7:342–54. doi: 10.1002/j.1550-8528.1999.tb00417.x. [DOI] [PubMed] [Google Scholar]
- 22.Berrington dG, Hartge P, Cerhan JR, Flint AJ, Hannan L, MacInnis RJ, Moore SC, Tobias GS, Anton-Culver H, Freeman LB, Beeson WL, Clipp SL, English DR, Folsom AR, Freedman DM, Giles G, Hakansson N, Henderson KD, Hoffman-Bolton J, Hoppin JA, Koenig KL, Lee IM, Linet MS, Park Y, Pocobelli G, Schatzkin A, Sesso HD, Weiderpass E, Willcox BJ, Wolk A, Zeleniuch-Jacquotte A, Willett WC, Thun MJ. Body-mass index and mortality among 1.46 million white adults. N Engl J Med. 2010;363:2211–9. doi: 10.1056/NEJMoa1000367. [DOI] [PMC free article] [PubMed] [Google Scholar]
Associated Data
This section collects any data citations, data availability statements, or supplementary materials included in this article.
Supplementary Materials
Supplementary table 1. Fully-adjusted hazard ratios and 95% confidence intervals (95% CI) for major cardiovascular outcomes per standard deviation increment in anthropometric variables in participants without prior history of cardiovascular disease at baseline