Abstract
The discharge of a platinum parallel-plate capacitor filled with ultrapure water has been measured. The observed discharge trend can be described by a Modified Poisson-Boltzmann Equation (MPB) only when the voltage is very low. Increasing the applied voltage creates an “exclusion zone,” in which the MPB equation no longer fits, and the system capacitance shows a dependence on the spacing between the two platinum plates. The permittivity of water, calculated considering the system as a plane capacitor, appears to be very high. This implies that the exclusion zone could have extraordinary dielectric properties.
Introduction
The behavior of water close to solid surfaces stirs interest from the viewpoint of fundamental knowledge and technological progress. However, understanding remains limited despite a large number of studies [1–5].
It is generally held that only few water molecular layers feel the influence of the surface. Nevertheless the literature contains substantial evidence for a more extended influence.
For example, changes in the physical-chemical properties of the pure water, likely due to variations in supra-molecular structure, have been recently revealed [6]. Moreover, it has been demonstrated that colloidal and molecular solutes, suspended in aqueous solution, are excluded from the vicinity of various hydrophilic surfaces [7]. The resulting exclusion zone (EZ) extends to hundreds of micrometers from the surface, a distance many orders of magnitude larger than previously believed. Analyses performed by using several techniques have revealed that the EZ exhibits altered physical parameters with respect to bulk water. To account for this experimental evidence, it has been proposed [8] that the water in EZ may have a different structure than ordinary water.
More recent evidence supports this idea, as the refractive index of the EZ exceeds that of water by about 10% [9]. Further, the changes of the work function of some metals immersed in water [10] have been detected. These changes are likely due to the dipole moment normal to the interface, arising from the organization of water molecules close to the metal [11].
Because of its connection with refractive index, permittivity of water close to surfaces seems interesting to study, especially in the lower frequency range where extraordinary values of the permittivity of biological tissues have been reported [12,13]. When tissues are hydrated, permittivity values are many orders of magnitude greater than the normal permittivity of water, while, when the tissues are dehydrated, permittivity becomes small [14]. This behavior is not well understood. It is currently explained as arising from the influence of ions close to the biological membranes, presuming that the permittivity of water does not change. However, identification of the near-surface EZ raises questions about this explanation, and implies that the permittivity of water could change significantly.
From an experimental point of view, direct measurements of water permittivity inside biological tissues are challenging due to tissue complexity, both chemical and topological. It is more convenient analyze simple systems in which the evidence of an EZ has been demonstrated. Recently an EZ has been reported at the interface between water and noble metals such as platinum and gold. This EZ appears only if a suitable electrical potential is placed on those noble metals [15]. These observations imply that a platinum parallel-plate capacitor could be a relatively simple system for studying the dielectric behavior of water.
The water-metal interface has been studied for more than a century, starting from the work of Helmholtz. Even though the water-metal interface system appears to be rather simple, up to now has not been fully understood. The classical description of this interface comes from Gouy, Chapman, and Stern [16,17], who claimed that a double layer of charge exists at the metal-water interface. The first layer is constituted by ions adsorbed on the metal surface (Helmholtz layer) while the second layer is formed by a cloud of ions driven by the coupled influences of diffusion and electrostatic forces (Gouy-Chapman layer). Recently some papers [2–4] improved this classical description by employing a modified Poisson-Boltzmann theory (MPB). So a well-defined model exists to compare with experimental results.
To investigate water permittivity the technique of impedance spectroscopy (IS) appears to offer advantages. IS enables investigation of dielectric relaxation processes over an extremely wide range of characteristic times, extending from 10−4 to 1012 s. Although the method does not offer the selectivity of NMR or EPR, it can provide important and sometimes unique information on the dynamic and structural properties of substances. The analysis is generally performed in the frequency domain and, sometimes, in the time domain.
We used this technique to study the platinum-water interface. Two platinum sheets sandwiched a layer of water. The results were interesting: When the potential difference applied between plates was low, of the order of few hundreds of millivolts, then the capacity as a function of applied voltage behaved as foreseen by the modified Poisson-Boltzmann theory (MPB). On the other hand, when the applied potential exceeded the threshold potential for which the EZ appears, then the behavior differed radically from that predicted by MPB.
In this latter situation we also found an anomaly at small separation distances: when the separation was less than the thickness of the EZ, the capacitance depended on the distance between the two plates. This was seen at separations up to hundreds of micrometers. By contrast, MPB predicts that ions interact with the charged surfaces up to few Debye lengths [17], i.e., several hundred nanometers under the conditions of our experiments — a discrepancy of three orders of magnitude.
Materials and Methods
a) Measurement cell
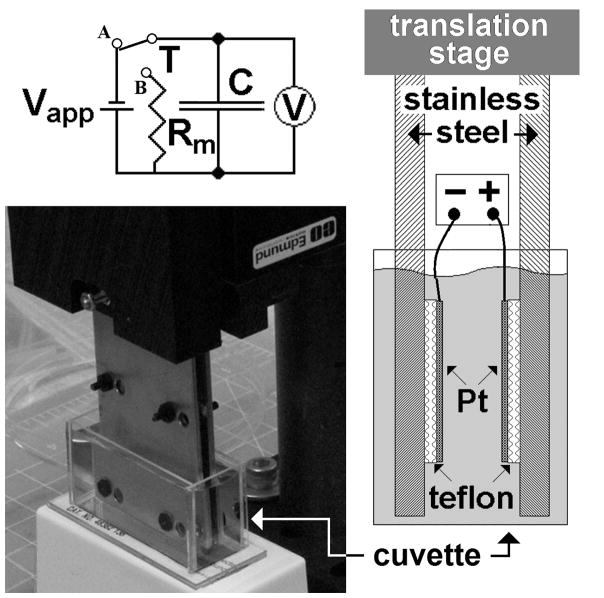
Shown in Figure 1, the measurement cell consists chiefly of two planar electrodes, made of platinum (Alfa Aesar 99.99% purity), with an active surface of 6.25 cm2. Each electrode is mounted on a larger stainless steel plate with an intervening Teflon layer for electrical insulation (right inset). The distance between electrodes can be set, with a position error of 2 μm, using an Edmund Optics linear translation stage. The lower parts of the two stainless steel plates were immersed in a water-filled rectangular (15 × 35 × 25 mm) glass cuvette. A voltage Vapp could be established between the two platinum electrodes. Before and after each measurement day, the platinum surfaces were lightly buffed with an ultrapure water-soaked lab tissue.
Figure 1.
Image of the measurement setup. Insets show the position of platinum plates mounted inside the stainless plates (right) and the measurement circuit (above). Vapp is the applied voltage, T is a switch, V is an electrometer, C is the measurement cell and Rm is the load resistance. The platinum plates are immersed in a rectangular cuvette filled with water.
b) Measurement circuit
A simple circuit with a resistor and power supply was used (upper inset of Figure 1). By closing the switch T onto point A, a voltage Vapp was applied between the two platinum plates and the measurement cell was charged. Once T was switched over to B, the charge diminished over time and the circuit was used to evaluate the current I(t) during the discharge. I(t) was equal to the ratio of V(t), the potential measured across the load resistance Rm, and Rm. V(t) was measured using a Keithley Model 6512 electrometer (measurement range 10 μV – 200 V, sensitivity 4½ digits, input resistance 200 TΩ), and a Tektronix TDS2004B oscilloscope, connected to an instrumentation amplifier with high input impedance (10 GΩ). In a preliminary stage a Fluke PM6304 RCL meter was used.
I(t) depends on the capacitance C(t) of the system and it is possible, as shown in “Results and discussion”, to calculate C(t) from I(t).
Ions present in water are attracted by the plates of opposite sign, shielding the bulk water from the plates and creating a double layer having a very high capacity. So, in our condition, the capacitance of bulk water don’t contribute to the total capacitance of the system C(t) which is determined only by the behavior of the water–platinum interface.
c) Water
All experiments used deionized water obtained from a NANOpure Diamond ultrapure water system. The purity of water from this system is certified by resistivity values up to 18.2 MΩ cm, which exceeds ASTM, CAP, and NCCLS Type I water requirements. Conductivity of water and solutions was measured using a CON 110 meter (OAKTON Instruments, Vernon Hills, IL).
d) EZ
To test for the presence of exclusion zones, carboxylate (2.65% solid-latex, Polysciences Inc.) and amidine (4.1% solid-latex, Invitrogen) functionalized microspheres, 1-μm diameter, were used. The volume fraction of microspheres relative to water was 1:200. The water inside the rectangular cuvette appeared milky because the microspheres scattered the light. The presence of the exclusion zone was checked using a collimated light beam, parallel to the platinum plates. The beam illuminated one of the smaller sides of the rectangular cuvette, and a camera monitored the opposite smaller side. When the exclusion zone built up and microspheres were excluded, the light became free to cross the entire cuvette and the camera revealed a bright area close to one of the platinum plates. This corresponded to the exclusion zone.
e) Measurement protocol
All experiments were carried out at room temperature, 21–22°C. At the beginning of each measurement, the distance d between the two plates was fixed and a constant potential difference Vapp was applied between the platinum plates for one hour. Immediately after the measurement, the circuit switch T was connected to B, the current I(t) started to flow, and was measured every 0.2 s up to the time it reached the minimum measurable value. After each measurement, the cell was short-circuited for 10 minutes in order to refresh the initial conditions. We used six different values of Vapp: 0.270, 0.470, 0.850, 1.115, 2.00, 3.06 V, and for each value of Vapp six different values of d: 0.05, 0.10, 0.20, 0.40, 0.80, and 2 mm.
Results and Discussion
Before proceeding with experiments on metals, we conducted pilot experiments on a system in which exclusion zones had been well studied: the Nafion-water interface. To make this we used the system of fig. 1 in which the two platinum plated were susbstituted by two stainless steel plates, covered by a layer of nafion, few micrometers thick. In this system, after some tens of minutes an exclusion zone appeared. We observed that the capacity of the system changed in a noticeable way during EZ buildup; this was seen both in the presence and in the absence of the microspheres commonly used to detect the EZ.
These results confirmed the existence of a connection between EZ growth near the nucleating (Nafion) surface and the permittivity of water; so we moved on to studies of water next to platinum. When a supra-threshold voltage was applied between platinum plates immersed in water, an EZ built next to the platinum. At the same time, we found a noticeable increase of the capacity of the system in the lower frequency range (<1 kHz). Because the lower limit of our impedance analyzer was 100 Hz we decided to perform the main body of measurements in the time-domain framework instead of the usual frequency domain. In this case a voltage step is applied to the system and the consequent evolution of the current I(t) towards equilibrium is measured. In this way, the fast and progressively slower processes are observed on a relatively long time scale and the distribution of the relaxation times is determined.
A difficulty arose from the long discharge time. When the platinum capacitor was immersed in ultrapure water and charged with a suitable voltage Vapp, we found that the discharge time was very long. After 85,000 s the measured voltage was still approximately 40% of the initial voltage. Each experiment would therefore require several days. To avoid this inconveniently long period we discharged the capacitor onto a suitable resistance, chosen in such a way that the discharge time was of the order of some hundreds of seconds. In this way information on the actual resistance of the system was lost, but we were easily able to calculate the system’s capacitance.
All the experiments were performed with the measurement setup described in Materials and Methods. This setup allowed for charging and discharging of the system and, when necessary, checking for the presence of the EZ.
We first checked the electrical conditions under which an exclusion zone appeared between the two platinum plates immersed in water. This control was carried out using microspheres. We confirmed that an exclusion zone appears only if a suitable difference of potential (>1V) was applied between the two plates. The discharge of the system via the load resistance Rm required some hundreds of seconds, during which the EZ decreased in size, and, at the end, disappeared. The time course of discharge was slightly affected by the presence of the microspheres so subsequent measurements were performed with the system filled with pure water, supposing that EZ formation is revealed, but not caused, by the presence of the microspheres. Ample experiments confirm this supposition [18].
Figure 2 shows the time course of current during the discharge of the system filled by ultrapure water, obtained under a typical condition when Vapp = 2.0 V and d = 0.1 mm.. It shows progressive decay of current, lasting several minutes.
Figure 2.
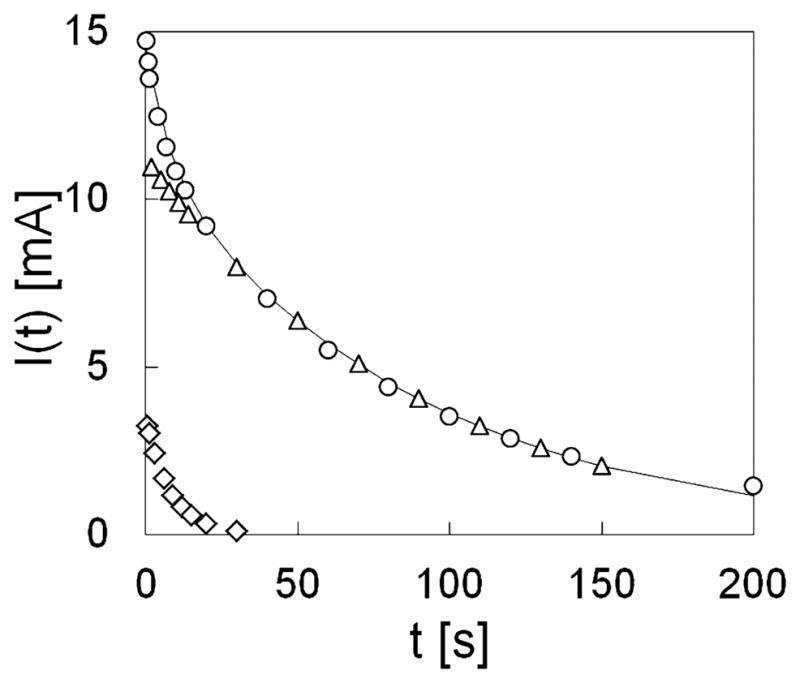
Typical time course of current during discharge of the system filled with pure water. ○ experimental data, —— bi-exponential fit, ◇ fast decay component, △ slow decay component.
Current flow, in general, may be described as the sum of a continuous distribution of exponential decays [19]:
| (1) |
where γ=1/τ is the frequency, τ is the time constant of the single process, and H(γ) is the probability density function. Figure 2 shows that only two exponential decays are needed to fit the observed time course, so that equation (1) is reduced to:
| (2) |
In equation 2 the subscripts f and s describe respectively the fast and slow components of the biexponential fit, characterized by the time decays τf and τs, and by the relative weights wf and ws. This simplification was always possible under our experimental conditions: the R2 parameter of the biexponential fit was better than 0.999 in all 36 experimental combinations.
Figure 3 summarizes the values of the parameters of equation (2) obtained from changing the applied voltage and the distance between plates. Figure 3a shows the values of the slow and fast components of current at t = 0, while Figure 3b shows the corresponding time constants.
Figure 3.
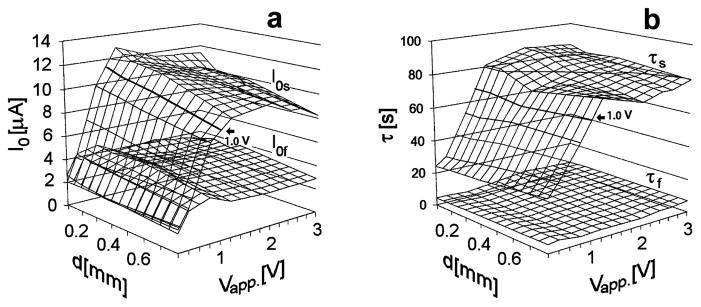
Parameters of the biexponential fit obtained on varying the applied voltage Vapp and the distance between the two plates d. (a) Values of I0s=I0*ws and I0f=I0*wf of the bi-exponential fit; (b) Values of the time constants τs and τf.
On varying the applied voltage, the fast components of current and the corresponding time decays remain approximately constant. The parameters of the slow components, on the other hand, exhibit higher values when Vapp ≥ 1.1 Volts, for which, as said, an exclusion zone appears.
Dielectric behavior of the water can be obtained from the capacitance of the system. Capacitance can be calculated using the above parameters. C(t) is equal to the ratio between dQ(t) and dV(t), where Q(t) is the charge accumulated on the plates at time t, and V(t) the electrical potential difference in the interfacial region. This last quantity, in turn, is equal to the sum of two potential differences, due to the load resistance Rm and to the resistance of bulk water Rb (which was measured at higher frequency). So we have: V(t) = (Rm+ Rb)*I(t), and the capacitance of the water-platinum interface region is:
The quantity C(t) is often called the “differential capacitance”. In this work we call it simply the “capacitance”. Because:
We obtain:
Figure 4a describes the behavior of the capacitance as a function of the instantaneous voltage. The behaviors are shown for different applied voltages (italicized numbers) and a 100-μm plate separation.
Figure 4.
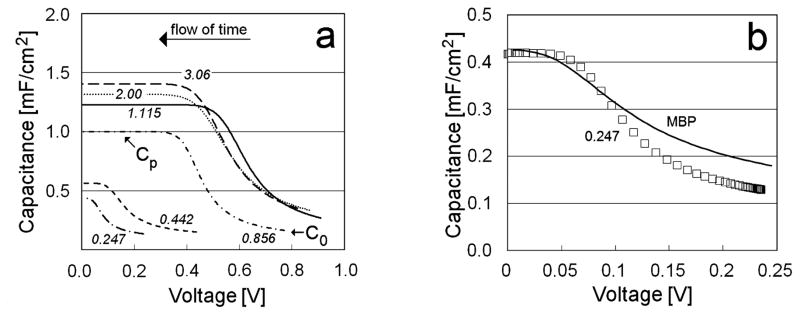
(a) Behavior of the differential capacitance as a function of instantaneous voltage V(t), for d = 100 μm and various values of Vapp). Cp and C0 values for Vapp = 0.856 V are also indicated. The italicized numbers refer to the values of Vapp.
(b) Comparison between experimental values and modified Boltzmann-Poisson (MBP) theory [3,4]. (□) Experimental values of differential capacitance for Vapp = 0. 247 V and d = 2 mm. Continuous line: MBP theory with an ion density of 9*103 mol/m3.
In all cases the capacitance depends on the instantaneous electrical potential difference between the two plates. Capacitance grows from a C0 value, achieved during the charging period, to a constant value Cp reached at long times, as the voltage decays toward zero. The trend of the capacitance depends on Vapp, when Vapp is small, but reaches an approximately constant behavior for Vapp ≥ 1.115 V. Similar behavior is seen for Cp values. It is noteworthy that these higher values of Vapp, correspond to the conditions in which an EZ appears.
In the low voltage region, no anomaly appears. As shown in Figure 4b, the behavior of the differential capacitance, as a function of instantaneous voltage V(t), is similar to that expected from a modified Poisson-Boltzmann (MPB) theory of electrolytes for concentrated solutions (~8.7*103 Mol/m3) [2–4]. The ion concentration required to fit the experimental data is orders of magnitude larger than that calculated from bulk water resistivity; however, that calculation cannot necessarily be applied close to surfaces: Recent papers have shown that in ultrapure water, the bulk concentration of hydroxide ions or hydronium ions noticeably differs from the concentrations close to metal-water interfaces [5,7]. Therefore, it appears that the dependence of the capacitance on applied voltage can be explained simply by properly taking in account the presence of ions situated very close to the metal surface. There is no evidence of any change of water polarization. Indeed, no EZ appears under these conditions.
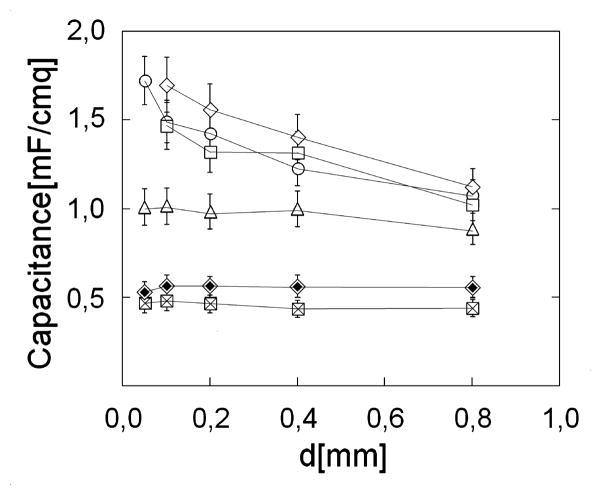
Figure 5 shows the behavior of Cp as a function of distance between the plates. Different symbols refer to the different values of applied voltage. When the applied voltage is small, Cp is independent of plate separation, as expected if the capacitance is due only to the double layer of charges at the metal-water interface. However, when the voltage is high enough, Cp becomes larger and depends on the distance between plates. These are the conditions under which an EZ appears.
Figure 5.
Capacitance Cp as a function of the distance d between plates for different values of Vapp: ⊠ 0.247 V, ◈ 0.442V, △ 0.856 V, ○ 1.115 V, □ 2.000 V, ◇ 3.060 V.
The collection of evidence above implies that an electric field reorganizes the pure bulk water between two platinum plates, but only when the applied voltage reaches a certain threshold. As a consequence of this reorganization, the relative permittivity of water may change appreciably, if not dramatically.
The capacitance CB(d), associated to this new structure, is connected in series with the surface capacitance CS due to the double layer of charges at the metal-water interface. The latter is independent of d.
So we can write:
According to this equation, the behavior of 1/CP as a function of d gives us information about the dependence of CB on d. Since, according to our data, 1/CP linearly depends on d (R2>0.93) one can suppose that CB is inversely proportional to d:
where the constant K is measured and is equal to the inverse of the slope of 1/CP versus d.
If we consider a plane capacitor having an area A and a distance between the plates d, filled by an homogeneous material of permittivity ε, its capacitance shows the same dependence on d:
We have extracted from the total capacitance of our system the capacitance Cs, caused by the layers of ions condensed on the opposite charged surfaces. So we can consider the capacitance CB as due to a plane capacitor, filled by a material, the water inside the structured zone, with an average permittivity ε. We can easily calculate this permittivity:
This permittivity appears to be very high, 4,0±0,2 ×10⁻⁶ [F/m]. Nevertheless this value is in line with the values of the low frequency permittivity of biological tissues reported in literature [12–14].
These last values are currently attributed to the ionic diffusion processes at the site of the cellular membrane. Our finding could suggest a different explanation. Biological interfaces could induce a reorganization of water close to them. This organized water could be characterized by a high value of permittivity, as that measured here. Indeed, this structure could be relevant for understanding the interaction between electromagnetic fields and biological systems.
Conclusion
Our results show that, the traditional description of the water-metal interface seems appropriate only in the case of a very low applied voltage. In that case, MPB theory, founded on the presence of a double layer of charges concentrated within a few nanometers of the metal-water interface, appears to be able to describe the behavior of the system appropriately.
Increasing the applied voltage to values of approximately on volt, at which exclusion zones appear, changes the physical chemical environment sufficiently that MPB theory no longer holds. The relationship between system capacity and potential difference between the two plates is no longer describable by the MBP theory. In particular, the capacity shows a distance dependence extending up to hundreds of microns, which is the typical dimension of the exclusion zone. In these conditions the total capacity can be described as the sum of two capacities in series: one independent on the distance between the plates and connected to the ions forming a compact layers of charges close to the metallic surfaces; and another depending linearly on the inverse of the distance between the plates. This latter capacity is connected to the permittivity of the water between the plates. This permittivity appears to be unusually high — three orders of magnitude higher than normal water permittivity. Even though this value is quite high, many biological tissues, when hydrated and under physiological conditions, present even much higher values.
The permittivity that we measured should imply an unusual alignment of water dipoles. Water has a permittivity about one order of magnitude higher than the value expected from classical thermodynamic calculations, taking into account dipolar momentum. This implies some kind of cooperative interaction between the various dipoles of water. In our case the unusually high permittivity that we found could correspond to a much stronger cooperative effect as a consequence of the structural rearrangement connected with the appearance of the exclusion zone. Hence, the exclusion zone could have extraordinary dielectric properties, implying an unusual state of water characterized by a different structure.
More investigations of the dependence of this phenomenon on the materials used and on other physical parameters are necessary to try to understand this phenomenon, which demonstrates how water, up to now, has beena misunderstood substance.
Highlight.
Applying an apt voltage to a Pt surface plunged in water an exclusion zone appears.
When the exclusion zone appears MBP theory don’t works.
Inside the exclusion zone the permittivity of water appears to be very high.
Footnotes
Publisher's Disclaimer: This is a PDF file of an unedited manuscript that has been accepted for publication. As a service to our customers we are providing this early version of the manuscript. The manuscript will undergo copyediting, typesetting, and review of the resulting proof before it is published in its final citable form. Please note that during the production process errors may be discovered which could affect the content, and all legal disclaimers that apply to the journal pertain.
Contributor Information
FRANCESCO MUSUMECI, Email: fmusumec@dmfci.unict.it.
GERALD H. POLLACK, Email: ghp@u.washington.edu.
References
- 1.Wang H, Pilon L. J Phys Chem C. 2011;115:16711–16719. [Google Scholar]
- 2.Bazant MZ, Thornton K, Ajdari A. Phys Rev E. 2004;70:021506. doi: 10.1103/PhysRevE.70.021506. [DOI] [PubMed] [Google Scholar]
- 3.Kilic MS, Bazant MZ, Ajdari A. Phys Rev E. 2007;75:021502. doi: 10.1103/PhysRevE.75.021502. [DOI] [PubMed] [Google Scholar]
- 4.Kilic MS, Bazant MZ, Ajdari A. Phys Rev E. 2007;75:021503. doi: 10.1103/PhysRevE.75.021503. [DOI] [PubMed] [Google Scholar]
- 5.Bruesch P, Christen T. J Appl Phys. 2004;95:2846–2856. [Google Scholar]
- 6.Germano R, Del Giudice E, De Ninno A, Elia V, Hison C, Napoli E, Tontodonato V, Tuccinardi FP, Vitiello G. Key Eng Mat. 2013;543:455–459. [Google Scholar]
- 7.Zheng J, Chin W, Khijniak E, Khijniak E, Jr, Pollack GH. Adv Colloid Interface Sci. 2006;127:19–27. doi: 10.1016/j.cis.2006.07.002. [DOI] [PubMed] [Google Scholar]
- 8.Yoo H, Paranji R, Pollack GH. J Phys Chem Lett. 2011;2:532–536. doi: 10.1021/jz200057g. [DOI] [PMC free article] [PubMed] [Google Scholar]
- 9.Tychinsky V. Water. 2011;3:95–99. [Google Scholar]
- 10.Musumeci F, Pollack GH. Chem Phys Lett. 2012;536:65–67. doi: 10.1016/j.cplett.2012.03.094. [DOI] [PMC free article] [PubMed] [Google Scholar]
- 11.Schnur S, Gross A. New J Phys. 2009;11:125003. [Google Scholar]
- 12.Gabriel C, Gabriely S, Corthout E. Phys Med Biol. 1996;41:2231–2249. doi: 10.1088/0031-9155/41/11/001. [DOI] [PubMed] [Google Scholar]
- 13.Gabriely S, Lau RW, Gabriel C. Phys Med Biol. 1996;41:2251–2269. doi: 10.1088/0031-9155/41/11/002. [DOI] [PubMed] [Google Scholar]
- 14.Gulino M, Bellia P, Falciglia F, Musumeci F, Pappalardo A, Scordino A, Triglia A. FEBS Letters. 2005;579:6101–6104. doi: 10.1016/j.febslet.2005.09.077. [DOI] [PubMed] [Google Scholar]
- 15.Chai B, Mahtani AG, Pollack GH. Contemporary Materials, III. 2012:1–12. doi: 10.7251/COM1201001C. [DOI] [PMC free article] [PubMed] [Google Scholar]
- 16.Gouy M. J de Phys. 1910;9:457–468. [Google Scholar]
- 17.Debye P, Falkenhagen H. Elektrolyten Physik Z. 1928;29:121. [Google Scholar]
- 18.Pollack GH, Ebner, et al. 2013 [Google Scholar]
- 19.Musumeci F, Applegate LA, Privitera G, Scordino A, Tudisco S, Niggli HJ. J Photochem Photobiol B: Biology. 2005;79:93–99. doi: 10.1016/j.jphotobiol.2004.12.002. [DOI] [PubMed] [Google Scholar]


