Abstract
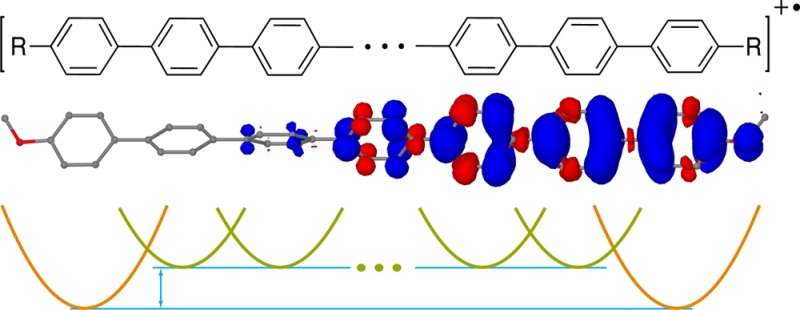
Poly-p-phenylenes (PPs) are prototype systems for understanding the charge transport in π-conjugated polymers. In a combined computational and experimental study, we demonstrate that the smooth evolution of redox and optoelectronic properties of PP cation radicals toward the polymeric limit can be significantly altered by electron-donating iso-alkyl and iso-alkoxy end-capping groups. A multiparabolic model (MPM) developed and validated here rationalizes this unexpected effect by interplay of the two modes of hole stabilization: due to the framework of equivalent p-phenylene units and due to the electron-donating end-capping groups. A symmetric, bell-shaped hole in unsubstituted PPs becomes either slightly skewed and shifted toward an end of the molecule in iso-alkyl-capped PPs or highly deformed and concentrated on a terminal unit in PPs with strongly electron-donating iso-alkoxy capping groups. The MPM shows that the observed linear 1/n evolution of the PP cation radical properties toward the polymer limit originates from the hole stabilization due to the growing chain of p-phenylene units, while shifting of the hole toward electron-donating end-capping groups leads to early breakdown of these 1/n dependencies. These insights, along with the readily applicable and flexible multistate parabolic model, can guide studies of complex donor–spacer–acceptor systems and doped molecular wires to aid the design of the next generation materials for long-range charge transport and photovoltaic applications.
Introduction
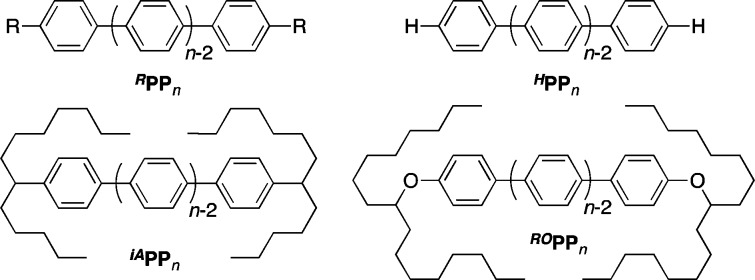
On-going developments in the fields of molecular electronics and photovoltaic devices have led to ever-growing interest in π-conjugated polymers that can be used as molecular wires, donor–acceptor bridges, components of organic light-emitting diodes, etc.1−5 Poly-p-phenylene (PPn) is a paradigm model for investigating the electrical and optical properties of these polymers6−11 as well as the charge transport through them.12,13 Unfortunately, systematic studies of the neutral and oxidized/reduced PPn molecules are seriously hampered by their poor solubility. We have addressed this issue by synthesizing a well-defined series of poly-p-phenylene oligomers iAPP2–iAPP7 with end-capping branched iso-alkyl groups, iA = 6-tetradecyl, Chart 1, that dramatically improved their solubility.14,15 The systematic study of the iAPPn/iAPPn+• series revealed, for the first time, an inverse 1/n relationship of their redox and optoelectronic properties. Unfortunately, the solubility issues prevented expanding the iAPPn series beyond seven p-phenylene units.14 Furthermore, it is not clear what effect the capping groups may have on the electronic properties of iAPPn molecules, and to what degree the iAPPn results can be applicable to other end-capped RPPn and uncapped HPPn molecules.
Chart 1.
Here, we aim to provide a comprehensive picture of structure–property relationships of RPPn/RPPn+• for any length and with various end-capping substituents. Our carefully calibrated density functional theory (DFT) calculations revealed that RPPn oxidation potentials and the RPPn+• optical properties can significantly deviate from, or even not follow, the 1/n dependence for longer chains and/or strongly electron-donating capping groups R; these predictions are further confirmed experimentally for a series of alkoxy-capped ROPPn oligomers, n = 2–7. We rationalize these unexpected results using a multistate parabolic model (MPM)—a generalization of the traditional two-parabola Marcus model—which shows that evolution of the redox and optoelectronic properties of RPPn+• is determined by the interplay between electronically nonequivalent terminal and internal p-phenylene units.
Results and Discussion
DFT Modeling of the Extended RPPn/RPPn+• Series
Delocalized π-conjugated cation radicals (CRs) such as RPPn+• are challenging for many DFT methods due to the self-interaction error16−19 (SIE) that causes artificial delocalization of the positive charge/hole20 and thus leads to an increasingly underestimated oxidation potential for the longer chains as well as an incorrect nature of the first excited state of the CRs. The SIE can be reduced by using hybrid DFT methods that add a portion of the exact Hartree–Fock (HF) exchange term into the exchange functional.21−25 However, the contribution of HF exchange in most of the widely used hybrid functionals, %HF < 30, is not sufficient for a correct description of delocalized mixed-valence charged compounds; on the other hand, hybrid DFT functionals with %HF > 50 (global or long-range) often lead to overlocalization of the charge/hole.26,27 This necessitates fine-tuning of %HF based on the available experimental data.17,19,24−26 Therefore, in this work, we used a one-parameter density functional B1LYP28 with the Hartree–Fock (HF) exchange term contribution17,21,22,26,27 carefully benchmarked and calibrated against the experimental data for the iAPPn/iAPPn+• series,14 as detailed in the Supporting Information.29 Using this calibrated B1LYP-40 functional, we extended the iAPPn/iAPPn+• series up to 10 p-phenylene units and compared it with the experimentally inaccessible uncapped HPPn series.30,31 Comparison of the 1/n plots of the calculated32 oxidation energies ΔEel and CR vertical excitation energies νmax for HPPn and iAPPn (Figure 1) shows two important differences between the two series: (1) the iAPPn series has a small minimum of ΔEel at n = 6, whereas HPPn demonstrates a smooth transition to saturation; (2) νmax abruptly saturates at n = 7 for iAPPn+•, while in HPPn+• it approximately follows a linear 1/n relationship up to n = 10. As this early breakdown of the 1/n relationship in the iAPPn+• series is likely related to the electron-donating nature of the iA end-capping groups, we further investigated the ROPPn series with strong electron-donating alkoxy (RO) end-capping groups. In this series, the predicted νmax evolution is similar to iAPPn+• (Figure 1B), although the leveling off is observed much earlier at n = 4 for ROPPn+• vs n = 7 for iAPPn+•. At the same time, the ΔEel evolution is dramatically different for ROPPn series, as the oxidation energy increases, not decreases, with increasing n and asymptotically saturates for n > 5 (Figure 1A).
Figure 1.
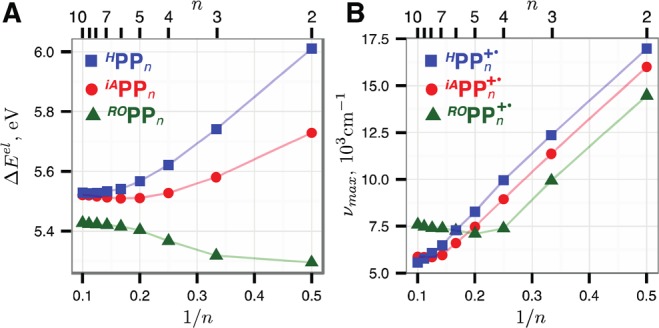
Calculated RPPn energies of oxidation ΔEel (A) and vertical excitation energies of the RPPn+• lowest-energy bright transitions (B) vs 1/n.33 DFT calculations were performed at the B1LYP-40/6-31G(d)+PCM(dichloromethane) level of theory, and the vertical excitation energies were obtained with time-dependent DFT calculations at the same level.
The predicted deviations from the linear 1/n evolution of the iAPPn/iAPPn+• properties become apparent only for n ≥ 8 and thus could not have been observed in our previous experimental study,14 because these longer oligomers were not accessible due to the solubility issues. As these deviations are predicted to appear much earlier in the ROPPn series, we synthesized a homologous series of alkoxy-capped ROPPn molecules, n = 2–7, examined their oxidation potentials, and recorded the electronic spectra of their cation radicals.
Synthesis and Properties of ROPPn/ROPPn+•
Initial attempts to synthesize ROPPn oligomers with octyloxy end-capping groups produced only 2- to 4-phenylene oligomers that were soluble in dichloromethane, while the 5-phenylene oligomer was only sparingly soluble and showed extensive aggregation even in the neutral form.34 After multiple variations of alkoxy groups, the use of a 17-carbon iso-alkoxy (i.e., 9-heptadecyloxy) group provided more or less soluble ROPPn oligomers up to 7-p-phenylene units. The synthesis of the desired ROPPn was accomplished via the Suzuki coupling35,36 between a combination of 4-alkoxy-1-bromobenzene/4-alkoxy-4′-bromobiphenyl and 1,4-dibromobenzene, 4,4′-dibromobiphenyl, etc. (see Scheme S1 in the Supporting Information). The synthesized oligomers showed good solubility in dichloromethane up to ROPP6; however, the solubility of ROPP7 dropped to less than ∼1 mg/10 mL. The structures of various ROPPn were easily established by 1H/13C NMR spectroscopy and further confirmed by MALDI mass spectrometry (see Figures S12–S14 in the Supporting Information).
The redox properties of the ROPP2–ROPP7 were evaluated by electrochemical oxidation at a platinum electrode as a 1 mM solution in dichloromethane containing 0.1 M tetra-n-butylammonium hexafluorophosphate (n-Bu4NPF6) as the supporting electrolyte. The reversible cyclic voltammograms of various ROPPn are presented in Figure S15 in the Supporting Information. The oxidation potentials of various ROPPn were referenced to added ferrocene, as an internal standard (Eox = 0.45 V vs SCE), vide infra.
The electrochemical reversibility and relatively low oxidation potentials of ROPPn allowed using naphthalene cation radical (NAP+•),37 a robust one-electron oxidant, to quantitatively produce the corresponding CRs ROPPn+• and collect their spectra (Figure 2). The ROPP2+•–ROPP4+• spectra show structured absorption bands that shifted red with increasing number of p-phenylene units, while the strikingly similar absorption spectra of ROPP6+• and ROPP7+• show a Gaussian band at ∼7150 cm–1 (∼1400 nm), and the ROPP5+• spectrum shows intermediate features with two bands at 6452 cm–1 (1550 nm) and 5050 cm–1 (1980 nm) (vide infra). The Eox values and optical properties of ROPPn/ROPPn+• are compiled in Table S10 in the Supporting Information.
Figure 2.

(A) Spectral changes upon the reduction of 0.1 mM naphthalene cation radical by an incremental addition of 0.77 mM solution of ROPP2 in dichloromethane at 20 °C (25 μL increments). (B) A plot of the increase of the absorbance of ROPP2+• (monitored at 832 nm) and depletion of the absorbance of naphthalene cation radical NAP+• (monitored at 672 nm) against the equivalent of added ROPP2. (C) Electronic spectra of various ROPPn+•, generated as in part A; see Figure S33 in the Supporting Information for the wavelength vs absorption plot. The separation of ∼1300 cm–1 between the vibronic peaks suggests that the vibronic structure arises due to the backbone C–C bond vibrations.38
The experimentally observed evolution of Eox values of ROPPn and the corresponding CR excitation energies νmax (Figure 3, presented with previously obtained iAPPn data) are in excellent agreement with the computational predictions of the non-1/n behavior induced by electron-donating end-capping groups in RPPn. Indeed, both predicted unexpected features of ROPPn/ROPPn+•—the increase of Eox with increasing n and the saturation of νmax beyond n = 4—are confirmed experimentally.
Figure 3.
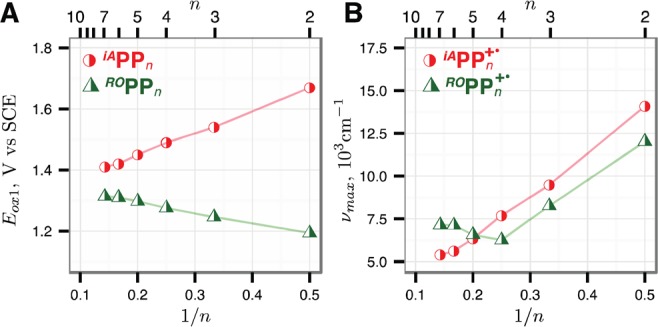
Experimental ROPPn and iAPPn first oxidation potentials Eox1 (A) and the corresponding CR maxima (B) vs 1/n; iAPPn data from ref (14).
Hole Position and Distribution in RPPn+•
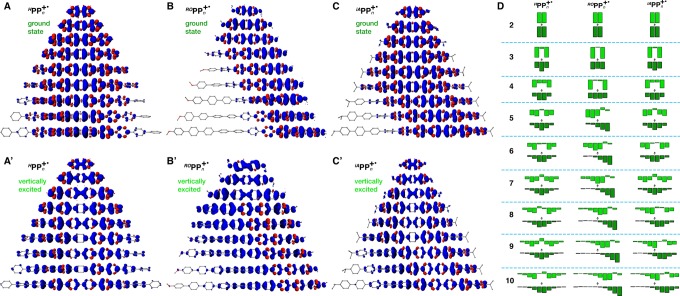
To understand these dramatic effects of the end-capping groups on the RPPn+• properties, we turned our attention to the features of the hole distribution in these systems. Indeed, there are striking differences in the evolution of the hole delocalization patterns in the three RPPn+• series, R = H, iA, and OR, as evident from the unpaired ground state spin density plots39 (Figure 4A–C) and the condensed per-unit hole distributions evaluated as spin densities Δs and charge Δq+ (Figure 4D and Figure S21, Supporting Information). In uncapped HPPn+•, the hole is symmetrically distributed in the center of the molecule across the entire series, n = 2–10, which correlates well with a smooth near-1/n evolution of the ΔEel and νmax for this series (Figure 1). In the vertically excited HPPn+• (Figure 4A′ and D), the hole also remains symmetrically distributed for the entire series but spreads toward both ends of the molecule, leaving the central unit (or two central units in the case of even n) virtually unoccupied.
Figure 4.
Isosurface plots of the unpaired spin density in the ground state (A–C) and vertically excited (A′–C′) RPPn+•, calculated at the B1LYP-40/6-31G(d)+PCM(dichloromethane) level of theory. Regions with excess beta and alpha spin density are colored blue and red colors, respectively. (D) Bar charts of condensed per-unit positive charge Δq+ in the ground state (dark green) and vertically excited (light green) RPPn+• calculated with natural population analysis.
The hole distribution patterns in the iAPPn+• series (Figure 4C and D) share similar features with HPPn+• and ROPPn+• series: for n ≤ 7, the hole is symmetrically distributed in the center, like in HPPn+•, while for the longer chains the hole shifts toward one of the capped terminal units, like in ROPPn+•. This switch in the hole position in iAPPn+• with n > 7 coincides with the deviation of the ΔEel and νmax values from the 1/n linear dependence (Figure 1). However, unlike ROPPn+•, in longer iAPPn+•, n ≥ 7, the hole is (nearly) symmetrically distributed over ∼6 units at the end of the chain, with relatively low occupation of the capped terminal unit. The hole distribution in the vertically excited iAPPn+• for n ≤ 7 is very similar to the uncapped HPPn+• where the hole symmetrically redistributes from the central units toward the periphery (Figure 4C′ and D). For n ≥ 8, the hole in the vertically excited state rearranges in similar manner among the ∼6 hole-bearing units and also slightly extends into the seventh (internal) unit.
By itself, gravitation of the hole toward one end of the molecule in longer ROPPn+• oligomers with strongly electron-donating RO end-capping groups is not entirely surprising. For shorter ROPPn+•, the oxygen lone pairs of both RO groups should be intimately involved in the charge/hole localization, leading to planarization of the internal p-phenylene units (Figure 5A), while in longer ROPPn+• the involvement of both RO groups in the hole delocalization would require quinoidal distortion of the entire polyphenylene chain that carries a significant energetic penalty due to the required planarization across the chain.
Figure 5.

Quinoidal distortion in short (A) and longer (B) ROPPn+• chains.
This penalty is minimized by shifting the hole toward a single RO-capped terminal unit at the price of losing the hole stabilization by another terminal unit (Figure 5B). Breaking the communication between the terminal units should increase Eox with increasing n, as well as dramatically affect the νmax evolution. However, it is not immediately obvious how this intuitive picture could apply to the similar gravitation of the hole toward the end for iAPPn+• with n > 7. Moreover, the quantitative picture of the evolution of the ROPPn+• properties lacks a satisfactory conceptual explanation. To address these questions, we developed a simple multistate parabolic model that generalizes well-known two- and three-parabolic models based on Marcus theory of electron transfer, as follows.
Multistate Parabolic Model (MPM) Treatment of RPPn+•
The classical two-parabolic Marcus model of electron transfer40−43 has been extensively applied for description of the hole delocalization between two aromatic units, as well as—in the extended three-parabolic model—to bridged systems.43 The two-parabolic model can be straightforwardly applied to the smallest RPP2+• oligomers, as overviewed in the Supporting Information. Briefly, in the two-parabolic model, the hole delocalization as well as the ground and excited state energies depend on the coupling Hab between the two diabatic states ψa and ψb, which correspond to the hole exclusively localized on the respective single unit, and the reorganization energy λ that corresponds to the vertical energy gap between the two diabatic states at the minimum of one of them (Figure 6). The ground Ψ1 and excited Ψ2 adiabatic states of the system arise from the mixing of the diabatic states
 |
1 |
where cij are mixing coefficients.
Figure 6.
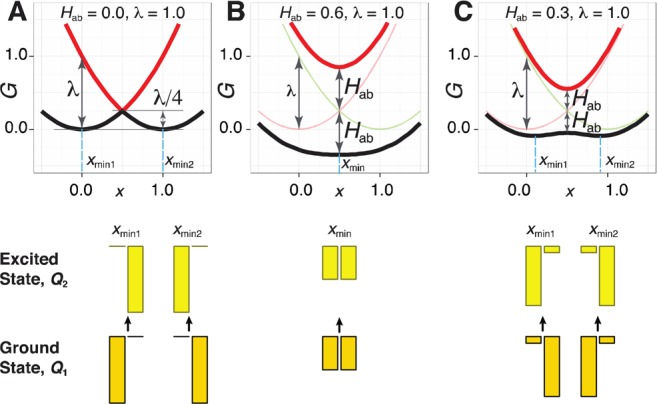
Free energy curves of the diabatic (thin lines) and adiabatic (thick lines) states in the three coupling regimes of the two-parabolic model: weak Hab/λ ≈ 0 (A), strong Hab/λ ≥ 0.5 (B), and intermediate Hab/λ < 0.5 (C). Bar plots represent hole distribution in the ground and vertically excited states at the ground state minimum xmin, calculated as squares of corresponding cij mixing coefficients.
The (free) energies of the diabatic states, Ga and Gb, are represented by quadratic functions of the effective geometric/solvent coordinate x. The composition of the adiabatic states at a given x and the corresponding energies G1 and G2 are then obtained by diagonalizing the effective Hamiltonian matrix:
| 2a |
| 2b |
The number of parameters used in this model can be reduced to one—Hab/λ—by using λ as the energy unit. Depending on the coupling strength, the hole may be localized on a single unit (weak coupling), perfectly delocalized over two units (strong coupling), or partially delocalized (intermediate coupling), as shown in Figure 6A, B, and C, respectively. Strongly delocalized systems have single-minimum ground and excited states, while partially delocalized systems have two-minima ground and single-minimum excited states.
To describe the hole delocalization in the RPPn+• with an arbitrary number of linearly connected units, we generalized this approach to develop a multistate parabolic model (MPM). In MPM, all units are represented by equivalent parabolic diabatic states with identical Hab/λ values, although the terminal parabolas may be shifted down by Δε/λ to account for the better hole stabilization abilities of the terminal units with an electron-donating capping group (Figure 7).44 We obtain the adiabatic state energies Gi and corresponding compositions in terms of mixing coefficients cij and at a given x by numerically diagonalizing the extended MPM Hamiltonian:
 |
3 |
We considered all units in HPPn+• to have the same energy, Δε = 0, and systematically varied the Hab/λ parameter to reproduce the ground state hole distribution patterns obtained with DFT (Figure 4D) at Hab/λ = 9,45 as shown in Figure 8A. Strikingly, this single-parameter model also faithfully reproduced the vertical excited state hole distribution (Figures 4D and 8A), as well as the Eox and νmax evolution for the entire series (Figures 1 and 9).
Figure 7.

MPM representation of RPPn+•: each diabatic state corresponds to a single unit; for R = RO, iA the terminal units are shifted by appropriate Δε/λ values.
Figure 8.
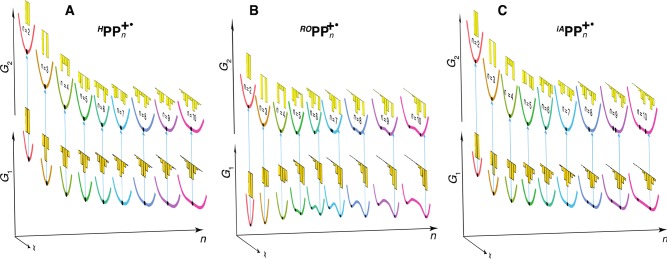
Multistate parabolic modeling of RPPn+•: pseudo-3D representation of the ground and first excited adiabatic state curves with respect to the effective hole coordinate x for n = 2–10. Minima on the curves are shown as black dots, and the bar charts show the hole distributions in the ground (at a minimum) and vertically excited (at the Franck–Condon point) states. Parameters of MPM: Δε/λ = 0 (HPPn+•), Δε/λ = 8.5 (ROPPn+•), Δε/λ = 3.7 (iAPPn+•); in all cases, Hab/λ = 9. See Figures S26–S28 in the Supporting Information for the corresponding two-dimensional plots.
Figure 9.
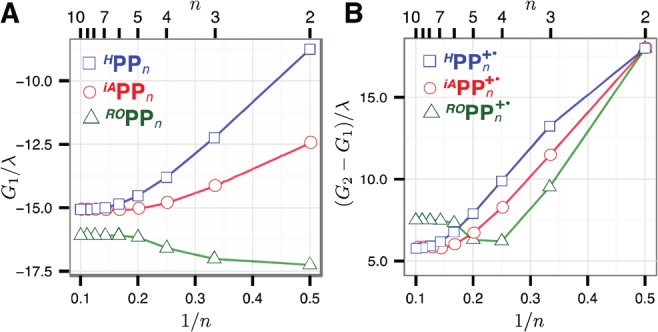
Stabilization energies of the RPPn+• adiabatic ground states G1(xmin) (A) and the vertical excitation energies G2(xmin) – G1(xmin) (B) of three obtained from the MPM (Figure 8) vs 1/n.
We further parametrized the Δε/λ values—which describe the difference between the hole stabilization abilities of the capped terminal units relative to the in-chain units—for the ROPPn+• and iAPPn+• series to reproduce the DFT ground state hole distributions (Figure 4D), while keeping the same Hab/λ = 9 value. Again, the parametrized MPM with Δε/λ = 8.5 for ROPPn+• and Δε/λ = 3.7 for iAPPn+• yielded correct vertical excited state hole distributions (Figure 8B and C vs Figure 4D), as well as the Eox and νmax evolution (Figures 1, 3, and 9).
The multistate parabolic model that—despite its apparent simplicity—reproduces all salient features of the hole distribution in the three RPPn+• series as well as their energetic and optoelectronic properties also points to the origin of the approximate 1/n dependencies in these series as well as their eventual breakdown. Indeed, if the reorganization energy λ is reduced to zero, the effective HPPn+• Hamiltonian becomes independent of x and thus isomorphous to the Hückel theory Hamiltonian for a linear π-conjugated polymer. Diagonalization of this Hamiltonian with zero main diagonal yields the ground state energy that evolves proportionally to cos[π/(n + 1)],46 that approximates as a 1/n trend for small n. Thus, for small λ or, equivalently, large Hab/λ values, the HPPn+• ground state energies should initially evolve in approximate 1/n fashion. This evolution is akin to the evolution of HOMO energies in neutral π-conjugated oligomers, as both are determined by the increasing delocalization of the hole and HOMO, respectively, over the oligomer chain. However, in the case of MPM of cation radicals, energy gain due to the hole localization is eventually compensated by the reorganization energy involving the increasing number of units, which eventually halts further delocalization and thus the approximate 1/n trends seen in shorter oligomers. Thus, the HPPn+• ground adiabatic state energies at their minima, G1(xmin), systematically decrease in approximate 1/n fashion until reaching saturation at n ≥ 7 (Figure 9A). The excited state energies decrease in a similar manner but steeper, thus leading to a linear νmax decrease until n ≃ 8 with subsequent leveling for the longer oligomers (Figure 9B).
In the ROPPn+• series, the two directly coupled low-energy units in the smallest oligomer n = 2 are the most efficient in stabilizing the hole. This stabilization becomes less efficient when high-energy bridging parabolas are added in higher oligomers, n = 3–4, that increase the ROPPn+• ground state energy, which is equivalent to the observed Eox increase for n = 2–4 (Figures 1A and 3A). Further ROPPn+• lengthening leads to development of a maximum in the middle of the ground state curve, whose energy keeps increasing until converging at n > 8 to the same limit as in the middle of the HPPn+• chains (Figure 8A and B). At the same time, the energies of the two equivalent minima on the sides of this maximum change very little for n > 5, in accord with the observed Eox leveling for n > 5.
The ROPPn+• excited state curves gradually decrease in energy, and develop two minima later than the ground state, at n = 6 (Figure 8B); as they are constructed from the higher portions of the diabatic parabolas, both terminal parabolas can still have significant contributions in the center, although their minima are already far enough to have a negligible contribution in the middle of the ground state curve (Figure S26 in the Supporting Information). Asynchronous development of the two-minima feature on the ground and excited state adiabatic curves explains the complex νmax evolution for ROPPn+•. For n ≤ 4, where both states have minima in the middle, the ground state minimum increases in energy with n, while the excited state minimum decreases in energy which results in a sharp νmax decrease (Figure 8B). For n = 5–6, the vertical excitation from one of the ground state minima leads to the Franck–Condon point on a shoulder of the single-minimum excited state well, resulting in sharply increasing νmax (Figure 8B). For n ≥ 7, both ground and excited state curves attain similar double-minimum shapes, and their energies level off, resulting in nearly constant νmax (Figure 8B).
Ground and excited state adiabatic curves of iAPPn+• appear to be similar to HPPn+• (Figure 8A and C), with single-minimum shapes and gradual lowering of their energies with increasing n. However, the iAPPn+• ground state develops a subtle double-minima structure for n ≥ 8,47 followed by the excited state for n ≥ 9. While the ground state has a single-well character for n ≤ 7, the energy at the minimum point decreases only up to n ≃ 6, in accord with the observed Eox leveling of at n ≃ 6 (Figures 1A and 9A). For n ≥ 8, the energies of the two minima on the ground state curves are just barely lower than the energy in the center, so their appearance does not affect the Eox evolution; however, it leads to a slight increase of νmax, as the Franck–Condon point ends up on a shoulder of the excited state curve (Figure 8C). Thus, although the evolution of the iAPPn+• properties is not vastly different from the uncapped HPPn+• series, the emergence of the subtle features in the higher iAPPn+• homologues, n ≥ 6, is similar to the ROPPn+• series.
Evolution of the Hole Distribution in RPPn+• and Breakdown of 1/n Relationships
The RPPn+• structure–property relationships are related to the position and shape of the hole distributed over monomer units, and at the same time, the hole distribution depends on the position of the ground state free energy minima with respect to the hole coordinate x (Figure 8). Thus, we next use the MPM to discern the nature of the forces responsible for the formation of these minima and varied distribution of the hole in three RPPn+• series.
In HPPn+•, where all units are equivalent, the hole has a symmetric bell-shaped form and resides in the middle of the chain to take advantage from delocalizing over the maximum number of monomer units. However, the hole can effectively delocalize over no more than seven p-phenylene units (Figure 10), which leads to saturation of Eox and thus emergence of polymeric behavior with respect to the hole delocalization for n > 7. The ideal bell-shaped hole distribution is distorted by introducing electron-donating iso-alkyl (iAPPn+•) or iso-alkoxy (ROPPn+•) end-capping groups that provide the additional mechanism of the hole stabilization (Figure 10).
Figure 10.
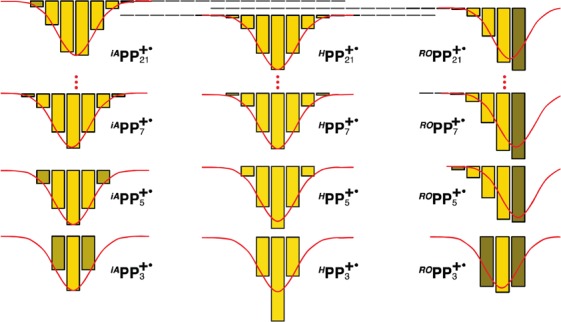
Evolution of MPM-derived hole distributions in RPPn+• up to 21 p-phenylene units.
Thus, the hole shape and position can be thought to be determined by two forces: FPpP that pushes the hole toward the middle of the chain—where it can be more effectively stabilized by the poly-p-phenylene chain—and FR that pulls it toward the end—where it can be stabilized by lower-energy terminal units. This picture can be quantified by decomposing the ground state adiabatic energy G1 into two components: the stabilization due to the poly-p-phenylene framework GPpP (taken simply as the HPPn+• ground state energy HG1) and the stabilization due to end-capping groups, GR, which is calculated by subtraction: GR = RG1 – GPpP = RG1 – HG1. Then, the two effective forces FPpP and FR that determine the hole position can be expressed as first derivatives of GPpP and GR, as shown in Figure 11 on the example of ROPP4+• and ROPP5+•.
Figure 11.
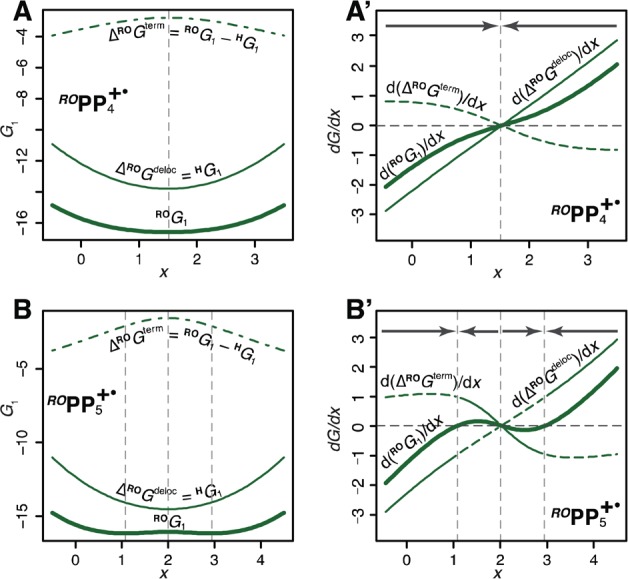
(A, B) Adiabatic ground state curves ROG1 for ROPP4+• and ROPP5+• (thick solid lines) and their components GPpP (stabilization due to poly-p-phenylene chain, thin solid lines) and GRO (stabilization due to end-capping groups, dash-dotted lines) and (A′, B′) their first derivatives (thick solid lines) interpreted as forces acting on the hole, F. Positive values of F correspond to forces pushing the hole to the left, and negative, to the right. Dominant components of the total force are shown as thin solid lines, and smaller, as dashed lines; the gray arrows represent the overall force direction. See also Figures S29–S32 in the Supporting Information.
In ROPP4+•, FPpP prevails in the entire range of x, so the ground adiabatic state has only one minimum in the middle due to the high energetic cost of shifting the hole toward an end of the chain; the same holds true for ROPP3+• and iAPPn+• with n ≤ 7 (Figures S29–S32 in the Supporting Information). On the other hand, in ROPPn+• with n ≥ 5, the GPpP curve flattens in the middle due to saturation, so the hole can migrate without much energetic penalty toward a terminal unit, whose strong hole-stabilizing ability attracts a significant fraction of the hole (∼40%) and thus causes its significant deformation and pronounced double-minimum ground state curve. Because the iso-alkyl-capped, the terminal units are much less efficient in terms of hole stabilization, hole retains its shape, and it shifts only marginally toward an end for longer chains, n ≥ 8 (Figures S31 and S32 in the Supporting Information).
In the middle of the chain, the ground state energy RG1 of end-capped RPPn+• is determined by the GPpP component, which monotonously increases in magnitude up to n ≃ 7 and then levels off, and the GR component which sharply decreases in magnitude for n > 2 (Figure 12). Thus, the energy at the midpoint of the ground state curve smoothly increases with n for ROPPn+•, where the GR component dominates due to large Δε/λ value or smoothly decreases for iAPPn+•, where the GPpP component dominates. At the polymeric limit, the midpoint ground state energies for all three RPPn+• series converge to the same value determined by GPpP. Thus, for all HPPn+• as well as for iAPPn+• with n ≤ 7, the Eox and νmax smoothly evolve toward the polymeric limit, because their ground state curves have a single minimum in the middle. However, in ROPPn+• with n > 4 and in iAPPn+• with n > 7, emergence of the two-minima ground state shape shifts the hole toward an end of the chain, thereby leading to rapid Eox and νmax saturation and breakdown of their approximate 1/n dependences.
Figure 12.
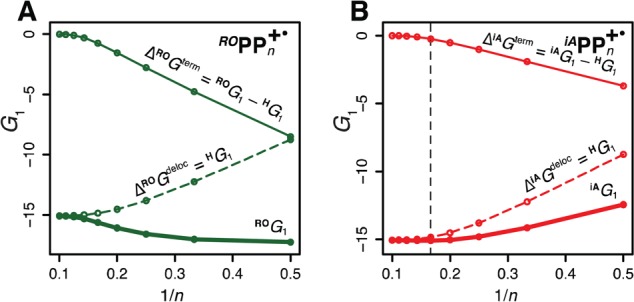
Adiabatic ground state energies at the middle of the chain for ROPPn+• (A) and iAPPn+• (B) vs 1/n (thick solid lines) and their components GPpP (stabilization due to poly-p-phenylene chain, dashed lines) and GR (stabilization due to end-capping groups, thin solid lines).
The subtle differences in 1/n dependences observed for iAPPn+• in comparison with HPPn+• arise because the hole shrinks from seven to six p-phenylene units when it shifts toward a terminal unit in longer iAPPn+•. Due to the shift of the hole toward a terminal unit in iAPPn+• (Figure 10), further addition of p-phenylene units has a little effect, which leads to earlier Eox saturation. Also, vertical excitation in iAPPn+• with the hole shifted toward an end of the chain leads to a deformed hole distribution at the Franck–Condon point, which results in early 1/n breakdown of νmax in iAPPn+• vs HPPn+• series.
Coexistence of the Two Forms of ROPP5+•
The observation of the two absorption bands at 6452 cm–1 (1550 nm) and 5050 cm–1 (1980 nm) in the ROPP5+• spectrum suggests the presence of two species. In the preceding discussion, we used the slightly more intense absorption band at 6452 cm–1 which falls in line with higher ROPPn+• oligomers, n = 6–7 (Figure 3B). However, when the less intense 5050 cm–1 band is included in the νmax vs 1/n plot (Figure 13A), it nearly perfectly falls on the linear 1/n relation observed for shorter ROPPn+• chains, n = 2–4, that suggests that this second form may correspond to the structure with a symmetrically distributed hole, similar to shorter ROPPn+•, n = 2–4.
Figure 13.
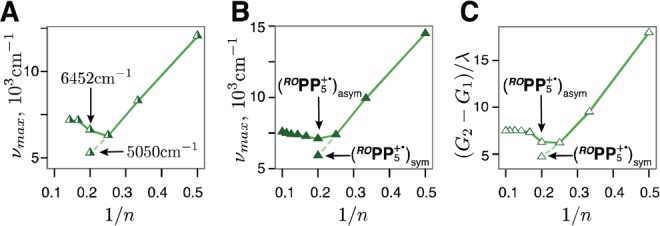
Experimental excitation energies vs 1/n for ROPPn+• including both ROPP5+• absorption bands 6452 cm–1 and 5050 cm–1 (A), and the corresponding DFT (B) and MPM (C) plots including the excitation energies for (ROPP5+•)asym with the hole asymmetrically displaced towards an end of the chain, and (ROPP5+•)sym with the hole symmetrically distributed in the middle, Figure S36 in Supporting Information. Also see Figures 1B, 3B, and 9B.
Indeed, we were able to locate this structure with a symmetrically distributed hole using DFT (Figure S36, Supporting Information) and calculate the corresponding vertical excitation energy that again falls on the linear 1/n dependence of the νmax values observed for n = 2–4 (Figure 13B). Furthermore, the energy gap between the ground and excited state MPM curves of ROPP5+• (Figure 8B) that corresponds to the excitation from the middle of the ground state curve again aligns with the 1/n linear relationship for n = 2–4 (Figure 13C). This remarkable consistency between the experimental, DFT, and MPM pictures strongly supports the assignment of the second absorption maximum at 5050 cm–1 in the ROPP5+• spectrum to the higher-energy form with a symmetrically distributed hole. Thus, ROPP5+• appears to be an intermediate case that falls between the two regimes of hole delocalization in the ROPPn+• series, with a symmetrically distributed hole (n ≤ 4) and with the hole shifted toward a terminal unit (n ≥ 6), as is elegantly illustrated by the evolution of the MPM ground state curves in Figure 8B.48
Summary and Conclusions
Here, on the basis of the experimental and computational results as well as the multistate parabolic model, we delineated the factors that determine the redox and optoelectronic properties of RPPn/RPPn+• with different end-capping substituents (R = iA, H, and OR). DFT calculations with a modified B1LYP density functional (B1LYP-40), calibrated against the existing experimental data for the iAPPn/iAPPn+• series14 and validated against the newly synthesized ROPPn+• series, showed a dramatic effect of the end-capping groups on the Eox and νmax evolution for iAPPn+• and ROPPn+• (Figures 1 and 3). While Eox decreases in nearly 1/n fashion for HPPn, before leveling off at the polymeric limit, introduction of a strong electron-donating substituent −OR leads to an increase in the Eox values with leveling off for n > 5. Evolution of the oxidation energies in the weakly electron-donating groups in the iAPPn series is similar to the uncapped series, whereas the νmax evolution in iAPPn+• is more similar to ROPPn+•, as it demonstrates abrupt saturation at n = 8.
To rationalize these results, we developed a multistate parabolic model (MPM), an extension of the well-known Marcus two-state parabolic model. The MPM employs an arbitrary number of energetically equivalent parabolas for linearly connected p-phenylene units and lower-energy parabolas for the end-capped terminal units. Using only two effective parameters—Hab/λ, responsible for electronic coupling between p-phenylene units, and Δε/λ, the shift of the terminal unit energies—the MPM was able to reproduce the hole distribution patterns and the evolution of the Eox and νmax energies in all three RPPn/RPPn+• series. The MPM shows that the RPPn+• properties are determined by the hole distribution across the molecule, and that there are two forces that pull the hole in opposite directions: one toward the middle of the chain, where it is stabilized by the p-phenylene chain, and another toward the lower-energy terminal units. The subtle interplay between these two forces that determines the position/distribution of the hole entails the key role of the end-capping substituents R in RPPn+•. Thus, even presumably innocent modulation of R could result in a sizable modulation of the RPPn/RPPn+• optoelectronic properties.
The confluence and remarkable accord between the experimental, computational, and MPM approaches, evident from comparison of Figures 1, 3, and 9, provide a unified picture of the chemical underpinnings behind the structure–property relationships in π-conjugated aromatic polymers RPPn+•/RPPn+•. This simple conceptual model can now guide the rational design of new π-conjugated systems whose properties can first be predicted using the MPM that can help to pinpoint the required parameters of the interconnected units in the conjugated polymeric π-system. The combined investigative approach elaborated in this work can be readily applied to more complex donor–spacer–acceptor systems and doped molecular wires and will allow the design and study of the next generation materials for long-range charge transport and photochromic molecules.
Acknowledgments
We thank the NSF and NIH for financial support and Prof. Scott A. Reid, Maxim Ivanov, and Alexander Semenov for helpful discussions. The calculations were performed on the high-performance computing cluster Père at Marquette University funded by NSF awards OCI-0923037 and CBET-0521602 and the Extreme Science and Engineering Discovery Environment (XSEDE) funded by NSF (TG-CHE130101).
Glossary
Abbreviations
- MPM
multistate parabolic model
- CR
cation radical
- SIE
self-interaction error
- DFT
density functional theory
- HF
Hartree–Fock
- PCM
polarized continuum model
- NMR
nuclear magnetic resonance
- MALDI
matrix-assisted laser desorption/ionization
- SCE
standard calomel electrode
Supporting Information Available
Experimental details, including cyclic voltammograms, computational details including the calibration of the DFT exchange-correlation functional, and additional details regarding the multistate parabolic model, Figures S1–S36, Tables S1–S13, and the coordinates and energies of the calculated structures. This material is available free of charge via the Internet at http://pubs.acs.org.
Author Contributions
The manuscript was written through contributions of all authors. All authors have given approval to the final version of the manuscript.
The authors declare no competing financial interest.
Funding Statement
National Institutes of Health, United States
Supplementary Material
References
- Petty M. C.; Bryce M. R.; Bloor D.. An Introduction to Molecular Electronics; Oxford University Press: New York, 1995; pp 1–387. [Google Scholar]
- Gross M.; Muller D. C.; Nothofer H.-G.; Scherf U.; Neher D.; Brauchle C.; Merrholz K. Improving the Performance of Doped π-Conjugated Polymers for Use in Organic Light-emitting Diodes. Nature (London) 2000, 405, 661–665. [DOI] [PubMed] [Google Scholar]
- Grimsdale A. C. In Search of Stable Blue Emission from Phenylene-based Conjugated Polymers. Curr. Org. Chem. 2010, 14, 2196–2217. [Google Scholar]
- Li C.; Liu M.; Pschirer N. G.; Baumgarten M.; Muellen K. Polyphenylene-based Materials for Organic Photovoltaics. Chem. Rev. 2010, 110, 6817–6855. [DOI] [PubMed] [Google Scholar]
- Guo X.; Baumgarten M.; Muellen K. Designing π-Conjugated Polymers for Organic Electronics. Prog. Polym. Sci. 2013, 38, 1832–1908. [Google Scholar]
- Gale D. M. Properties of Fabricated Poly-p-phenylene. J. Appl. Polym. Sci. 1978, 22, 1971–1976. [Google Scholar]
- Meghdadi F.; Tasch S.; Winkler B.; Fischer W.; Stelzer F.; Leising G. Blue Electroluminescence Devices Based on Parahexaphenyl. Synth. Met. 1997, 85, 1441–1442. [Google Scholar]
- Bredas J.-L.; Beljonne D.; Coropceanu V.; Cornil J. Charge-Transfer and Energy-Transfer Processes in π-Conjugated Oligomers and Polymers: A Molecular Picture. Chem. Rev. 2004, 104, 4971–5003. [DOI] [PubMed] [Google Scholar]
- Weiss E.; Wasielewski M.; Ratner M.. Molecules as Wires: Molecule-Assisted Movement of Charge and Energy. Molecular Wires and Electronics; Springer: Berlin, Heidelberg, 2005; Vol. 257, pp 103–133. [DOI] [PubMed] [Google Scholar]
- Grimsdale A.; Müllen K.. Polyphenylene-type Emissive Materials: Poly(para-phenylene)s, Polyfluorenes, and Ladder Polymers. Emissive Materials Nanomaterials; Springer: Berlin, Heidelberg, 2006; Vol. 199, pp 1–82. [Google Scholar]
- Merz T. A.; Waddell P. G.; Cole J. M. Systematic Molecular Design of p-Phenylene Lasing Properties. J. Phys. Chem. C 2013, 117, 8429–8436. [Google Scholar]
- Weiss E. A.; Ahrens M. J.; Sinks L. E.; Gusev A. V.; Ratner M. A.; Wasielewski M. R. Making a Molecular Wire: Charge and Spin Transport Through Para-phenylene Oligomers. J. Am. Chem. Soc. 2004, 126, 5577–5584. [DOI] [PubMed] [Google Scholar]
- Weiss E. A.; Tauber M. J.; Kelley R. F.; Ahrens M. J.; Ratner M. A.; Wasielewski M. R. Conformationally Gated Switching Between Superexchange and Hopping Within Oligo-p-phenylene-based Molecular Wires. J. Am. Chem. Soc. 2005, 127, 11842–11850. [DOI] [PubMed] [Google Scholar]
- Banerjee M.; Shukla R.; Rathore R. Synthesis, Optical, and Electronic Properties of Soluble Poly-p-phenylene Oligomers as Models for Molecular Wires. J. Am. Chem. Soc. 2009, 131, 1780–1786. [DOI] [PubMed] [Google Scholar]
- Banerjee M.; Lindeman S. V.; Rathore R. Structural Characterization of Quaterphenyl Cation Radical: X-ray Crystallographic Evidence of Quinoidal Charge Delocalization in Poly-p-phenylene Cation Radicals. J. Am. Chem. Soc. 2007, 129, 8070–8071. [DOI] [PubMed] [Google Scholar]
- Cohen A. J.; Mori-Sanchez P.; Yang W. Insights into Current Limitations of Density Functional Theory. Science 2008, 321, 792–794. [DOI] [PubMed] [Google Scholar]
- Renz M.; Theilacker K.; Lambert C.; Kaupp M. A Reliable Quantum-chemical Protocol for the Characterization of Organic Mixed-valence Compounds. J. Am. Chem. Soc. 2009, 131, 16292–16302. [DOI] [PubMed] [Google Scholar]
- Cohen A. J.; Mori-Sanchez P.; Yang W. Challenges for Density Functional Theory. Chem. Rev. 2012, 112, 289–320. [DOI] [PubMed] [Google Scholar]
- Körzdörfer T.; Brédas J.-L. Organic Electronic Materials: Recent Advances in the DFT Description of the Ground and Excited States Using Tuned Range-Separated Hybrid Functionals. Acc. Chem. Res. 2014, 10.1021/ar500021t. [DOI] [PubMed] [Google Scholar]
- A removal of one electron from a neutral donor produces a cation radical which was coined as the term “hole” by N. Bauld. In this study, the use of the term hole also encompasses reorganization of electron density and structural and solvent rearrangements.
- Dierksen M.; Grimme S. The Vibronic Structure of Electronic Absorption Spectra of Large Molecules: A Time-Dependent Density Functional Study on the Influence of ″Exact″ Hartree-Fock Exchange. J. Phys. Chem. A 2004, 108, 10225–10237. [Google Scholar]
- Félix M.; Voityuk A. A. DFT Performance for the Hole Transfer Parameters in DNA π Stacks. Int. J. Quantum Chem. 2011, 111, 191–201. [Google Scholar]
- Bravaya K. B.; Epifanovsky E.; Krylov A. I. Four Bases Score a Run: Ab Initio Calculations Quantify a Cooperative Effect of H-Bonding and π-Stacking on the Ionization Energy of Adenine in the AATT Tetramer. J. Phys. Chem. Lett. 2012, 3, 2726–2732. [DOI] [PubMed] [Google Scholar]
- Renz M.; Kaupp M. Predicting the Localized/Delocalized Character of Mixed-Valence Diquinone Radical Anions. Toward the Right Answer for the Right Reason. J. Phys. Chem. A 2012, 116, 10629–10637. [DOI] [PubMed] [Google Scholar]
- Parthey M.; Kaupp M. Quantum-chemical Insights into Mixed-valence Systems: Within and Beyond the Robin-Day Scheme. Chem. Soc. Rev. 2014, 43, 5067–5088. [DOI] [PubMed] [Google Scholar]
- Renz M.; Kess M.; Diedenhofen M.; Klamt A.; Kaupp M. Reliable Quantum Chemical Prediction of the Localized/Delocalized Character of Organic Mixed-Valence Radical Anions. From Continuum Solvent Models to Direct-COSMO-RS. J. Chem. Theory Comput. 2012, 8, 4189–4203. [DOI] [PubMed] [Google Scholar]
- Yang J.; Zhang W.; Si Y.; Zhao Y. Intramolecular Electronic Couplings in Class II/III Organic Mixed-Valence Systems of Bis(1,4-dimethoxybenzene). J. Phys. Chem. B 2012, 116, 14126–14135. [DOI] [PubMed] [Google Scholar]
- Adamo C.; Barone V. Toward Reliable Adiabatic Connection Models Free from Adjustable Parameters. Chem. Phys. Lett. 1997, 274, 242–250. [Google Scholar]
- In the DFT calculations, we used iso-propyl as a truncated model of the 6-tetradecyl (iA) end-capping substituent and methoxy group as a truncated model of the 9-heptadecyloxy (RO) end-capping substituent.
- Meerholz K.; Heinze J. Solid State Electrochemical Experiments on Defined Oligomers of the Poly-p-phenylene-series as Models of Conducting Polymers. Synth. Met. 1991, 43, 2871–2876. [Google Scholar]
- Meerholz K.; Heinze J. Electrochemical Solution and Solid-state Investigations on Conjugated Oligomers and Polymers of the α-Thiophene and the p-Phenylene Series. Electrochim. Acta 1996, 41, 1839–1854. [Google Scholar]
- The energetically most stable alternant and helical conformations have been used for neutral molecules and cation radicals, respectively. Alternative conformations are marginally (0.03–0.29 kcal/mol also in the footnote; see Table S9, Supporting Information) higher in energy, and have very similar progression of redox and optoelectronic properties, as detailed in the Supporting Information, section S4.
- Electronic structure calculations were performed with the Gaussian 09 package, revision C01: Frisch M. J.; et al. Gaussian 09, revision C01; Gaussian, Inc.: Wallingford, CT, 2009. See the Supporting Information for the complete reference and further computational details.
- Ronlan A.; Coleman J.; Hammerich O.; Parker V. D. Anodic Oxidation of Methoxybiphenyls. Effect of the Biphenyl Linkage on Aromatic Cation. J. Am. Chem. Soc. 1974, 96, 845–849. [Google Scholar]
- Hassan J.; Sevignon M.; Gozzi C.; Schulz E.; Lemaire M. Aryl-aryl Bond Formation One Century After the Discovery of the Ullmann Reaction. Chem. Rev. 2002, 102, 1359–1469. [DOI] [PubMed] [Google Scholar]
- Suzuki A. Carbon-carbon Bonding Made Easy. Chem. Commun. 2005, 4759–4763. [DOI] [PubMed] [Google Scholar]
- Rathore R.; Burns C. L.; Deselnicu M. I. Multiple-Electron Transfer in a Single Step. Design and Synthesis of Highly Charged Cation-Radical Salts. Org. Lett. 2001, 3, 2887–2890. [DOI] [PubMed] [Google Scholar]
- The observed separation of the vibronic peaks, ∼1300 cm–1, is similar to the emission spectra of neutral iAPPn (ref (14)), and likely corresponds to the backbone C–C vibrations:Heimel G.; Daghofer M.; Gierschner J.; List E. J. W.; Grimsdale A. C.; Müllen K.; Beljonne D.; Brédas J.-L.; Zojer E. Breakdown of the Mirror Image Symmetry in the Optical Absorption/Emission Spectra of Oligo(para-phenylene)s. J. Chem. Phys. 2005, 122, 054501-1–054501-11. [DOI] [PubMed] [Google Scholar]
- Unpaired spin density plots in Figure 4 have regions with expected excess beta spin density (blue), as well as the regions with excess alpha spin density (red). This spin polarization is observed for the units that underwent quinoidal distortion of the geometry; thus, if in the vertically excited state, the hole is partially transferred to nondistorted units (Figure 4B′); these units only have the regions with excess beta spin density, i.e., no noticeable spin polarization.
- Hush N. S. Intervalence-transfer Absorption. II. Theoretical Considerations and Spectroscopic Data. Prog. Inorg. Chem. 1967, 8, 391–444. [Google Scholar]
- Robin M. B.; Day P. Mixed Valence Chemistry. A Survey and Classification. Adv. Inorg. Chem. Radiochem. 1967, 10, 247–422. [Google Scholar]
- Marcus R. A.; Sutin N. Electron Transfers in Chemistry and Biology. Biochim. Biophys. Acta, Rev. Bioenerg. 1985, 811, 265–322. [Google Scholar]
- Brunschwig B. S.; Creutz C.; Sutin N. Optical Transitions of Symmetrical Mixed-valence Systems in the Class II-III Transition Regime. Chem. Soc. Rev. 2002, 31, 168–184. [DOI] [PubMed] [Google Scholar]
- McConnell H. M. Intramolecular Charge Transfer in Aromatic Free Radicals. J. Chem. Phys. 1961, 35, 508–515. [Google Scholar]
- Whereas a value of Hab/λ = 9 reproduces the hole distribution accurately in various HPPn cation radicals, an increase of the Hab/λ beyond 9 leads to a more extended delocalization and a decrease below 9 leads to a more compact hole.
- Willms A. R. Analytic Results for the Eigenvalues of Certain Tridiagonal Matrices. SIAM J. Matrix Anal. Appl. 2008, 30, 639–656. [Google Scholar]
- Interestingly, a transition from the one-minimum regime (n ≤ 7) to the two-minima regime (n ≥ 8) in the case of R = iA is accompanied by a slight shrinking of the hole from seven to six units. This effect can be understood in the light of the fact that involvement of both terminal units for the hole stabilization would require a deformation of the hole, which has to “stretch” to occupy both ends of the chain. Up to n = 7, this deformation is small, and the hole can reside in the middle of the chain without a large energetic penalty. However, starting from n = 8, the energy of the hole deformation exceeds stabilization by both terminal units, and the hole migrates towards one end.
- According to the DFT and MPM, the ROPP5+• structure with a symmetrically distributed hole should correspond to a very small maximum on the potential energy surface (0.3 kcal/mol higher in energy than the stable asymmetric structure, from the DFT calculations). Thus, experimentally observed significant population of this structure may arise due to dynamic hole transfer between the two ends of the molecule, enabled by the very low barrier for such a transfer; this then may suggest that the symmetric structure corresponds to a shallow minimum on the free energy surface. Experimental verification of this interpretation using X-ray crystallography is underway.
Associated Data
This section collects any data citations, data availability statements, or supplementary materials included in this article.


