Abstract
Objectives:
Bone loss around dental implants is generally measured by monitoring changes in marginal bone level using radiographs. After the first year of implantation, an implant should have <0.2 mm annual loss of marginal bone level to satisfy the criteria of success. However, the process of measuring marginal bone level on radiographs has a precision of 0.2 mm (or more) owing to variations in exposure geometry, exposure time and observer perception. Therefore, the value of the annual loss may vary considerably, especially when short intervals are considered. This study investigates how the success rate of dental implants depends on the way annual bone loss is calculated.
Methods:
Panoramic radiographs of 82 implant patients with an average follow-up of 10.4 years were analysed. Marginal bone levels near the implants were indicated by one observer. The annual loss of marginal bone level was determined according to four different calculation methods.
Results:
The methods yielded success rates of 9%, 45%, 81% and 89%.
Conclusions:
The success rate of dental implants measured on radiographs greatly depends on the details of the calculation method. Without rigorous standardization, annual bone loss and implant success rate are not well defined.
Keywords: marginal distance, radiographs, noise, criteria, success rate
Introduction
After extraction of all the teeth, dentures are commonly fitted to enable eating and to restore facial appearance. Owing to mandibular bone resorption, the lower denture may lose retention and cause problems with eating, speech and appearance. In the past five decades, titanium dental implant systems have been widely used to support dentures and improve eating and speech. In spite of their popularity, implants do not solve all problems related with bone loss. Success of dental implants is a concern for patients, dentists, industries, insurance companies and healthcare systems. To be successful, an implant has to meet criteria with respect to function (chewing), tissue physiology (osseointegration), the absence of pain and user satisfaction.1 There has been much debate about objective criteria for implant success. In 1986, an extensive review of the literature on the best-known implants was published.2 In the following decades more review articles on the criteria for determining implant success were published.1,3–5
The criteria proposed by Albrektsson et al2 included immobility, absence of peri-implant radiolucencies, absence of pain, absence of infections and <0.2 mm vertical bone loss per year (except the first year). Some authors define alternative criteria for success that may involve pocket probing depth and bleeding.6,7 For the first year of service, some allow 1.0 mm of bone loss others allow 1.5 mm loss.1,8–10 Some studies do not apply the criterion of 0.2 mm maximum marginal bone loss per year.3,11,12 However, it is one of the most commonly used criteria for success.1,4–6,9,13
For most clinicians, implant failure represents the complete loss of the implant.6 An implant can be called a failure if osseointegration is failing, if there is clinical mobility, if normal use gives pain or if there is a peri-implant radiolucency owing to infection.1,9 Any implant that is removed is qualified as failing irrespective of the reason for removal.9,10 It is reported that 0.3% of International Team for Oral Implantology (ITI) implants are lost during the first year after surgery and 4.1% during the first 10 years.11 A literature study on seven commercially available implant systems reports 6% loss in the first year, 10% in the first 10 years and 12% in the 15 years after surgery.14 For the Straumann® Dental Implant system (Straumann AG, Waldenburg, Switzerland) 11% loss is reported for the first 10 years and 17% loss for the first 16 years.7
Implants that do not qualify as a success or as a failure are called surviving. Either they do not meet the criteria for success or they have not been tested with respect to the criteria for success.1,6,9
The present study focuses on measuring the marginal bone distance near implants on radiographs. It investigates how the number of implants meeting the criterion of 0.2-mm marginal bone loss per year depends on the way in which the annual marginal bone loss is determined.
Methods and materials
The Breda implant overdenture study was carried out at St Ignatius Teaching Hospital in Breda, Netherlands.15–21 The original study included 110 patients. To be included in the present study, two or more radiographs of sufficient quality were required. Radiographs that were compromised by blurring, non-linear distortions or metal necklaces were rejected. From the present study, 28 patients were excluded because radiographs were compromised or missing. The remaining 82 patients were included. There were 61 females and 21 males, all born between 1918 and 1961. They were edentulous in both jaws for 5 years or more. They had been wearing conventional complete dentures but resorption of the mandibular alveolar ridges had made the fitting of new dentures difficult. In the years 1991–94, they received ITI Bonefit® implants (Straumann AG, Waldenburg, Switzerland) in the lower jaw. Within the present study, 23 patients received 2 implants with ball attachments (2IBA), 31 received 2 implants connected with a bar (2ISB) and 28 received 4 implants connected by 3 bars (4ITB). The implant length varied between 6 and 12 mm. In total, 224 implants were included in this study.
Directly after implant surgery, the first panoramic radiograph was made. Subsequent follow-up radiographs were made with the same machine at intervals of 10–25 months. The average radiographic follow-up consisted 7.0 radiographs during 10.4 years. At an 8-year follow-up almost all patients were satisfied with their overdenture.20 There were 8 patients with 15 failing implants that had to be removed. In total, 578 radiographs were scanned using a flatbed scanner (Mikrotek ScanMaker 9800XL; Mikrotek International Inc., Hsinchu, Taiwan) with a resolution of 118 pixels per centimetre (300 dpi) on an 8-bit greyscale. For ease of evaluation, the digitized images were cropped around the part of the mandible containing the implants and the abutments.
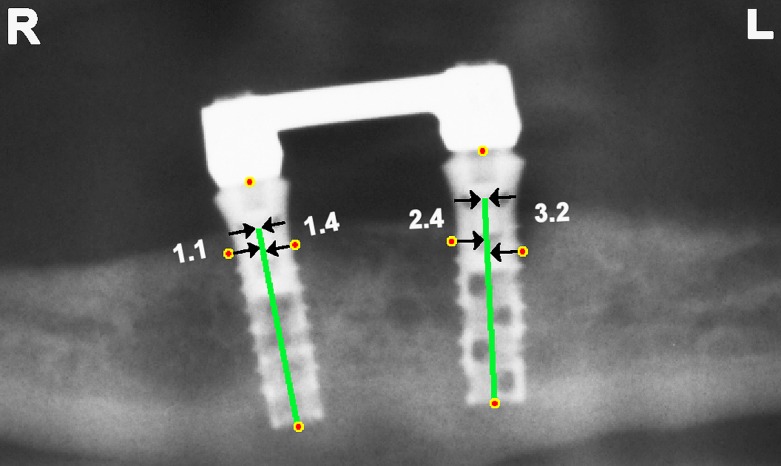
The 578 cropped radiographs were presented in random order to an observer who was a prosthodontist with 11 years of experience in interpreting dental radiographs. Distal and mesial of each implant, the observer indicated the marginal bone level. Also, the top of the implant neck and the apex of the implant body were indicated. To increase the precision of the indicated points, all images were presented four times and the corresponding co-ordinates were averaged (Figure 1).
Figure 1.
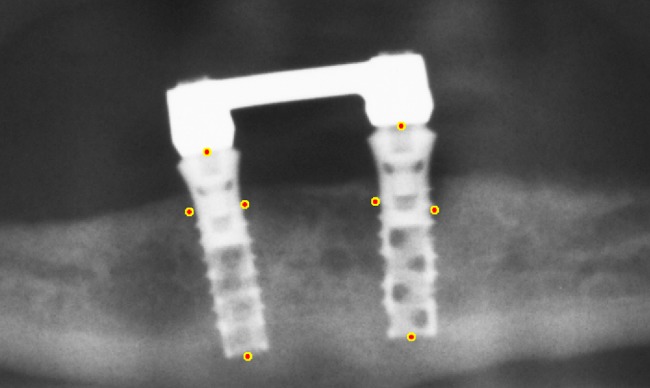
Marginal bone levels, top of implant neck and apex of implant body were indicated. The depicted points are obtained by averaging over four trials.
In contrast with the smooth neck of the implant, the surface of the implant body had been roughened for better osseointegration. Therefore, it was decided to determine the marginal distance with respect to the top of the implant body. Knowing the length of neck and body, the top of the implant body was located. Each marginal bone level point was projected orthogonally on the central axis. Then the distance from the projected point to the top of the implant body was calculated in pixels and converted to millimetres with the help of the known length of the implant body (Figure 2).
Figure 2.
Two implants with body of 12-mm length and neck of 2.8 mm. Marginal bone levels are projected on the central axis of the implant body. The distance of the projected point to the top of the implant body is calculated in millimetres using the length of the implant body. Marginal distances from right to left: 1.1, 1.4, 2.4 and 3.2 mm.
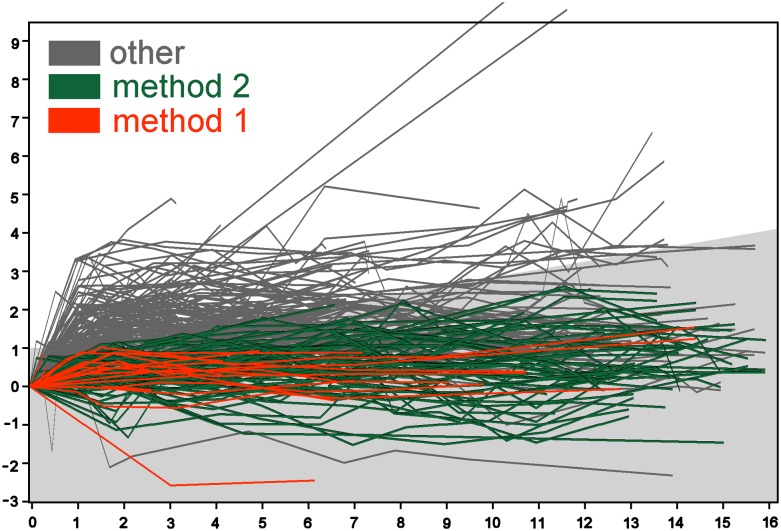
The criteria for successful implants allow a loss of 0.2 mm per year; only in the first year after implantation, a loss of 1.0–1.5 mm is allowed. Four methods were devised to calculate the annual bone loss according to these criteria. The first method measured the momentary rate of bone loss as the difference in bone levels at two consecutive visits divided by the time between the visits. If the momentary rate (mesial and distal) was 1.0 mm per year (or less) during the first year and 0.2 mm per year (or less) during all the following years, the implant was classified successful. The second method compared every follow-up visit with the first visit. It checked if the bone loss was less than the maximum loss allowed for successful implants. For example, after 5 years, the maximum bone loss allowed was 1.0 + 4 × 0.2 = 1.8 mm. In Figures 4 and 5, the grey-shaded area indicates allowed losses. An implant was classified successful if at all visits the amount of loss (mesial and distal) was allowed.
Figure 4.
Changes in marginal distance (mm) vs year after implantation. The first measurement of marginal distance is used as a baseline. Mesial and distal changes are calculated, but only the highest value is plotted. Method 1 pertains to the implants meeting the strictest criteria. Method 2 pertains to the implants meeting the relaxed criteria. The region of bone loss allowed by Methods 2 and 3 is shaded grey.
Figure 5.
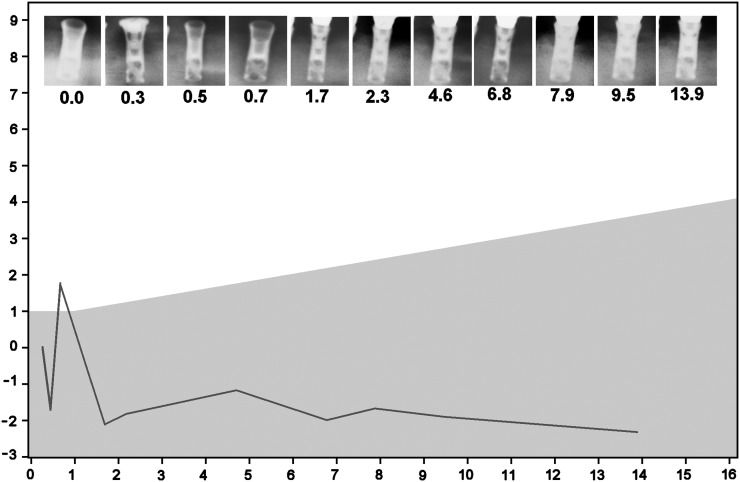
Changes in marginal distance (mm) vs year after implantation. Example of a successful implant according to Methods 3 and 4 but not according to Methods 1 and 2. Owing to one single radiograph, made 0.7 years after implantation, the marginal distance rises 3.5 mm and then falls 3.9 mm during the next year. The region of bone loss allowed by Methods 2 and 3 is shaded grey.
The third method considered only the long-term bone loss. It used the bone level at the first and last visit and ignored all visits in-between. It classified an implant successful if the amount of loss (mesial and distal) between the first and the last visit was less than the maximum loss allowed. Similarly, the fourth method considered the first and last visits only, but it ignored the mesial side of the implants and it allowed 1.5 mm loss during the first year (and 0.2 mm in every following year).
The statistical tests considered only the distal side of one implant per patient. The average rate of marginal bone loss was estimated by taking the difference between the first and last measured level divided by the length of the corresponding time interval. To test the dependence of marginal bone level with time, the one sample t-test was applied to test if the average speed was zero or non-zero. To compare failing implants with surviving implants, the Behrens–Fisher two sampled t-test was used to test the corresponding average speeds. Both tests were performed with SPSS v. 21 (SPSS Inc., Chicago, IL).
Results
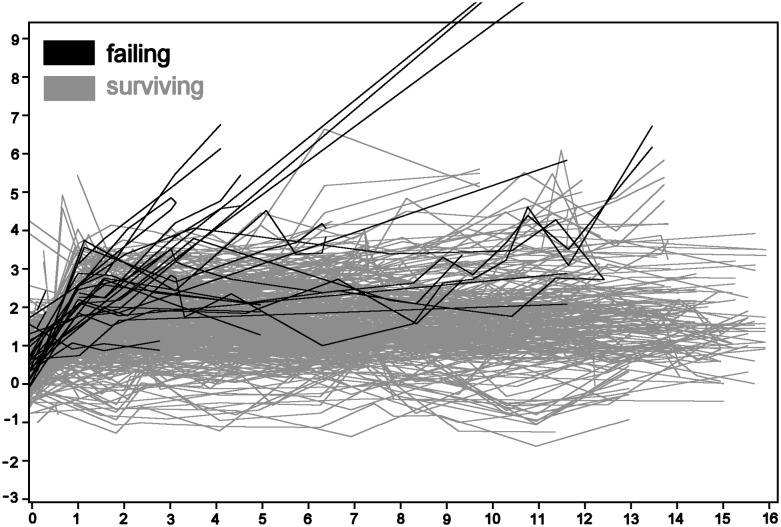
For each implant, the marginal distance of the mesial and distal sides were plotted vs the time since insertion. Figure 3 gives an overview of the 224 × 2 plots. The plots of failing implants were drawn in dark colour over the plots of the surviving implants that were drawn in grey. One patient had two implants of 12 mm with bone loss all along the implants (10.9, 11.9 and 12.0 mm). The three plots running off the scale correspond to these two implants. Negative values of the marginal distance correspond to pockets coronal to the implant body and the bone touching the smooth implant neck. The lowest value was −1.58 mm, 11 years after surgery, corresponding to the marginal bone level of 1.58 mm coronal of the reference point. The changes in the marginal distance were calculated using the first measurement as baseline value (Figure 4). Changes were calculated mesial and distal, and the highest value was plotted.
Figure 3.
Follow-up plots of marginal distance (mm) vs years after operation. Both distal and mesial sides are plotted. The plots running out of the scale correspond with two failing implants of the same patient. Negative marginal distances correspond with deeply placed implants (bone touching the implant neck).
From the 224 implants in this study, only 21 implants met the strictest criteria for success as measured by Method 1. Methods 2, 3 and 4 yielded 101, 181 and 200 successful implants, respectively. The corresponding success rates are 9%, 45%, 81% and 89%.
In Figure 4, the plots marked “method 1” represent implants that are successful according to Methods 1 and 2. The plots marked “method 2” represent implants that are successful according to Method 2 but not according to Method 1.
The results of the first statistical tests are presented in Table 1. The average speed of bone loss was 0.19 ± 0.39 mm per year. The average speed was significantly non-zero, which implies a significant increase of the marginal distance with time (p < 0.001). Failing and surviving implants did not differ significantly.
Table 1.
Annual marginal bone loss
| Implants | n | Speed ± SD |
|---|---|---|
| Failing | 8 | 0.81 ± 0.95 mm per year |
| Surviving | 72 | 0.12 ± 0.17 mm per year |
| All | 80 | 0.19 ± 0.39 mm per year |
SD, standard deviation.
For testing the rate of bone loss and for comparing failing with surviving implants, one site per patient was taken into consideration. The annual loss was determined as the difference between the first and last bone level divided by the corresponding time interval. Speed was significantly non-zero (p < 0.001). Failing and surviving implants did not differ significantly.
Discussion
Figure 5 shows an implant that is successful according to Methods 3 and 4 but not according to Methods 1 and 2 because of the spike in the plot, which was caused by the radiograph made 0.7 years after surgery. In the chain of events from patient anatomy to radiographic projection and the observer measuring marginal bone distance, there are several sources of variation (noise) that affect the outcome distance. Differences in exposure geometry and exposure time affect the marginal bone levels that are perceived by the observer. The scanner that is used to digitize radiographs may impede the perception of small contrasts.22 Special purpose scanners, aiming devices and exposure protocols can be applied to suppress these sources of variations, however, radiographs are often made and processed in a non-standardized way. Furthermore, the perception of radiolucencies is so complex that different observers may yield different marginal distances when interpreting the same radiograph.8 Even when a radiograph is interpreted by the same observer, the resulting marginal distances can vary.8
The different results of Methods 1–4 to a large extent can be attributed to noise. When parallelism between implant and film is not guaranteed, the errors (noise) in measuring peri-implant bone level exceeds 0.5 mm.8,23 These errors (noise) are more than twice the annual loss of 0.2 mm permitted for successful implants. The essential difference between Methods 1–4 is the length of the time interval that is used to calculate the annual loss. Method 1 uses the shortest possible time interval; Methods 3 and 4 use the longest possible time interval. When calculating the rate of bone loss or the annual loss of bone, the difference in bone level is divided by the length of the interval; similarly, the precision must also be divided by the length of the interval. Therefore, it is understandable that noise on the measurements of the marginal bone levels affects Method 1 the most and Method 4 the least.
Using intraoral periapical radiographs instead of panoramic radiographs reduces the level of noise. Standardizing imaging geometry reduces the noise even more but a precision of <0.2 mm cannot be obtained.8,13,24,25 The probability of wrong classification can be estimated by assuming that the noise is gaussian. If the most precise method finds a bone loss of 0.1 mm in 1 year, then there is still a probability of 30% that the actual loss exceeds 0.2 mm and the implant should be disqualified. Similarly, if a loss of 0.1 mm in 3 years is found, then there is still a probability of 7% that the actual loss exceeds 0.2 mm. Obviously, it is difficult to prove the success of a particular implant even by means of intraoral periapical radiographs.
A drawback of the present study is the absence of a determination of the noise level in the determination of marginal bone changes. Such a determination would require repeated measurements on 15–30 patients by the same individual using the same equipment. Based on the root-mean-square standard deviation, the least significant change can be calculated that gives 95% confidence that a true biological change has been measured. However, because of radiation hygiene, only few such studies can be carried out. Studies on corpses with artificial bone lesions may also provide estimations of noise levels assuming that the lesions are sufficiently realistic. The present study took the measurements at their face value to demonstrate different outcomes of various counting methods. Because of the relative high level of noise, it can be taken for granted that many changes are noise rather than biological changes.26 Discussions on success rates of dental implants should consider how to deal with the uncertainties that are inherent to the measuring methods.
Albrektsson and Isidor10 define the radiographic criteria for success using the term “average marginal bone loss”. But the length of the time interval over which the marginal bone loss is to be averaged is not mentioned. The present study shows that many implants are successful only if the time interval is sufficiently long. When the level of noise exceeds the rate of annual bone loss that is permitted for successful implants, it takes several years to prove the success of an implant with acceptable levels of certainty. As long as success rates depend on the details of the calculation procedure for the annual bone loss, it can be said that the radiographic criteria for successful dental implants are ambiguous. It is concluded that the radiographic criteria for success of dental implants lack standardization.
References
- 1.Esposito M, Hirsch JM, Lekholm U, Thomsen P. Biological factors contributing to failures of osseointegrated oral implants. (I) Success criteria and epidemiology. Eur J Oral Sci 1998; 106: 527–51. [DOI] [PubMed] [Google Scholar]
- 2.Albrektsson T, Zarb G, Worthington P, Eriksson AR. The long-term efficacy of currently used dental implants: a review and proposed criteria of success. Int J Oral Maxillofac Implants 1986; 1: 11–25. [PubMed] [Google Scholar]
- 3.Chaytor DV. Clinical criteria for determining implant success: bone. Int J Prosthodont 1993; 6: 145–52. [PubMed] [Google Scholar]
- 4.Smith DE, Zarb GA. Criteria for success of osseointegrated endosseous implants. J Prosthet Dent 1989; 62: 567–72. [DOI] [PubMed] [Google Scholar]
- 5.Wyatt CC, Pharoah MJ. Imaging techniques and image interpretation for dental implant treatment. Int J Prosthodont 1998; 11: 442–52. [PubMed] [Google Scholar]
- 6.Karoussis IK, Brägger U, Salvi GE, Bürgin W, Lang NP. Effect of implant design on survival and success rates of titanium oral implants: a 10-year prospective cohort study of the ITI Dental Implant System. Clin Oral Implants Res 2004; 15: 8–17. [DOI] [PubMed] [Google Scholar]
- 7.Simonis P, Dufour T, Tenenbaum H. Long-term implant survival and success: a 10–16-year follow-up of non-submerged dental implants. Clin Oral Implants Res 2010; 21: 772–7. doi: 10.1111/j.1600-0501.2010.01912.x [DOI] [PubMed] [Google Scholar]
- 8.De Smet E, Jacobs R, Gijbels F, Naert I. The accuracy and reliability of radiographic methods for the assessment of marginal bone level around oral implants. Dentomaxillofac Radiol 2002; 31: 176–81. doi: 10.1038/sj/dmfr/4600694 [DOI] [PubMed] [Google Scholar]
- 9.Romeo E, Lops D, Margutti E, Ghisolfi M, Chiapasco M, Vogel G. Long-term survival and success of oral implants in the treatment of full and partial arches: a 7-year prospective study with the ITI dental implant system. Int J Oral Maxillofac Implants 2004; 19: 247–59. [PubMed] [Google Scholar]
- 10.Albrektsson T, Isidor F. Consensus report of session IV. In: Lang NP, Karring T, eds. Proceedings of the 1st European Workshop on Periodontol. London, UK: Quintessence Publishing Co, Ltd; 1994. pp. 365–9. [Google Scholar]
- 11.Ferrigno N, Laureti M, Fanali S, Grippaudo G. A long-term follow-up study of non-submerged ITI implants in the treatment of totally edentulous jaws. Part I: ten-year life table analysis of a prospective multicenter study with 1286 implants. Clin Oral Implants Res 2002; 13: 260–73. [DOI] [PubMed] [Google Scholar]
- 12.Gallucci GO, Doughtie CB, Hwang JW, Fiorellini JP, Weber HP. Five-year results of fixed implant–supported rehabilitations with distal cantilevers for the edentulous mandible. Clin Oral Implants Res 2009; 20: 601–7. [DOI] [PubMed] [Google Scholar]
- 13.Benn DK. Estimating the validity of radiographic measurements of marginal bone height changes around osseointegrated implants. Implant Dent 1992; 1: 79–83. [PubMed] [Google Scholar]
- 14.Lambert FE, Weber HP, Susarla SM, Belser UC, Gallucci GO. Descriptive analysis of implant and prosthodontic survival rates with fixed implant-supported rehabilitations in the edentulous maxilla. J Periodontol 2009; 80: 1220–30. doi: 10.1902/jop.2009.090109 [DOI] [PubMed] [Google Scholar]
- 15.Wismeyer D, van Waas MA, Vermeeren, JI. Overdentures supported by ITI implants: a 6.5-year evaluation of patient satisfaction and prosthetic aftercare. Int J Oral Maxillofac Implants 1995; 10: 744–9. [PubMed] [Google Scholar]
- 16.Wismeijer D, Van Waas, MA, Vermeeren JI, Mulder J, Kalk W. Patient satisfaction with implant-supported mandibular overdentures. A comparison of three treatment strategies with ITI-dental implants. Int J Oral Maxillofac Surg 1997; 26: 263–7. [DOI] [PubMed] [Google Scholar]
- 17.Wismeijer D, van Waas MA, Mulder J, Vermeeren JI, Kalk W. Clinical and radiological results of patients treated with three treatment modalities for overdentures on implants of the ITI dental implant system. A randomized controlled clinical trial. Clin Oral Implants Res 1999; 10: 297–306. [DOI] [PubMed] [Google Scholar]
- 18.Stoker GT, Wismeijer D, van Waas MA. An eight-year follow-up to a randomized clinical trial of aftercare and cost-analysis with three types of mandibular implant-retained overdentures. J Dent Res 2007; 86: 276–80. [DOI] [PubMed] [Google Scholar]
- 19.Stoker G, van Waas R, Wismeijer D. Long-term outcomes of three types of implant-supported mandibular overdentures in smokers. Clin Oral Implants Res 2012; 23: 925–9. doi: 10.1111/j.1600-0501.2011.02237.x [DOI] [PubMed] [Google Scholar]
- 20.Timmerman R, Stoker GT, Wismeijer D, Oosterveld P, Vermeeren JI, van Waas MA. An eight-year follow-up to a randomized clinical trial of participant satisfaction with three types of mandibular implant-retained overdentures. J Dent Res 2004; 83: 630–3. [DOI] [PubMed] [Google Scholar]
- 21.Geraets WG, Verheij HG, Wismeijer D, van der Stelt PF. Detecting bone loss along dental implants by subtraction of panoramic radiographs. Clin Oral Implants Res 2012; 23: 861–5. doi: 10.1111/j.1600-0501.2011.02215.x [DOI] [PubMed] [Google Scholar]
- 22.Schulze RK, Rosing ST, D'Hoedt B. Contrast perception in digitized panoramic radiographs compared with their film-based origin. Oral Surg Oral Med Oral Pathol Oral Radiol Endod 2002; 94: 388–94. [DOI] [PubMed] [Google Scholar]
- 23.Schulze RK, d'Hoedt B. Mathematical analysis of projection errors in “paralleling technique” with respect to implant geometry. [Article in English, French, German.] Clin Oral Implants Res 2001; 12: 364–71. [DOI] [PubMed] [Google Scholar]
- 24.Akesson L, Håkansson J, Rohlin M. Comparison of panoramic and intraoral radiography and pocket probing for the measurement of the marginal bone level. J Clin Periodontol 1992; 19: 326–32. [DOI] [PubMed] [Google Scholar]
- 25.Meijndert L, Meijer HJ, Raghoebar GM, Vissink A. A technique for standardized evaluation of soft and hard peri-implant tissues in partially edentulous patients. J Periodontol 2004; 75: 646–51. doi: 10.1902/jop.2004.75.5.646 [DOI] [PubMed] [Google Scholar]
- 26.Benn DK. A review of the reliability of radiographic measurements in estimating alveolar bone changes. J Clin Periodontol 1990; 17: 14–21. [DOI] [PubMed] [Google Scholar]


