Abstract
Objective:
Real-time phase-contrast flow MRI at high spatiotemporal resolution was applied to simultaneously evaluate haemodynamic functions in the ascending aorta (AA) and superior vena cava (SVC) during elevated intrathoracic pressure (Valsalva manoeuvre).
Methods:
Real-time phase-contrast flow MRI at 3 T was based on highly undersampled radial gradient-echo acquisitions and phase-sensitive image reconstructions by regularized non-linear inversion. Dynamic alterations of flow parameters were obtained for 19 subjects at 40-ms temporal resolution, 1.33-mm in-plane resolution and 6-mm section thickness. Real-time measurements were performed during normal breathing (10 s), increased intrathoracic pressure (10 s) and recovery (20 s).
Results:
Real-time measurements were technically successful in all volunteers. During the Valsalva manoeuvre (late strain) and relative to values during normal breathing, the mean peak flow velocity and flow volume decreased significantly in both vessels (p < 0.001) followed by a return to normal parameters within the first 10 s of recovery in the AA. By contrast, flow in the SVC presented with a brief (1–2 heartbeats) but strong overshoot of both the peak velocity and blood volume immediately after pressure release followed by rapid normalization.
Conclusion:
Real-time phase-contrast flow MRI may assess cardiac haemodynamics non-invasively, in multiple vessels, across the entire luminal area and at high temporal and spatial resolution.
Advances in knowledge:
Future clinical applications of this technique promise new insights into haemodynamic alterations associated with pre-clinical congestive heart failure or diastolic dysfunction, especially in cases where echocardiography is technically compromised.
The Valsalva manoeuvre attempts to increase the intrathoracic pressure by a forceful expiration against a closed glottis, typically for a few seconds. The resulting haemodynamic response is characterized by a sinusoidal waveform of arterial pressure and stroke volume. The pattern is caused by an acute increase in intrathoracic pressure (Phase 1), a decreased stroke volume secondary to decreased venous return (Phase 2), an acute decrease of intrathoracic pressure during early recovery (Phase 3) and a subsequent increase in stroke volume accompanied by a reflex bradycardia (Phase 4).1
Current applications of the Valsalva manoeuvre focus on specific cardiovascular questions.2 For example, a clinical indication in combination with Doppler echocardiography to distinguish normal from pseudonormal mitral inflow in ventricular diastolic dysfunction.3 In general, however, the clinical relevance of the Valsalva manoeuvre suffers from difficulties in the non-invasive quantification of blood flow dynamics and the inability to assess haemodynamic functions simultaneously in the superior vena cava (SVC) and with respect to left-ventricular outflow.4 Moreover, because the manoeuvre is inevitably associated with a forced and increased breathing frequency during strain release, echocardiographic studies may be compromised by the lack of an appropriate acoustic window.
On the other hand, MRI techniques have emerged as a new diagnostic standard for simultaneous evaluation of left-ventricular and right-ventricular function.5 In particular, velocity-encoded phase-contrast flow MRI6–8 allows for a non-invasive quantification of blood flow in all major heart vessels.9,10 So far, however, a fundamental limitation of current cine MRI techniques is their dependency on the electrocardiogram (ECG), either for triggering or retrospective sorting of data acquisitions, and on measurements that cover multiple heartbeats (with or without breath holding). ECG-synchronized cine MRI is therefore not applicable for studying the immediate haemodynamic alterations associated with the Valsalva manoeuvre.
This problem may be overcome by real-time MRI as previously demonstrated using different technical approaches.11–15 Here, we present a new study of the cardiovascular responses to the Valsalva manoeuvre, which exploits recent progress in real-time MRI yielding improved spatiotemporal resolution and image quality.16,17 Respective extensions allow for dynamic measurements of cardiovascular function18,19 and blood flow20,21 in real time. In particular, the present study applies a real-time phase-contrast MRI technique for measuring through-plane flow at a temporal resolution of 40 ms and a spatial resolution of 1.33 mm.21 It offers a simultaneous assessment of flow in the ascending aorta (AA) and SVC. Quantification of blood flow is achieved for successive individual heartbeats and therefore provides access to the immediate cardiac and haemodynamic responses to medication, exercise or stress as, for example, imposed by changes of intrathoracic pressure. In this first study of healthy subjects, we evaluated the physiological responses to the Valsalva manoeuvre in more detail than possible by Doppler echocardiography.
METHODS AND MATERIALS
Subjects
We enrolled 20 healthy volunteers in this study but had to exclude 1 subject because of a cardiovascular risk factor (nicotine abuse). The remaining 19 subjects had a mean age of 33.9 ± 12.8 years (range, 22–59 years; 11 females and 8 males) and a body mass index of 22.8 ± 2.6 kg m−2. There were no contraindications for MRI. This prospective and single-centre study was approved by the institutional review board, and written informed consent was obtained from each subject before MRI. This study was in consent with the Declaration of Helsinki.
Real-time phase-contrast flow MRI
MRI was performed at 3 T (Siemens Tim Trio; Siemens Healthcare, Erlangen, Germany) with a standard 32-channel cardiac coil. Real-time flow studies were based on a highly undersampled radial gradient-echo sequence with image reconstruction by regularized non-linear inversion (NLINV)16 modified for phase-contrast flow MRI.20 Respective adjustments refer to phase-sensitive reconstructions of two series of differently flow-encoded images and the calculation of velocity-encoded phase-contrast maps without any temporal filter.20,21 The temporal fidelity of the iteratively estimated images was experimentally validated with the use of a specially designed motion phantom covering a range of velocities and image acquisition times.22 Excellent spatiotemporal acuity even of small and fast-moving objects was obtained for NLINV reconstructions without temporal filter.
Through-plane flow encoding was accomplished in a sequential manner using a bipolar flow-encoding gradient in every other image. Individual radial images were obtained from only seven spokes yielding a total acquisition time of 40 ms for one pair of images with and without flow-encoding gradient.21 T1 weighted images were acquired with repetition time, 2.86 ms; echo time, 1.93 ms; flip angle, 10°; field of view, 192 × 192 mm2; acquisition matrix, 144 × 144 (no aliasing because of radial acquisitions with two-fold oversampling); nominal in-plane resolution, 1.33 × 1.33 mm2; slice thickness, 6 mm; and velocity encoding, 200 cm s−1. Although not necessary for data acquisition, the ECG was co-registered to define time stamps for real-time images and thereby facilitate the evaluation of flow parameters during analysis.
Magnitude images and phase-contrast maps were reconstructed online with the use of a fully integrated “bypass” computer (sysGen/TYAN Octuple-GPU, ×2 Intel Westmere E5620 processor, 48 GB RAM; Sysgen, Bremen, Germany) to the host of the MRI system.23 It comprises 2 × 4 graphical processing units (GPUs; GeForce® GTX 580; NVIDIA®, Santa Clara, CA) and currently achieves NLINV reconstructions of about 13 magnitude images/phase-contrast maps per second.
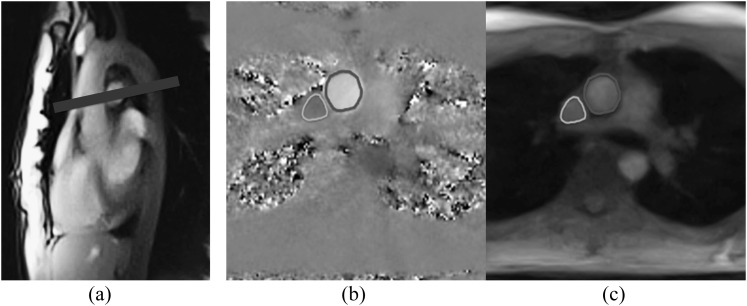
Blood flow was measured in the AA and SVC at the level of the right pulmonary artery perpendicular to the blood and vessel stream as shown in Figure 1. Localizer scans were performed during normal breathing and during a Valsalva manoeuvre before the actual measurements. Because of a possible change of position of the great vessels during pronounced pressure changes, the slice position was adapted when necessary.
Figure 1.
(a) Image orientation and (b, c) segmentation of the ascending aorta and superior vena cava (manually redrawn for better visibility) using real-time phase-contrast flow maps and magnitude images, respectively.
Valsalva manoeuvre and pressure measurement
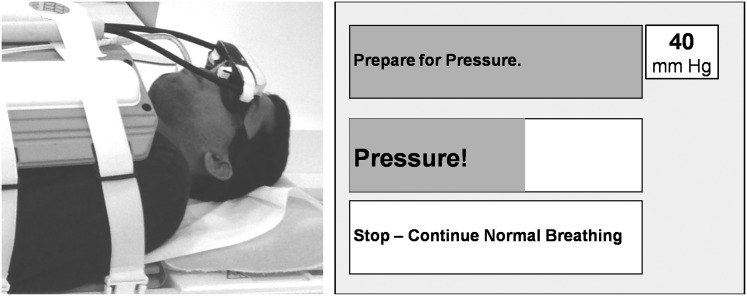
In order to perform a defined and controlled Valsalva manoeuvre, subjects were instructed to blow into a mouthpiece connected to a digital manometer (GMSD 2 BR; GREISINGER electronic GmbH, Regenstauf, Germany). Before MRI, this manoeuvre was trained to achieve optimum performance and reproducibility. The digital manometer outside the MRI system recorded pressure values every 1 ms. In all cases, the volunteers were asked to reach a target pressure of 40 mmHg for a duration of 10 s. Former studies defined this value as particularly effective to provoke haemodynamic alterations.24 As shown in Figure 2, subjects were given feedback during scanning by presenting a power-point version (Microsoft® Office power point 1997; Microsoft, Redmond, WA) of the timing protocol together with the actually achieved pressure via digital goggles.
Figure 2.
Set-up for real-time phase-contrast MRI of cardiac blood flow. (Left) Subject with digital glasses and mouthpiece attached to a digital manometer. (Right) Visual presentation of the breathing protocol with moving bars. During the Valsalva manoeuvre, the subject is requested to blow into the mouthpiece. (Upper right) The achieved pressure (target, 40 mmHg) is shown to the subject.
Real-time blood flow measurements were performed for a period of 40 s. The protocol comprised 10 s of normal breathing, 10 s of enhanced intrathoracic pressure (Valsalva manoeuvre) and 20 s of recovery after release of the pressure. After resting for about 5 min for general recovery, the manoeuvre was repeated three times.
Analysis of real-time flow MRI data
Functional flow parameters were derived from dynamic series of magnitude images and phase-contrast maps with the use of QFlow® v. 5.4 software modified to meet the challenges of large multicycle real-time MRI data sets (Medis, Medical Imaging Systems BV, Leiden, Netherlands). This software enables handling of >1000 images of a real-time MRI examination and provides an automatic separation into single heartbeats guided by time stamps of the co-registered ECG signal. Luminal segmentation of the AA and SVC was performed using visually controlled automatic contour detection as shown in Figure 1. If the automatic algorithm failed to find a proper solution, contours were manually adjusted (in about 5% of cases for the AA and 15% for the SVC). The analysis of each data set (both vessels) took about 30 min.
Extending previous studies,25,26 the analysis divided the data into five temporal phases:1 regular breathing, first 10 s of normal breathing;2 early strain, first four heartbeats during Valsalva manoeuvre;3 late strain, last four heartbeats during Valsalva manoeuvre;4 early recovery, first three heartbeats after the end of the Valsalva manoeuvre; and5 late recovery, the remaining heartbeats until the end of the measurement. Functional evaluations included mean peak flow velocity (i.e. the maximum velocity spatially averaged across the entire vessel lumen), flow volume, heart rate and mean vessel area.
Statistical analysis
Functional flow parameters for single subjects and phases (regular breathing, early and late strain, early and late recovery) were calculated by averaging across corresponding heartbeats of each Valsalva manoeuvre. These values were averaged across subjects and repetitions and expressed in absolute units (mean ± standard deviation) as well as in percentages relative to values during regular breathing. If the target pressure of 40 mmHg was not reached or if the ECG signal could not properly be recorded, for example, owing to the contraction of muscles of respiration during the Valsalva manoeuvre, measurements were excluded from statistical analyses.
Parameter distributions were tested by d'Agostino and Pearson's omnibus normality test. Repeated-measurement one-way analysis of variance with Greenhouse–Geisser correction followed by Tukey's multiple comparisons test was performed using GraphPad Prism® v. 6.0d for Mac OS X (GraphPad Software, Inc., La Jolla, CA) to compare haemodynamic parameters during normal breathing and Valsalva manoeuvre. All p < 0.05 were considered statistically significant.
RESULTS
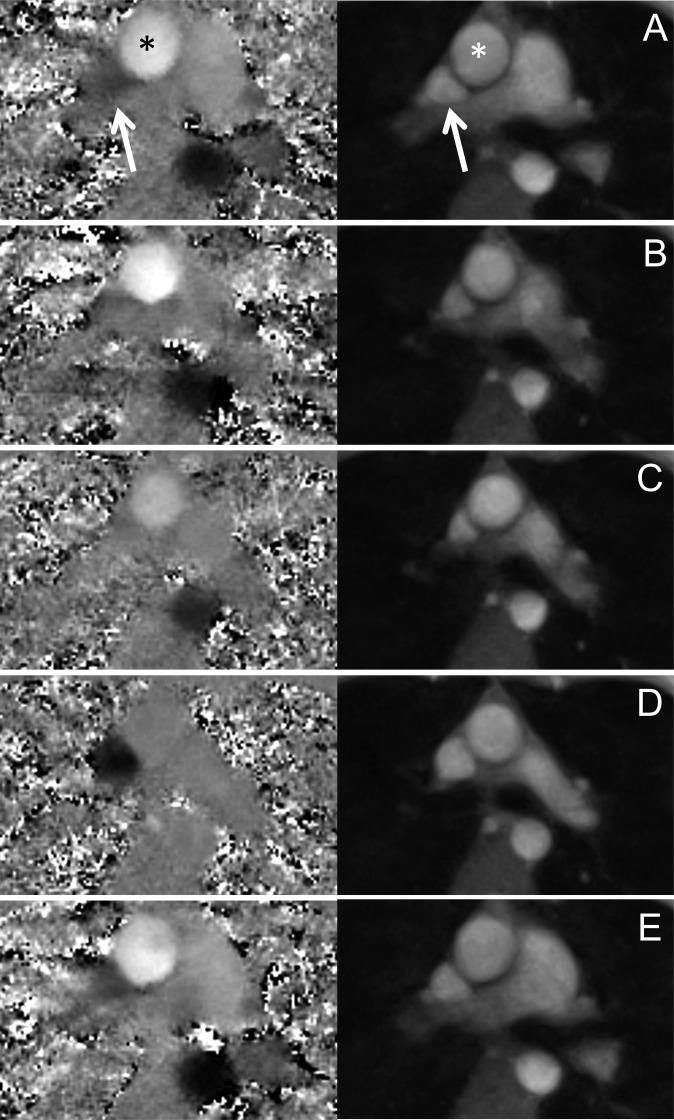
Real-time flow measurements and pressure recordings were technically successful in all cases. For a single subject, Figure 3 depicts phase-contrast maps and magnitude images of a real-time phase-contrast flow MRI measurement for all five phases of the Valsalva manoeuvre. The nominal in-plane resolution of 1.33 mm allowed for a detailed characterization of the great thoracic vessels and a distinct definition of vessel walls. The increased intrathoracic pressure caused a compression of vessel lumina, which is most pronounced during the late strain of the Valsalva manoeuvre (Figure 3c). In particular, the lumen of the SVC decreased significantly and changed its shape from triangular to almost circular during early recovery (Figure 3d).
Figure 3.
Real-time (left) phase-contrast flow maps and (right) magnitude images of the ascending aorta (stars) and superior vena cava (arrows). (a) Normal breathing, (b) early and (c) late Valsalva manoeuvre, (d) early and (e) late recovery.
The simultaneous assessment of mean peak velocities (centimetres per second), mean areas of vessel lumina (millimetres squared), flow volumes (millilitres per beat) and heart rate (beats per minute) allowed for a detailed comparison of haemodynamic changes in the AA and SVC during all 5 phases of the Valsalva manoeuvre yielding ≤57 measurements for 19 subjects and a maximum of 3 successful measurements each. In four cases, the required pressure was not reached, and in six cases, the ECG signal was disturbed by gradient interference and/or motion. The final analysis therefore included 53 measurements for regular breathing, early strain and late recovery, 52 measurements for late strain and 48 measurements for early recovery.
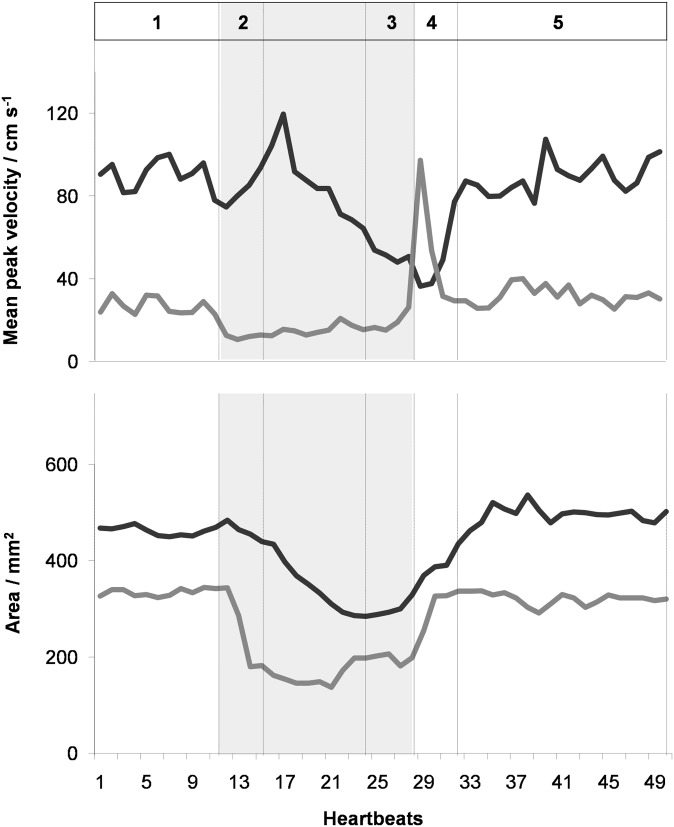
Table 1 summarizes mean peak flow velocities, vessel areas and flow volumes per cardiac cycle for both the AA and SVC averaged across subjects and measurements. Corresponding single-subject data during the Valsalva manoeuvre is presented in Figures 4 and 5 illustrating the dynamic behaviour of the applied pressure, flow volume for AA and SVC and heart rate as well as mean peak velocities and vessel lumina, respectively.
Table 1.
Real-time phase-contrast flow MRI during Valsalva manoeuvre
| Parameter | Normal breathing, n = 53 | Early Valsalva, n = 53 | Late Valsalva, n = 52 | Early recovery, n = 48 | Late recovery, n = 53 |
|---|---|---|---|---|---|
| Ascending aorta | |||||
| Mean peak velocity (cm s−1) | 57 ± 15 (100%) | 59 ± 14 (106 ± 14%) | 43 ± 13a (76 ± 15%) | 39 ± 13a (68 ± 14%) | 62 ± 19 (109 ± 11%) |
| Area (mm2) | 728 ± 141 (100%) | 701 ± 133 (96 ± 3%) | 601 ± 133a (83 ± 12%) | 639 ± 129a (89 ± 9%) | 733 ± 136 (101 ± 2%) |
| Flow (ml per beat) | 87 ± 16 (100%) | 91 ± 16 (106 ± 12%) | 37 ± 13a (42 ± 12%) | 33 ± 12a (39 ± 13%) | 92 ± 19 (106 ± 8%) |
| Superior vena cava | |||||
| Mean peak velocity (cm s-1) | 32 ± 7 (100%) | 15 ± 5a (49 ± 15%) | 18 ± 6a (57 ± 21%) | 48 ± 12a (153 ± 41%) | 35 ± 7 (111 ± 14%) |
| Area (mm2) | 296 ± 65 (100%) | 210 ± 56a (72 ± 17%) | 188 ± 58a (65 ± 18%) | 289 ± 58 (98 ± 8%) | 301 ± 64 (102 ± 4%) |
| Flow (ml per beat) | 28 ± 8 (100%) | −3 ± 6a (−13 ± 24%) | 10 ± 6a (37 ± 21%) | 52 ± 16a (194 ± 53%) | 30 ± 7 (113 ± 20%) |
| Heart rate (beats per minute) | 75 ± 8 (100%) | 77 ± 13 (103 ± 14%) | 98 ± 16a (132 ± 20%) | 99 ± 15a (134 ± 20%) | 68 ± 9a (91 ± 11%) |
Absolute (percentage) values (relative to normal breathing) are given as mean ± standard deviation averaged across 19 subjects and 3 measurements (n ≤ 57).
p < 0.001 (relative to normal breathing).
Figure 4.
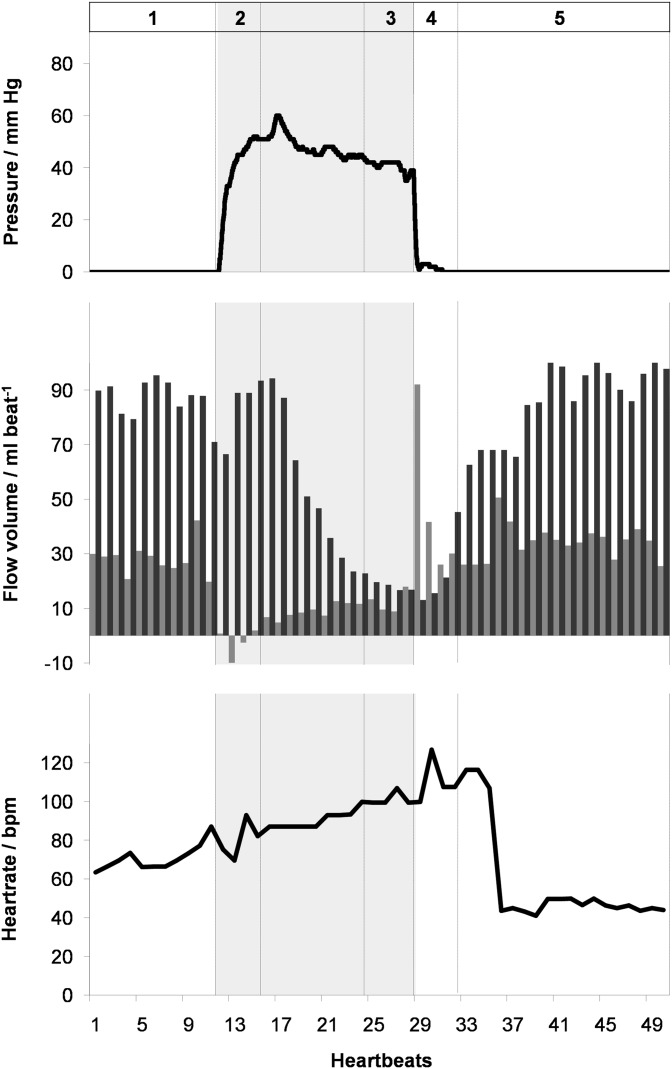
(Top) pressure, (middle) flow volume in the ascending aorta (black) and superior vena cava (grey), and (bottom) heart rate as a function of time during the Valsalva manoeuvre (shaded) in a 24-year-old male. Real-time phase-contrast flow MRI was performed for 40 s corresponding to 50 successive heartbeats. 1, normal breathing; 2, early Valsalva; 3, late Valsalva; 4, early recovery; and 5, late recovery. bpm, beats per minute.
Figure 5.
Spatially averaged peak flow velocity and vessel lumen of the ascending aorta (black) and superior vena cava (grey) as a function of time during the Valsalva manoeuvre. Same subject and parameters as in Figure 4.
Taken together, the present findings confirm previous observations and underlying physiological adjustments in response to an altered intrathoracic pressure. During normal breathing, the left-ventricular cardiac output, that is, the stroke or flow volume in the AA, is modulated by the respiratory cycle with higher values during inspiration, that is, reduced intrathoracic pressure. At the beginning of the Valsalva manoeuvre (Phase 2), the flow volume in the AA remained unchanged but abruptly ended in the SVC (Figure 4). This observation is owing to both a decreased flow velocity and a pronounced reduction of the SVC vessel lumen (Figure 5). The transition period (Phase 2) is followed by a continuously decreasing flow in the AA and a steady low flow in the SVC. The late strain of the Valsalva manoeuvre (Phase 3) is determined by significant haemodynamic alterations, which resulted in a flow volume reduction to 42% and 37% of normal breathing values in the AA and SVC, respectively (Table 1). Again, the AA flow decrease is caused by a lower peak velocity and a reduced vessel lumen, which both are a direct consequence of elevated intrathoracic pressure (Figure 5).
Immediately after pressure release and resumed breathing (Phase 4), flow in the SVC exhibited a reactive hyperdynamic response characterized by a rapid normalization of vessel lumen as well as an immediate increase in mean peak flow velocity and flow volume eventually overshooting to even two- to three-fold the values observed during normal breathing (e.g. subject in Figures 4 and 5). This extraordinary haemodynamic response lasted for only about one to two heartbeats before rapidly returning to normal levels within very few heartbeats. By contrast, flow in the AA remained low during early recovery (Phase 4) and only subsequently revealed a continuous normalization within a period of about 10–12 heartbeats.
In order to compensate for the decreased cardiac output during high intrathoracic pressure, the heart rate increased significantly during the late strain of the Valsalva manoeuvre (Phase 3). The release of pressure was followed by a phase of bradycardia with a delay of approximately 5–8 heartbeats.
DISCUSSION
This is the first study that demonstrates continuous adjustments of physiological blood flow during all phases of the Valsalva manoeuvre, simultaneously in two major heart vessels, at robust image quality, and with both high temporal and high spatial resolution. In particular, the method is neither compromised by sensitivities to magnetic field inhomogeneities or tissue susceptibility differences nor contaminated by free breathing or other subject movements. During high intrathoracic pressure, mean peak flow velocities and vessel lumina of the AA and SVC as well as the resulting flow volumes are significantly reduced, while heart rates become elevated in a compensatory manner. Transition phases during early strain and early recovery are further characterized by specific physiological adjustments in left-ventricular function, venous flow and heart rate. All these findings are consistent with a plethora of data obtained by echocardiography over several decades.1,4,26–33
While real-time MRI studies of cardiac function and flow offer general advantages over ECG-synchronized cine MRI techniques, which include free breathing, beat-to-beat analyses and dynamic access to physiological interventions, the NLINV method adds adequate temporal and spatial resolution as demonstrated in previous work.16–22 On the other hand, a potential limitation of the proposed method, which currently hampers its widespread availability, is the high computational demand of NLINV reconstructions. However, this challenge has successfully been met by the development of a fully integrated bypass GPU computer to the commercial MRI system. It provides online image reconstruction without user interference as a pre-requisite for clinical trials, which now have to confirm and extend this limited single-centre prospective study in 20 healthy volunteers.
In terms of quantitative comparisons, the lack of a true in vivo gold standard for flow measurements complicates fair assessments between modalities. For example, while the current temporal resolution of 40 ms for real-time phase-contrast flow MRI is still lower than that of echocardiography, it remains an open question whether peak flow velocities from a focused beam of ultrasound are of better clinical utility than flow volumes derived from a two-dimensional velocity profile of the entire vessel lumen. On the other hand, under many pathological conditions, flow patterns often present with more pronounced turbulence, that is, more three-dimensional flow components, which need to be compensated for by adding in-plane motion-compensating gradient waveforms in future implementations. Also, the completion of a Valsalva manoeuvre might become more difficult for patients with congestive heart failure and require adjustments with reduced pressure levels such as 30 mmHg.
Abnormal responses to the Valsalva manoeuvre have been shown to correlate with the severity of systolic and diastolic heart failure. The real-time flow MRI technique demonstrated here therefore promises new insights into the pathophysiological alterations associated with, for example, pre-clinical congestive heart failure or diastolic dysfunction by unravelling the dynamic pattern of haemodynamic adjustments in response to elevated intrathoracic pressure, especially during early recovery. This particularly holds true when Doppler echocardiography is compromised by a poor acoustic window.
CONFLICT OF INTEREST
K van Wijk is employed by Medis Medical Imaging Systems BV.
FUNDING
This article was funded by DFG (project number LO 1773/1-1).
REFERENCES
- 1.Felker GM, Cuculich PS, Gheorghiade M. The Valsalva maneuver: a bedside “biomarker” for heart failure. Am J Med 2006; 119: 117–22. [DOI] [PubMed] [Google Scholar]
- 2.Nishimura RA, Tajik AJ. The Valsalva maneuver-3 centuries later. Mayo Clin Proc 2004; 79: 577–8. [DOI] [PubMed] [Google Scholar]
- 3.Nagueh SF, Appleton CP, Gillebert TC, Marino PN, Oh JK, Smiseth OA, et al. Recommendations for the evaluation of left ventricular diastolic function by echocardiography. Eur J Echocardiogr 2009; 10: 165–93. [DOI] [PubMed] [Google Scholar]
- 4.Gindea AJ, Slater J, Kronzon I. Doppler echocardiographic flow velocity measurements in the superior vena cava during the Valsalva manoeuvre in normal subjects. Am J Cardiol 1990; 65: 1387–91. [DOI] [PubMed] [Google Scholar]
- 5.Dickstein K, Cohen-Solal A, Filippatos G, McMurray JJ, Ponikowski P, Poole-Wilson PA, et al. ESC guidelines for the diagnosis and treatment of acute and chronic heart failure 2008: the task force for the diagnosis and treatment of acute and chronic heart failure 2008 of the European Society of Cardiology. Developed in collaboration with the Heart Failure Association of the ESC (HFA) and endorsed by the European Society of Intensive Care Medicine (ESICM). Eur J Heart Fail 2008; 10: 933–89. [DOI] [PubMed] [Google Scholar]
- 6.Moran PR. A flow velocity zeugmatographic interlace for NMR imaging in humans. Magn Reson Imaging 1982; 1: 197–203. [DOI] [PubMed] [Google Scholar]
- 7.van Dijk P. Direct cardiac NMR imaging of heart wall and blood flow velocity. J Comput Assist Tomogr 1984; 8: 429–36. [DOI] [PubMed] [Google Scholar]
- 8.Bryant DJ, Payne JA, Firmin DN, Longmore DB. Measurement of flow with NMR imaging using a gradient pulse and phase difference technique. J Comput Assist Tomogr 1984; 8: 588–93. [DOI] [PubMed] [Google Scholar]
- 9.Lotz J, Meier C, Leppert A, Galanski M. Cardiovascular flow measurement with phase-contrast MR imaging: basic facts and implementation. Radiographics 2002; 22: 651–71. doi: 10.1148/radiographics.22.3.g02ma11651 [DOI] [PubMed] [Google Scholar]
- 10.Gatehouse PD, Keegan J, Crowe LA, Masood S, Mohiaddin RH, Kreitner KF, et al. Applications of phase-contrast flow and velocity imaging in cardiovascular MRI. Eur Radiol 2005; 15: 2172–84. doi: 10.1007/s00330-005-2829-3 [DOI] [PubMed] [Google Scholar]
- 11.Eichenberger AC, Schwitter J, McKinnon GC, Debatin JF, von Schulthess GK. Phase-contrast echo-planar MR imaging: real-time quantification of flow and velocity patterns in the thoracic vessels induced by Valsalva's maneuver. J Magn Reson Imaging 1995; 5: 648–55. [DOI] [PubMed] [Google Scholar]
- 12.van den Hout RJ, Lamb HJ, van den Aardweg JG, Schot R, Steendijk P, van der Wall EE, et al. Real-time MR imaging of aortic flow: influence of breathing on left ventricular stroke volume in chronic obstructive pulmonary disease. Radiology 2003; 229: 513–19. doi: 10.1148/radiol.2292020559 [DOI] [PubMed] [Google Scholar]
- 13.Thompson RB, McVeigh ER. Real-time volumetric flow measurements with complex-difference MRI. Magn Reson Med 2003; 50: 1248–55. doi: 10.1002/mrm.10637 [DOI] [PMC free article] [PubMed] [Google Scholar]
- 14.Nezafat R, Kellman P, Derbyshire JA, McVeigh ER. Real-time blood flow imaging using autocalibrated spiral sensitivity encoding. Magn Reson Med 2005; 54: 1557–61. doi: 10.1002/mrm.20690 [DOI] [PMC free article] [PubMed] [Google Scholar]
- 15.Park JB, Hu BS, Conolly SM, Nayak KS, Nishimura DG. Rapid cardiac-output measurement with ungated spiral phase contrast. Magn Reson Med 2006; 56: 432–8. doi: 10.1002/mrm.20970 [DOI] [PubMed] [Google Scholar]
- 16.Uecker M, Zhang S, Voit D, Karaus A, Merboldt KD, Frahm J. Real-time MRI at a resolution of 20 ms. NMR Biomed 2010; 23: 986–94. doi: 10.1002/nbm.1585 [DOI] [PubMed] [Google Scholar]
- 17.Uecker M, Zhang S, Voit D, Merboldt KD, Frahm J. Real-time MRI—recent advances using radial FLASH. Imag Med 2012; 4: 461–76. [Google Scholar]
- 18.Zhang S, Uecker M, Voit D, Merboldt KD, Frahm J. Real-time cardiovascular magnetic resonance at high temporal resolution: radial FLASH with nonlinear inverse reconstruction. J Cardiovasc Magn Reson 2010; 12: 39. doi: 10.1186/1532-429X-12-39 [DOI] [PMC free article] [PubMed] [Google Scholar]
- 19.Voit D, Zhang S, Unterberg-Buchwald C, Sohns JM, Lotz J, Frahm J. Real-time cardiovascular magnetic resonance at 1.5 T using balanced SSFP and 40 ms resolution. J Cardiovasc Magn Reson 2013; 15: 79. doi: 10.1186/1532-429X-15-79 [DOI] [PMC free article] [PubMed] [Google Scholar]
- 20.Joseph AA, Merboldt KD, Voit D, Zhang S, Uecker M, Lotz J, et al. Real-time phase-contrast MRI of cardiovascular blood flow using undersampled radial fast low-angle shot and nonlinear inverse reconstruction. NMR Biomed 2012; 25: 917–24. doi: 10.1002/nbm.1812 [DOI] [PubMed] [Google Scholar]
- 21.Joseph A, Kowallick JT, Merboldt KD, Voit D, Schaetz S, Zhang S, et al. Real-time flow MRI of the aorta at a resolution of 40 msec. J Magn Reson Imaging 2014; 40: 206–13. doi: 10.1002/jmri.24328 [DOI] [PubMed] [Google Scholar]
- 22.Frahm J, Schätz S, Untenberger M, Zhang S, Voit D, Merboldt KD, et al. On the temporal fidelity of nonlinear inverse reconstructions for real-time MRI—the motion challenge. Open Med Imaging J 2014; 8: 1–7. [Google Scholar]
- 23.Schätz S, Uecker M. A multi-GPU programming library for real-time applications. In: Proceedings of the 12th International Conference on Algorithms and Architectures for Parallel Processing, Vol 7439. Berlin, Germany: Springer; 2012. pp. 114–28. [Google Scholar]
- 24.Connors AF Jr, Speroff T, Dawson NV, Thomas C, Harrell FE Jr, Wagner D, et al. The effectiveness of right heart catheterization in the initial care of critically ill patients. SUPPORT Investigators. JAMA 1996; 276: 889–97. [DOI] [PubMed] [Google Scholar]
- 25.Sanders GP, Mendes LA, Colucci WS, Givertz MM. Noninvasive methods for detecting elevated left-sided cardiac filling pressure. J Card Fail 2000; 6: 157–64. [PubMed] [Google Scholar]
- 26.Paulev PE, Honda Y, Sakakibara Y, Morikawa T, Tanaka Y, Nakamura W. Brady- and tachycardia in light of the Valsalva and the Mueller maneuver (apnea). Jpn J Physiol 1988; 38: 507–17. [DOI] [PubMed] [Google Scholar]
- 27.Greenfield JC Jr, Cox RL, Hernandez RR, Thomas C, Schoonmaker FW. Pressure-flow studies in man during the Valsalva manoeuvre with observations on the mechanical properties of the ascending aorta. Circulation 1967; 35: 653–61. [DOI] [PubMed] [Google Scholar]
- 28.Robertson D, Stevens RM, Friesinger GC, Oates JA. The effect of the Valsalva maneuver on echocardiographic dimensions in man. Circulation 1977; 55: 596–662. [DOI] [PubMed] [Google Scholar]
- 29.Attubato MJ, Katz ES, Feit F, Bernstein N, Schwartzman D, Kronzon I. Venous changes occurring during the Valsalva maneuver: evaluation by intravascular ultrasound. Am J Cardiol 1994; 74: 408–10. [DOI] [PubMed] [Google Scholar]
- 30.Looga R. The bradycardic response to the Valsalva manoeuvre in normal man. Respir Physiol 2001; 124: 205–15. [DOI] [PubMed] [Google Scholar]
- 31.Looga R. Reproducibility of the heart rate response to low-strain Valsalva manoeuvre in healthy subjects. Respir Physiol Neurobiol 2002; 133: 251–8. [DOI] [PubMed] [Google Scholar]
- 32.Davis SL, Crandall CG. Heat stress alters haemodynamic responses during the Valsalva maneuver. J Appl Physiol (1985) 2010; 108: 1591–4. [DOI] [PMC free article] [PubMed] [Google Scholar]
- 33.Wang Z, Yuan LJ, Cao TS, Yang Y, Duan YY, Xing CY. Simultaneous beat-by-beat investigation of the effects of the Valsalva manoeuvre on left and right ventricular filling and the possible mechanism. PLoS One 2013; 8: e53917. [DOI] [PMC free article] [PubMed] [Google Scholar]


