

Abstract
In this study, we investigated the effect of low density lipoprotein receptor (LDLr) deficiency on gap junctional connexin 36 (Cx36) islet content and on the functional and growth response of pancreatic beta-cells in C57BL/6 mice fed a high-fat (HF) diet. After 60 days on regular or HF diet, the metabolic state and morphometric islet parameters of wild-type (WT) and LDLr−/− mice were assessed. HF diet-fed WT animals became obese and hypercholesterolaemic as well as hyperglycaemic, hyperinsulinaemic, glucose intolerant and insulin resistant, characterizing them as prediabetic. Also they showed a significant decrease in beta-cell secretory response to glucose. Overall, LDLr−/− mice displayed greater susceptibility to HF diet as judged by their marked cholesterolaemia, intolerance to glucose and pronounced decrease in glucose-stimulated insulin secretion. HF diet induced similarly in WT and LDLr−/− mice, a significant decrease in Cx36 beta-cell content as revealed by immunoblotting. Prediabetic WT mice displayed marked increase in beta-cell mass mainly due to beta-cell hypertrophy/replication. Nevertheless, HF diet-fed LDLr−/− mice showed no significant changes in beta-cell mass, but lower islet–duct association (neogenesis) and higher beta-cell apoptosis index were seen as compared to controls. The higher metabolic susceptibility to HF diet of LDLr−/− mice may be explained by a deficiency in insulin secretory response to glucose associated with lack of compensatory beta-cell expansion.
Keywords: Beta-cell mass, connexin 36, high-fat diet, LDL receptor, prediabetes
Type 2 diabetes mellitus (T2DM) is one of the most prevalent metabolic diseases, said to affect as many as a hundred million people worldwide. T2DM often has an adulthood onset and is characterized initially by moderated fasting hyperglycaemia associated with a marked peripheral insulin resistance state partially compensated by beta-cell hyperplasia. In later stages of T2DM pathogenesis, decrease in beta-cell function and mass leads to dependence on insulin reposition (Rhodes 2005; Prentki & Nolan 2006; Tripathy & Chavez 2010). Insulin secretion is a complex process that depends on several extra- and intracellular events, including ATP-dependent K+ channel-mediated membrane depolarization, voltage-dependent Ca2+ channel opening resulting in Ca2+ entry and intracellular increase, and gap junction (GJ)-mediated intercellular Ca2+ oscillation synchronization (Suckale & Solimena 2008). The reasons for beta-cell dysfunction in T2DM are not completely understood. Nevertheless, it has been demonstrated that diabetic rodents display impairment of several steps involved in the stimuli–secretion coupling process probably caused by chronic exposure to hyperglycaemia and/or hyperlipidaemia, respectively, referred to as glycotoxicity and lipotoxicity (Prentki & Nolan 2006; Poitout & Robertson 2008; Del Prato 2009).
Obesity and dyslipidaemia are well-known positive risk factors for the development of T2DM (Prentki & Nolan 2006; Ding et al. 2010). Recent data suggest that intracellular cholesterol and free fatty acid levels may influence beta-cell secretory function and survival as well as GJ beta-cell-beta-cell coupling (Rhodes 2005; Allagnat et al. 2008; Del Prato 2009; Peyot et al. 2010; Carvalho et al. 2012; Souza et al. 2013). Transgenic rodents have been designed for investigating the influence of dyslipidaemia on cardiovascular abnormalities and metabolic disturbances (Fan & Watanabe 2000). Low-density lipoprotein receptor (LDLr) knockout (LDLr−/−) mice have been used extensively as a research model to study pathways involved in LDL-mediated lipid metabolism and as an animal model of atherosclerosis and familial hypercholesterolaemia (Ishibashi et al. 1993; Palinski et al. 1995; Merat et al. 1999; Coenen & Hasty 2007). Nevertheless, the effect of deficiency of LDLr on carbohydrate metabolism and especially on beta-cell function has been less explored and has yielded conflicting data (Schreyer et al. 2002; Karagiannides et al. 2008). The LDLr removes cholesterol-rich intermediate density lipoproteins (IDL) and LDL from the plasma compartment, thereby regulating plasma cholesterol levels (Ishibashi et al. 1993). Therefore, LDLr-deficient mice display hypercholesterolaemia and hypertriglyceridaemia that are aggravated following fat-enriched diets (Palinski et al. 1995; Schreyer et al. 2002; Coenen & Hasty 2007).
In this work, we investigated the effect of a regular chow (C) and high-fat (HF) diet on GJ Cx36 islet content and beta-cell secretory function and growth in wild-type (WT; LDLr+/+) and LDLr−/− C57 mice. By employing these different mice and diets, we expected to obtain animals that display different degrees of hypercholesterolaemia and metabolic responses to diets, yielding a suitable model to investigate the influence of dyslipidaemia and associated metabolic disturbances on beta-cell communication, function and growth.
Materials and methods
Animals and diets
Male and female C57BL/6 wild-type and LDLr-deficient mice (Jackson Laboratory, Bar Harbor, ME, USA) were obtained from the breeding colony of the University of Campinas (UNICAMP, Campinas, Brazil) and housed at 25 °C on a 12-h light (0600 h am)/12-h dark (0600 pm) cycle. The knockout C57BL/6 mouse used was homozygous and lacked functional LDL receptor gene globally; they were generated by homologous recombination in embryonic stem cells as described in details by Ishibashi et al. (1993). Mice, aged 16 to 20 weeks, had access to a standard chow diet (Nuvital CR1, Colombo, Paraná, Brazil) (composition: 4.5 g% lipid, 53 g% carbohydrate and 23 g% protein) or to a high-fat (HF) diet (composition: 21 g% lipid, 50 g% carbohydrate and 20 g% protein) and water ad libitum during 60 days. All experiments were performed in female and male mice because no marked gender differences were observed regarding the metabolic parameters analysed after 60 days on this diet such as cholesterolaemia, fast and fed glycaemia and insulinaemia. Therefore, the data presented here are from pooled results of groups containing comparable numbers of each gender.
Ethical Approval
The animals were used in accordance with the guidelines of the Institutional Committee for Ethics in Animal Experimentation of the UNICAMP.
Plasma biochemical analysis
Mice were fasted for 12 h (overnight) or had free access to food (fed) before blood sampling, which was carried out between 0900 and 1100 h am. Blood samples were collected from either the neck vessels (after decapitation) or from the tail tip. Total cholesterol was measured in fresh plasma in the fasting state using a standard commercial kit, according to the manufacturer's instructions (Boehringer Mannheim, Mannheim, Germany). Glucose levels (fast and fed) were measured using a glucose analyser (Accu-Chek Advantage, Roche Diagnostic, Mannheim, Germany), and plasma insulin concentration (fast) was measured by radioimmunoassay using rat insulin standard.
Glucose (GTT) and insulin (ITT) tolerance tests
At the end of diet period, mice were submitted to glucose (GTT) or insulin tolerance tests (ITT) between 0900 and 1100 h am. For the GTT, mice were fasted for 12 h (overnight), and a blood sample was taken from the tail tip to determine the initial glycaemia (t = 0). A glucose load (1.5 g/kg body weight) was then administered by oral gavage, and additional blood samples were collected and glycaemia measured at different time points (15, 30, 60 and 90 min). The ITT was performed in a separated fed mice group, which had its initial blood glucose (t = 0) measured just before the injection of insulin (0.5 U/kg body weight of human insulin – Biohulin®R, Biobrás, Montes Claros, MG, Brazil). Blood samples were collected at 10, 15, 30 and 60 min after insulin injection to determine the glucose levels. For both tests, the glucose levels were measured using an Accu-Chek Advantage (Roche Diagnostic). The results of GTT are presented as absolute glycaemia values and area under curve (AUC) and ITT data, as percentage to the initial glycaemia values (t = 0) and AUC.
Islet isolation
Islets were isolated by injection of 3 ml type V collagenase solution (1.7 mg/ml in Hank's balanced salt solution pH 7.4) (EC 3.4.24.3, Sigma, St. Louis, MO, USA) within the pancreas, followed by incubation at 37 °C for 24 min then washed in Hank's to remove collagenase. After separation with Histopaque-1077 (Sigma), pancreatic islets were individually collected under a dissecting microscope. Fresh islets were used for determining glucose-stimulated insulin secretion or homogenized in an anti-protease cocktail for immunoblotting.
Insulin secretion
To measure glucose-stimulated insulin secretion, five freshly isolated and size-matched islets were added to each microtube (20–30 microtubes/group) and pre-incubated for 30 min at 37 °C in 0.5 ml bicarbonate-buffered Krebs solution (BBKS; composition in mM: NaCl 112, KCl 5, MgCl2 1, CaCl2 25, NaHCO3 1, HEPES 15) containing 5.6 mM glucose and 3 mg/ml bovine serum albumin and equilibrated to pH 7.4 with a mixture of 95% O2 – 5% CO2. The islets were then incubated for 1 h at 37 °C in 0.5 ml BBKS supplemented with either 2.8 or 16.7 mM glucose. Aliquots of the supernatant fraction were taken and stored at −20 °C. The insulin content within the samples was determined by radioimmunoassay and expressed as ng per islet/h (Carvalho et al. 2010).
Western blot
Pools of islets from all the experimental groups were homogenized in an anti-protease cocktail for immunoblotting of Cx36 as previously described (Carvalho et al. 2012; Santos-Silva et al. 2012). Briefly, the protein concentration of different samples was set as 50 μg and incubated for 1 h at 37 °C with 5× concentrated Laemmli sample buffer (30% of volume). The protein samples were then separated by electrophoresis in 10% polyacrylamide gels, transferred to nitrocellulose membranes (Bio-Rad, Hercules, CA, USA) and stained with Ponceau S solution (Sigma) to compare corresponding bands. After incubation with the primary antibody (anti-Cx36; Zymed, San Francisco, CA, USA; dilution 1:350) and then the specific secondary antibody conjugated with horseradish peroxidase (HRP) (Zymed; dilution 1:2500), the membranes were washed and the detection of antibodies was performed using an enhanced chemiluminescence kit (SuperSignal West Pico Chemiluminescent Substrate, Thermo Fisher Scientific, Waltham, MA, USA) and autoradiography film (Amersham, Pittsburgh, PA, USA). Band intensities were quantified by optical densitometry using the Image J analysis software (http://rsbweb.nih.gov/ij/). As the anti-Cx36 antibody recognizes both monomeric and dimeric protein forms, as confirmed by the antibody supplier, the total densitometry obtained was a sum of monomer and dimer signals. After stripping, the membranes used for Cx36 detection were reblotted with an anti-β-actin, antibody (dilution 1:1500; Zymed) as a loading control, and the values were expressed as a ratio of Cx36/β-actin signals.
Co-localization of Cx36 and insulin
Pancreases were frozen in n-hexane with liquid nitrogen, sectioned using a cryostat (8 μm section) and then fixed with acetone at −20 °C for 3 min. Double immunofluorescence for Cx36 and insulin was performed in these pancreas sections as previously described (Carvalho et al. 2012) using as primary antibodies the following: rabbit anti-Cx36 (Invitrogen, Carlsbad, CA, USA; dilution 1:30) and guinea pig anti-insulin antibody (Dako, Glostrup, Copenhagen, Denmark; dilution 1:100). Sections were mounted with Vectashield (Vector Laboratories, Burlingame, CA, USA) and observed using a confocal laser-scanning microscope (LSM 510 META; Zeiss, Hamburg, Germany). To allow comparison among all animal groups studied, islet sections were processed and analysed by immunofluorescence during the same session using identical confocal parameters.
Histological processing
Pancreases from all experimental groups were removed, weighed and fixed for 18 h in either Bouin's solution, in case of insulin and propidium iodide labelling, or in 4% paraformaldehyde (in 0.05 M Tris-buffered saline (TBS, pH 7.4)) for Ki67 and TUNEL reactions (Carvalho et al. 2006). Each pancreas was sectioned in 3 or 5 fragments, and each piece was embedded separately in paraffin. Two to three blocks from each pancreas were serially sectioned (5-μm-thick slice). One to two sections per block (given two to six sections analysed per pancreas) were randomly selected and processed for either insulin, Ki67 immunoperoxidase reaction, TUNEL or propidium iodide assays.
Immunohistochemistry for insulin and Ki67
After paraffin removal, the sections were rehydrated and, in the case of Ki67 labelling, treated with sodium citrate buffer (0.01 M, pH 7.6) for 60 min in a steam cooker to retrieve the Ki67 antigenicity. After washing with TBS, endogenous peroxidase was blocked using hydrogen peroxide (0.3% H2O2 in methanol) for 30 min followed by incubation with 5% dry skimmed milk in TBS for 1 h. The sections were, then, incubated with guinea pig anti-insulin (Dako, dilution 1:50) or rat anti-Ki67 (TEC3; Dako, dilution 1:20) overnight at 4 °C. For insulin reaction, sections were incubated with the secondary antibody, anti-guinea pig IgG conjugated with HRP (Zymed, dilution 1:1500), for 1 h and 30 min. For Ki67 detection, incubation with a biotinylated anti-rat IgG (Dako, dilution 1:75, incubation period 45 min) was performed followed by 30-min incubation with streptavidin-HRP (Invitrogen, dilution: 1:200), both at room temperature (RT). Then, sections were treated with 10% 3,3′diaminobenzidine (DAB, in Tris-HCl buffer 0.1 M, pH 7.4) (Sigma) and 0.2% H2O2 in TBS. Finally, the sections were quickly stained with Ehrlich's haematoxylin and mounted for microscopy observation. All islets from 2–6 sections/animal (7–11 animals/group) were photographed with a digital camera (Nikon FDX-35) coupled to a bright-field/epifluorescence microscope (Nikon Eclipse E800), and images were captured by an image analysis system (Image Pro Plus for Windows). The stereological measurements were taken in these digitized images using the free software ImageTool (http://ddsdx.uthscsa.edu/dig/itdesc.html). The rate of beta-cell proliferation was determined by counting the number of Ki67-positive cell nuclei within the islet core (×100) and dividing it by the total number of islet nuclei. As an index of beta-cell neogenesis, we determined the frequency of islets (immunolabelled for insulin) budding from pancreatic ducts (Montanya & Téllez 2009).
Morphometry of endocrine pancreas
The pancreas morphometry was performed mostly in immunolabelled insulin sections, as previously described with some modifications (Inuwa & El Mardi 2005). Briefly, all islets (with at least 5 cells or more) of the pancreas sections selected (n = 6 sections/animal, n = 8–11 animals/group, given n = 440–800 islets/group) were photographed as described above, and the stereological measurements were taken in these digitized images using the free software ImageTool. The beta-cell relative area was determined by dividing the total area of insulin positive cells by the islet area multiplied by 100. The islet relative area was calculated by dividing the sum of total islet area by the pancreas sectional area multiplied by 100. The estimated total islet mass (mg) was calculated by multiplying the pancreas weight by the mean of islet relative area. The estimated total beta-cell mass (mg) was calculated by multiplying the total islet mass by the mean of percentage of beta-cells within islet. The mean of number of islets per pancreas section, number and size of beta-cells per islet were also determined. To obtain the mean of beta-cell size (in μm2) per experimental group, the total beta-cell area was divided by the beta-cell number in all islets measured in each group.
TUNEL and propidium iodide assays
To prepare specimen for TUNEL staining, paraffin pancreas sections were dewaxed and equilibrated in TBS, followed by incubation with proteinase K solution (Sigma, 20 μg/ml in 0.01 M Tris-HCl pH 7.4) for 20 min at RT. After washing, sections were treated with 0.01% Triton X-100 and 0.1% sodium citrate solution in distilled water for 5 min. Following washing, the reaction mixture containing terminal deoxynucleotidyltransferase (TDT), labelled nucleotides and DNA polymerase was then applied to sections in a humidified chamber for 60 min at 37 °C, according to the manufacturer's instructions (Kit In Situ Cell Death Detection, KIT POD, Roche Diagnostic). After washing, anti-fluorescein antibody peroxidase conjugate was added to the sections for 30 min at 37 °C. Sections were washed, incubated with DAB substrate as described above, and after stained with Ehrlich's haematoxylin, they were visualized by light microscopy (Nikon Eclipse E800). Positive control sections were treated with DNAse enzyme (3 U/ml in 0.05 M Tris-HCl pH 7.4, 0.01 M MgCl2 and 1 mg/ml albumin) for 15 min at RT previously the TUNEL reaction. The negative control sections were exposed to enzyme TDT only, instead of the whole TUNEL mixture.
The propidium iodide (PI) assay was used to identify morphologically altered nuclei indicative of cell death as previously described (Scaglia et al. 1997). For that deparaffinized and rehydrated pancreas sections were incubated for 40 min in a dark humidified chamber with a solution of PI (concentration 20 μg/ml, Sigma) and ribonuclease A (concentration 100 μg/ml, Sigma). Afterwards, glucagon immunofluorescence staining was carried out to detect islets within the pancreas sections; for that, we used a specific primary antibody (rabbit anti-glucagon, dilution 1:75, Dako) and a secondary antibody conjugated with FITC (dilution 1:125, Sigma). Labelled apoptotic nuclei of endocrine cells in pancreas sections (three sections/animal; n = 6 animal/group) were counted in digitalized islet images obtained as described above using the epifluorescence (Nikon Eclipse E-800) microscope. The index of apoptotic cells was expressed as number of apoptotic beta-cells per islet area (μm2).
Statistic analyses
All numerical results were expressed as the mean ± standard error of the mean (SEM). Statistical analyses were performed using the GraphPad Prism, version 5.00 for Windows (GraphPad Software, La Jolla, CA, USA). The comparison of pairs of experimental groups to determine the statistical significance was carried out by the parametric Student's t-test (two-tailed) (for the metabolic/biochemical data) or the nonparametric Mann–Whitney U-test (two-tailed) (for all the morphometric data). For multiple comparisons, the statistical significance was assessed by anova followed by the Bonferroni test. Two-way anova was used for the analyses of the GTT and ITT curve data. The significance level was set at P < 0.05.
Results
High-fat diet and deficiency of LDLr result in hypercholesterolaemia and disturbances of glucose homeostasis
The measurement of plasma cholesterol showed that LDLr−/− mice, when fed a regular chow diet (C), already display hypercholesterolaemia that is markedly aggravated after HF diet ingestion for 60 days (Figure 1a). Increase in plasma cholesterol level was also observed in WT mice after HF diet (Figure 1a); the experimental groups can be placed in a descending order of cholesterolaemia as follows: HF LDLr−/− ≫ C LDLr−/− > HF WT> C WT.
Figure 1.
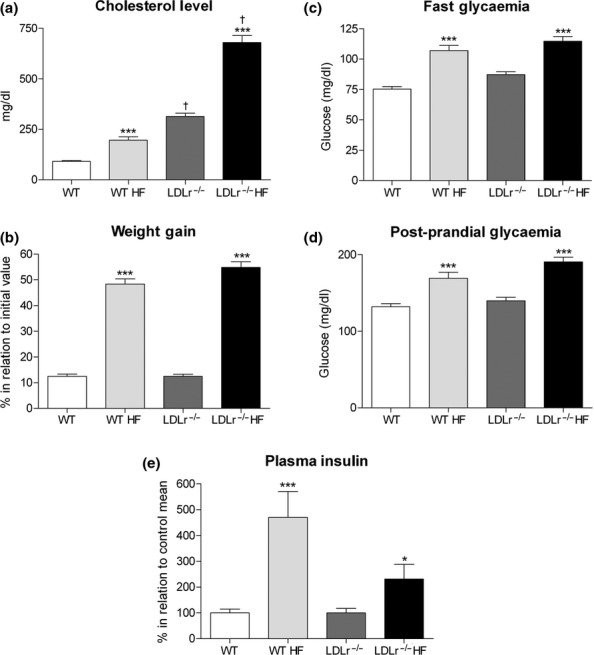
Plasma cholesterol, glucose, insulin levels and body weight gain in wild-type (WT) and LDLr-knockout (LDLr−/−) mice after high-fat diet (HF). HF diet for 60 days induces significant increase in cholesterolaemia (a), body weight gain (b), fast and postprandial glycaemia (c, d) in both mice (WT HF and LDLr−/− HF) as compared to those fed a regular chow diet (WT and LDLr−/−). Regarding the insulin plasma concentration (fast state) (e), WT fed a HF showed a marked increase in plasma level of this hormone, while a much smaller increase in this parameter was observed in HF diet-treated LDLr−/− mice. All values represent the mean + SEM. Data in panel (b) are expressed as percentage in relation to the initial weight value (before HF diet). In panel (e), the results are expressed as percentage in relation to the mean value of its own control group (fed a chow diet). Graph (a) n = 19–35; (b) n = 80–87; (c) n = 37–48; (d) n = 14–19; and (e) n = 24–33 mice per group. *P < 0.05 and ***P < 0.0005 as compared to its respective control fed a regular chow diet (Student's t-test). †P < 0.001 as compared to WT control (fed a chow diet) (anova followed by Bonferroni's test).
In addition to the changes in cholesterol levels, HF diet induced, in both WT and LDLr−/− mice, a significant increase in weight gain (P < 0.0005) (Figure 1b) as well as an enhancement in fasting and postprandial blood glucose levels (P < 0.0005) (Figure 1c,d) as compared to animals treated on chow diet for the same period (control group). In the fed state, glucose level was higher in LDLr−/− than in WT mice after HF diet (169.1 ± 8 (14) × 190.7 ± 6 (19) mg/dL, WT x LDLr−/−, respectively, P < 0.05; Figure 1d). Regarding the fasting plasma insulin concentration, LDLr−/− mice displayed a significant lower insulinaemia (0.23 ± 0.01 ng/ml) than the WT group (0.30 ± 0.01 ng/ml) (P < 0.05), that is in accordance with previous works (Bonfleur et al. 2010, 2011). As shown in Figure 1e, the WT group fed a HF diet showed a fivefold increase (P < 0.0005) in plasma insulin concentration, while the group LDLr−/− diet had only an increase of 2.2 fold (P < 0.05) in relation to their respective control mice. Therefore, treatment with HF diet resulted in a relatively low hyperinsulinaemia in LDLr−/− in comparison with WT mice.
As shown in Figure 2, the increase in blood glucose concentration after an oral glucose load was markedly enhanced in HF-fed mice as compared to chow-fed ones (Figure 2a). The incremental area under curve of the GTT was significantly greater in the HF-fed mice as compared to those fed a regular chow diet (P < 0.02) (Figure 2b). These results indicate that HF diet induces glucose intolerance in both WT and LDLr−/− animals. In accordance with a previous report (Bonfleur et al. 2010), LDLr−/− mice fed a chow diet already display a glucose intolerance that was comparable to the HF-fed WT group (Figure 2a,b). In addition, the area under curve of the GTT in HF-fed LDLr−/− mice was significantly greater than that of HF-fed WT mice (P < 0.01), suggesting a higher metabolic susceptibility to HF of LDLr−/− mice in comparison with WT mice.
Figure 2.
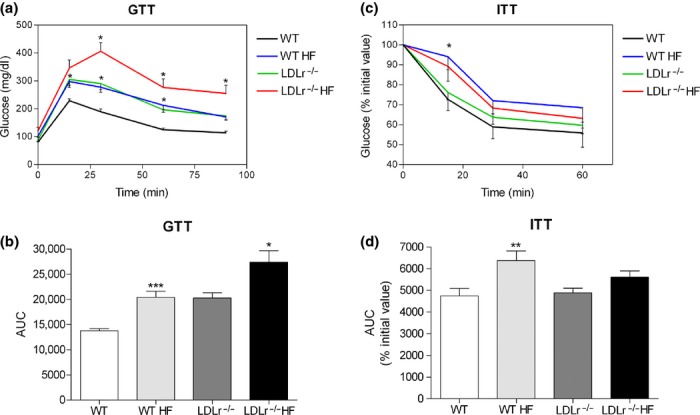
Glucose (GTT) and insulin (ITT) tolerance tests in WT and LDLr−/− mice fed a high-fat diet (HF). After 60 days treatment, both WT and LDLr−/− HF-fed mice display marked intolerance to glucose (a) as demonstrated by the incremental area under the curve (AUC) as depicted in panel (b); values in (a) and (b) are means + SEM of 10–13 mice per group. Regarding the ITT (c), only WT HF-fed mice present a significant insulin resistance as seen by the AUC depicted in panel (d); values in (c) and (d) are means + SEM of 15–21 mice per group. In (a) and (c), *P < 0.05 in comparison with the respective control group (two-way anova); in (b) and (d), *P < 0.02, **P < 0.01 and ***P < 0.0001 as compared to its respective control group (fed a chow diet) (two-tailed Student's t-test).
The ITT analysis showed that the glucose intolerance seen in WT group fed HF diet was associated with peripheral insulin resistance (Figure 2c,d). In contrast, administration of HF diet for 60 days to LDLr−/− mice induced only a tendency of insulin resistance in this experimental group (Figure 2c,d). Accordingly, intraperitoneal injection of insulin load for the ITT protocol resulted in similar plasma removal rates of glucose in both WT and LDLr−/− mice when fed a regular chow diet. These findings show that LDLr−/− animals are not significantly insulin resistant even when challenged with a diet rich in lipids.
HF diet and LDLr−/− deficiency induce reduced glucose-stimulated insulin secretion by isolated pancreatic islets
As the HF diet-induced hyperglycaemia and glucose intolerance were not followed by significant insulin resistance in the case of LDLr−/− mice, we investigated the possibility that the pancreatic islet insulin secretory ability was reduced in these animals. As shown in Figure 3, islets from LDLr−/− mice fed a HF diet displayed a relatively greater reduction in insulin secretory response to glucose (Figure 3c,d) as compared to WT islets (Figure 3a,b). This reduced secretory response observed in islets from HF-fed LDLr−/− mice was mainly due to a significant decrease in stimulated insulin secretion (to 16.7 mM glucose) as compared to its control (chow-fed LDLr−/− mice) (P < 0.02), because both groups displayed a similar basal secretion (2.8 mM glucose). In contrast, islets from WT mice fed a HF diet showed an unaltered 16.7 mM glucose-stimulated insulin secretion yet a significant higher basal secretion (2.8 mM glucose) (P < 0.005) in comparison with islets isolated from chow-fed WT mice (Figure 3a). In addition, comparing WT and LDLr−/− islets of mice fed a chow diet (C), LDLr−/− islets secreted overall less insulin at the same stimulatory concentration of glucose (16.7 mM) than the WT islets (P < 0.0001). These results suggest that the islets from LDLr−/− mice are less sensitive to glucose than islets from WT mice, which can explain at least in part the relatively lower insulinaemia and higher glucose intolerance in these animals after HF diet.
Figure 3.
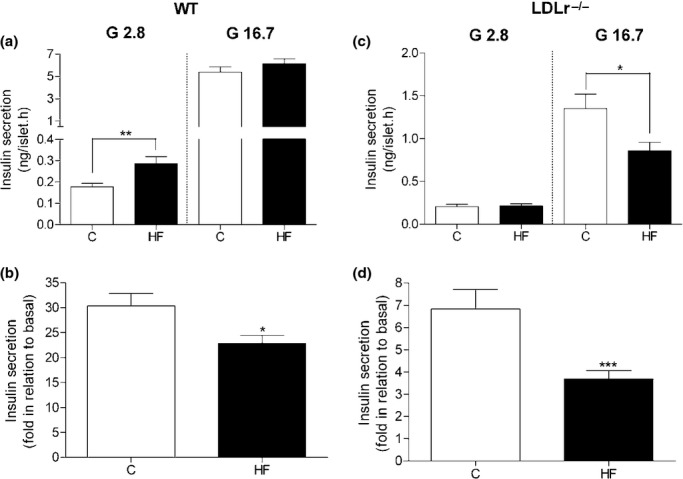
Glucose-stimulated insulin secretion in isolated islets from WT and LDLr−/− mice fed a regular chow (C) or high-fat diet (HF). HF diet (for 60 days) induces a significant increase in basal insulin secretion (2.8 mM) in WT islets (a) and a decrease in glucose-stimulated (16.7 mM) insulin release in LDLr−/− islets (c). Islets from both WT and LDLr−/− mice fed a HF diet displayed a significant reduction in insulin secretory response to glucose when compared to their control group fed a C diet (b, d). Insulin release within the supernatant is expressed as mean + SEM (ng/islet.h) in (a) and (c). In graphs (b) and (d), the data are expressed as fold increase over basal mean value. The number of independent observations was 3 for WT and 4 for LDLr−/− group, n = 20–30 microtubes with 5 fresh islets in each tube. *P < 0.02; **P < 0.005 and ***P < 0.001 in comparison with its respective control (C).
Decreased insulin secretion induced by HF diet was associated with a reduction in gap junctional Cx36 islet content in both LDLr−/− and WT islets
As shown in the Figure 4, the immunolabelling for the GJ Cx36 was detected exclusively in insulin-secreting beta-cells within the islets. No marked difference in Cx36 cell distribution was observed in pancreas cryosections from WT and LDLr−/− mice fed a HF diet in comparison with those that received a regular chow diet (Figure 4a–d). Nevertheless, 60-day exposure to HF diet induced a significant reduction in Cx36 islet content in both WT and LDLr−/− mice (P < 0.02) (Figure 4i,k).
Figure 4.
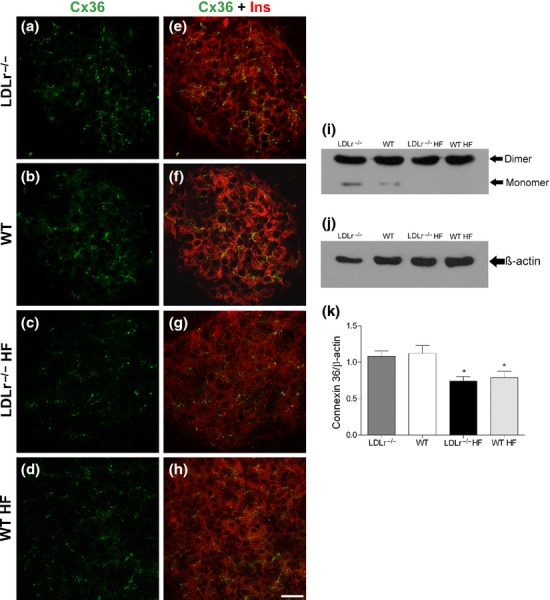
Cx36 distribution and cell content in the endocrine pancreas of WT and LDLr−/− mice fed a regular chow or a high-fat diet (HF). Photomicrographs show the immunostaining for Cx36 in pancreatic islet sections of LDLr−/− (a) and WT (b) mice fed a chow diet as well as of LDLr−/− (c) and WT (d) mice fed a HF diet. Images (e), (f), (g), (h) show double labelling for Cx36 and insulin in the same islets. They are representative of four independent experiments. Sonicates of isolated islets were immunoblotted for Cx36 (i). The protein was detected in its monomeric (36 kDa) and dimeric (66 kDa) forms. Densitometric evaluation, relative to the internal control β-actin (j), revealed a significant decrease of Cx36 in HF-fed mice (k). Values are the mean + SEM of at least seven membranes from six independent experiments. Scale bar, 20 μm. *P < 0.02 in comparison with its control group.
Lack of compensatory hyperplasia of the endocrine pancreas in prediabetic LDLr−/− mice
Regarding the pancreatic islet structure, no marked differences were observed among WT and LDLr−/− control or treated groups (Figure 5). Morphologically, pancreatic islets from all experimental groups exhibited a normal structure, characterized by a shape ranging from round to oval, surrounded by a very thin capsule of reticular fibres that separates it from the exocrine pancreatic parenchyma. The islet parenchyma consists of cords of endocrine cells interspersed by capillaries. The islets, regardless of the experimental group, showed what appeared to be a typical cytoarchitecture characterized by a core of beta-cells surrounded by a mantle of non-beta-cells (Figure 5a–d).
Figure 5.
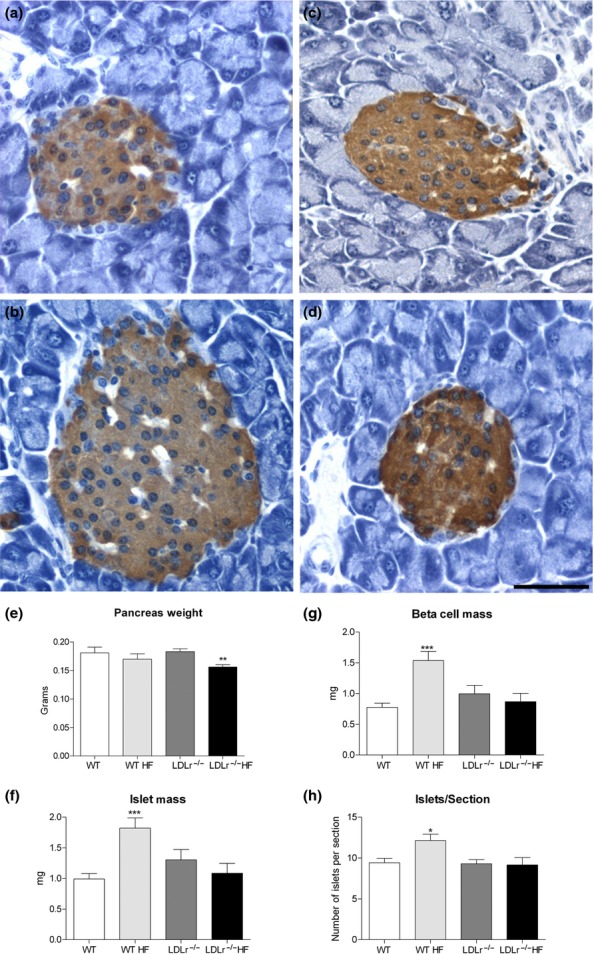
Histological and morphometric analysis of pancreas from WT and LDLr−/− mice fed a regular chow or high-fat diet (HF). Images (a) – (d) show insulin immunoperoxidase detection in pancreas sections from the different groups studied: WT (a), WT HF (b), LDLr−/− (c) and LDLr−/− HF (d). No significant histological changes were observed in pancreatic islets of HF-fed mice in comparison with their respective controls (fed a regular chow diet). Nevertheless, HF diet induced a significant increase in islet (f) and beta-cell masses (g), as well in islet number/section (h) in WT mice, while LDLr−/− mice displayed no significant morphometric changes after HF diet for 60 days but a decrease in pancreas weight (e). Data were obtained from six pancreas sections from each animal (n = 8–11 animals/group), and a total of 440–800 islets were analysed per group. *P < 0.02; **P < 0.005 and ***P < 0.001 as compared to its respective control. Scale bar, 50 μm.
Nevertheless, the HF diet for 60 days induced significant morphometric changes in the endocrine pancreas of WT mice (Figure 5a, b, f–h). The treated group showed a significant increase in islet mass (P < 0.001) (Figure 5f), beta-cell mass (P < 0.0005) (Figure 5g) and in the number of islets per transversal pancreas section (P < 0.02) (Figure 5h) when compared to chow-fed mice. The increase in the beta-cell mass was due to a significant enhancement in the number (C: 41.6 ± 2.4 (623) of beta-cells/islet vs. HF: 56.4 ± 3.3 (802), P < 0.005) and of size (C: 135.0 ± 1.7 μm2 (623) vs. HF: 150.9 ± 1.4 μm2 (802), P < 0.0001) of this endocrine cell type. These results suggest that the endocrine pancreas of the HF-fed WT undergoes hyperplasia and hypertrophy that is probably compensatory to the increasing demand for insulin induced by the diet in these animals (Ahrén et al. 2010; Peyot et al. 2010).
In contrast to the WT, the LDLr−/− mice showed no significant changes in islet or beta-cell masses after HF diet (Figure 5c, d, f–h). Interestingly, islets of HF-fed LDLr−/− mice display a significant decrease in beta-cell number per islet (HF: 44.3 ± 3.5 (440) vs. C: 55.2 ± 3.6 (446); P < 0.02) as well as larger beta-cells (HF:135.9 ± 1.6 μm2 (440) vs. C: 124.7 ± 1.4 μm2 (446); P < 0.0001) in comparison with mice fed a chow diet. In addition, HF-fed LDLr−/− mice displayed a significant reduction in pancreas weight when compared to their respective control group (Figure 5e).
Figure 6 shows that when submitted to HF diet ingestion, WT and LDLr−/− islets display a higher rate of beta-cell proliferation (Ki67-positive cells) in comparison with their respective control group (chow-fed mice). To investigate the degree of neogenesis in the endocrine pancreas of these animals, we determined the frequency of association between islet and duct (Montanya & Téllez 2009). As shown in Figure 7, no significant difference was observed between the chow-fed and HF-fed WT mice regarding this parameter, which was used as the neogenesis index (Figure 7a). Meanwhile, the frequency of islet–duct association was significantly reduced in LDLr−/− mice fed a HF diet as compared to LDLr−/− controls (Figure 7a).
Figure 6.
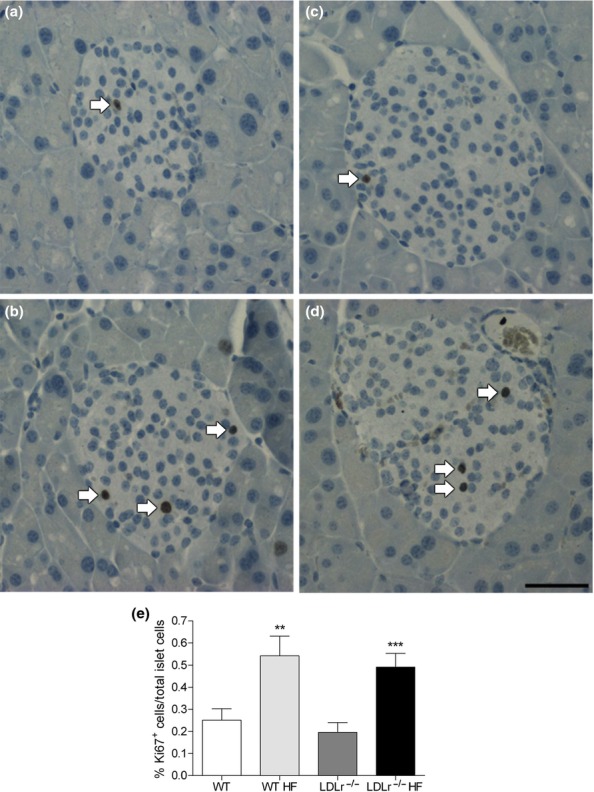
Beta-cell proliferation, as assessed by Ki67 immunolabelling, in pancreatic islets from WT and LDLr−/− mice after regular chow or high-fat diet (HF). Images show size-matched pancreatic islets immunolabelled for Ki67 (arrows), of WT (a), WT HF (b), LDLr−/− (c) and LDLr−/− HF (d) groups. WT mice after HF diet showed an increase of 115% in beta-cell proliferation as compared to its control group (e), corroborating the data from morphometric analysis (see Figure 5). Surprisingly, the LDLr−/− mice also showed a high beta-cell proliferation (increase of 150%) after HF. Data were obtained from two pancreas sections from each animal (n = 7–11 animals/group), and a total of 189–255 islets were analysed per group. **P < 0.005 and ***P < 0.0001 in comparison with its respective control. Scale bar, 50 μm.
Figure 7.
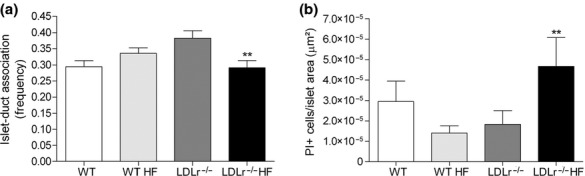
Beta-cell neogenesis and apoptosis in the endocrine pancreas of WT and LDLr−/− mice fed a regular chow or a high diet (HF). The panel (a) displays the frequency of islets (≥5 cells) associated with ducts in relation to the total islet number. A total of 440–800 islets were analysed per group (from 8–11 animals/group). In case of panel (b), all propidium iodide (PI)-positive cells were counted and divided by the islet area. A total of 101–144 islets were analysed per group (from 6 animals/group). Note that the exposure to HF diet induced a significant reduction in islet–duct association (neogenesis)(a) and a marked increase in PI-positive beta-cells/islet (apoptosis) in LDLr−/− mice (b) but did not change these parameters in WT mice. **P < 0.01 as compared to its respective control.
Then, we performed the TUNEL and PI assays to determine the apoptosis index in the endocrine pancreas from all experimental groups. No detectable reaction, as obtained by TUNEL, was observed for any of the pancreas sections analysed from WT and LDLr−/− mice, despite the fact that the positive control pancreas sections (treated with DNAse) showed a strong reaction (data not shown). In general, the PI assay revealed a very few apoptotic islet cells (ranging between 1 and 3 positive cells per islet), while majority of the islets displayed no apoptotic cells regardless of the experimental group. LDLr−/− mice fed a HF diet showed a significant increase in apoptotic beta-cells per islet area in comparison with those fed a regular chow diet (P < 0.01) (Figure 7b). In contrast, HF-fed WT mice displayed an overall lower incidence of apoptosis than WT control group (Figure 7b).
Discussion
The pathogenesis of T2DM is complex, but it ultimately depends on the pancreatic beta-cell functional state. Hyperlipidaemia has been pointed out as one of the important predisposition factors leading to the glucose homeostasis disturbances of T2DM (Ding et al. 2010). Bonfleur et al. (2010, 2011) have demonstrated that a moderate hypercholesterolaemia impairs the beta-cell insulin secretion, leading to glucose intolerance without affecting peripheral insulin sensitivity in LDLr−/− mice fed a regular chow diet. We have recently suggested that the impairment in GJ-mediated intercellular communication (GJIC) may be involved in the development of prediabetes in WT C57BL/6 mice fed a HF diet (Carvalho et al. 2012). The present study is an extension of these two previous works that addresses whether severe hyperlipidaemia associated with prediabetes affects beta-cell communication, function and growth. For that, we have used wild-type (WT; LDLr+/+) and LDLr−/− C57BL/6 mice fed a normal or high-fat diet to yield a range of different degrees of hypercholesterolaemia.
As predicted, our experimental mice displayed marked differences in the plasma level of cholesterol being the lowest cholesterolaemia value observed in the chow-fed (C) WT mice and the highest in the HF diet LDLr−/− mice. These results are in accordance with other works showing that HF diets and LDLr gene mutation per se induce marked increase in plasma cholesterol levels in mice (Merat et al. 1999; Winzell & Ahrén 2004; Coenen & Hasty 2007; Bonfleur et al. 2010). Associated with the hypercholesterolaemia, the exposure to HF diet for only 60 days induced in C57BL/6 mice (WT and LDLr−/−) a moderate hyperglycaemia, hyperinsulinaemia and marked intolerance to glucose. These metabolic disturbances characterize the well-known prediabetic state that corresponds to the initial phase of the T2DM (Rhodes 2005; Ding et al. 2010; Tripathy & Chavez 2010).
Under the experimental conditions tested here, LDLr-deficient mice displayed a relatively high susceptibility to the diet as judged by their marked hypercholesterolaemia, postprandial hyperglycaemia and intolerance to glucose. Several previous studies have shown that LDLr−/− mice do respond metabolically to HF diets (Merat et al. 1999; Schreyer et al. 2002; Bie et al. 2010). In accordance with our data, Schreyer et al. (2002) suggested that LDLr−/− male mice (6 weeks old) fed a diabetogenic diet (35.5% fat content, mainly lard) up to 16 weeks were more susceptible to diet-induced obesity and hyperglycaemia than WT C57BL/6 mice. Nevertheless, this idea has been challenged by others. Karagiannides et al. (2008) showed that LDLr−/− female mice (4–6 weeks old) were more resistant to developing hyperglycaemia and glucose intolerance in response to western-type diet (21.1% fat content) for 15 weeks when compared to the WT mice, suggesting that LDLr deletion may have a protective effect on diet-induced obesity and metabolic disturbances. The discrepancies between these studies may reside in differences in animal age (Collins et al. 2009) and/or in fat diet content employed, as higher fat content in the diets used increases the possibility to occur saturation of the metabolic pathways that control body fat deposition and glucose homeostasis, as suggested previously (Karagiannides et al. 2008).
It is well known that in T2DM pathogenesis the intolerance to glucose is usually preceded by a peripheral insulin resistance state that can be associated or not with impairment in insulin secretion (Rhodes 2005; Prentki & Nolan 2006; Peyot et al. 2010; Tripathy & Chavez 2010). In our model, HF diet induced in WT mice, besides insulin resistance, a significant decrease (25%) in insulin secretory islet response to glucose mainly due to an increased basal insulin output, that is in accordance with previous works (Collins et al. 2010; Carvalho et al. 2012). In addition, we described here for the first time that LDLr−/− mice when fed a HF diet display a much more severe impairment in the stimulated insulin secretion in comparison with the WT mice. The insulin secretory response of islets isolated from HF-fed LDLr−/− mice was 50% lower than those from chow diet-fed LDLr−/− mice. Even under a regular balanced diet, LDLr−/− mice showed a relatively low stimulated insulin secretion that agrees with our previous works (Bonfleur et al. 2010; Souza et al. 2013). This markedly impairment in insulin secretion explains, at least partially, the relatively severe intolerance to glucose observed in LDLr−/− mice (fed a HF diet) that surprisingly did not display a significant insulin resistance.
To unravel one possible mechanism that could explain, at least partially, the deleterious effect of HF diet exposure and deletion of LDLr gene on insulin secretion, we went to look at the level of Cx36 beta-cell content in WT and LDLr−/− islets. Experimental evidences indicate that GJ channels and its constitutive Cx36 protein are required for the fine regulation of the biosynthesis, storage and release of insulin, particularly in response to glucose (Leite et al. 2005; Serre-Beinier et al. 2009; Carvalho et al. 2010; Head et al. 2012). Lack of Cx36-made GJ channels is associated with impairment of the secretory response to glucose (Ravier et al. 2005) and with higher susceptibility to cytokine-induced beta-cell apoptosis in KO-Cx36 mice (Klee et al. 2011a), but does not seem to affect beta-cell mass (Klee et al. 2011b). In prediabetic WT mice, we have shown a correlation between a reduction in Cx36 islet expression and decrease in beta-cell secretory response (Carvalho et al. 2012) that may involve a deleterious effect of hyperlipidaemia on beta-cells (Allagnat et al. 2008).
Our initial hypothesis herein was that Cx36 downregulation contributes to the reduced glucose responsiveness and altered insulin secretion in WT and LDLr−/− islets from mice fed a HF diet. If it was true, we would see a direct correlation between the decrease in Cx36 islet levels and a decrease in stimulated insulin islet secretion or an increase in circulating cholesterol blood levels. Indeed, HF diet exposure elicited a significant decrease in Cx36 islet content in both WT and LDLr−/− mice; nevertheless, the effect was similar in both animal groups despite their marked differences in insulin secretory response. These data reinforce the idea that impairment of the Cx36-made GJ channels is involved in the altered insulin secretion and disturbance of glucose homeostasis observed during prediabetic stage. However, as reduced Cx36 islet content did not correlate directly with the decreased secretory response specifically in the case of the LDLr−/− islets, it is possible that other contributing defects in the stimulus–secretory coupling process may be associated with LDLr gene deletion, such as decreased glucose uptake and metabolism (Bonfleur et al. 2010) and impaired cAMP/PKA signalling pathway-dependent insulin exocytosis (Bonfleur et al. 2011). Interestingly, the fact that LDLr−/− islets do display reduced PKA expression (Bonfleur et al. 2011) can even explain the relatively lower reduction in Cx36 expression seen in our HF-fed LDLr−/− mice as it has been shown that this kinase mediates, through activation of ICER-1 (inducible cAMP early repressor), the changes in Cx36 expression and insulin secretion in fatty acid-exposed beta-cells (Allagnat et al. 2008).
Islet compensatory response to insulin resistance, involving increase in beta-cell mass, is a recognized feature in obesity and T2DM (Rhodes 2005; Prentki & Nolan 2006; Ahrén et al. 2010). Long-term regulation of beta-cell mass is determined by the balance of beta-cell growth, resulted of replication and neogenesis, and beta-cell loss through apoptosis or necrosis (Rhodes 2005; Prentki & Nolan 2006; Montanya & Téllez 2009). Our WT mice fed a HF diet displayed a marked increase in beta-cell mass probably due to mainly beta-cell proliferation, as indicated by Ki67 immunoreaction. Interestingly, HF diet-fed LDLr−/− mice showed no morphometric alterations indicative of hyperplasia of the endocrine pancreas, at least at the period analysed, despite the fact that the beta-cell proliferation index was similar to that observed in WT mice.
The next step was to evaluate the beta-cell neogenesis and apoptosis in LDLr−/− mice in an attempt to understand the lack of beta-cell expansion seen in these animals after HF diet. As an indirect indicator of neogenesis, we have used the proximity of islets and of small beta cell clusters to pancreatic ducts (Montanya & Téllez 2009; Gianani 2011). We observed that HF-fed LDLr−/− mice displayed a significant decrease in the frequency of islet–duct association in comparison to those fed a regular chow diet, suggesting that the neogenesis process may be somehow impaired in endocrine pancreas of LDLr−/− mice. Meanwhile, the PI assay revealed no significant changes in the WT mice but a consistent higher incidence of apoptotic beta-cells of HF-fed LDLr−/− mice in comparison with their controls.
To our knowledge, this is the first study reporting pancreatic beta cell apoptosis in HF-fed LDLr-deficient mice. Other studies have demonstrated that HF-high-cholesterol diets induce apoptosis in LDLr−/− mouse liver that explains the development of hepatic fibrosis in these animals (Subramanian et al. 2011; Bieghs et al. 2012). It was proposed that this hepatic damage was most likely a consequence of an increased sensitivity for oxidized LDL-induced inflammation in LDLr−/− mice (Bieghs et al. 2012). Although we do not know at the moment the mechanisms involved in the HF diet-induced beta-cell apoptosis in our animal model, it is possible that a similar process described previously for the liver (Bieghs et al. 2012) can occur in the endocrine pancreas of the LDLr−/− mice and can even explain their impaired insulin secretion. Evidences that support this hypothesis are as follows: (i) high concentrations of oxidatively modified LDL can compromise insulin production and increase beta-cell apoptosis in vitro (Abderrahmani et al. 2007); (ii) oxidized LDL plasma levels are expected to be high in HF-fed LDLr−/− mice (Palinski et al. 1995); (iii) beta-cells express scavenger receptor class B, member 1 (SR-B1) and CD36 (Noushmehr et al. 2005; Okajima et al. 2005), two scavenger receptors that uptake oxidized LDL (Horiuchi et al. 2003) in the absence of LDLr; and (iv) pancreatic islets from hypercholesterolaemic LDLr−/−mice, even on a regular diet, do show a markedly high-cholesterol cell content in comparison with WT mice (Bonfleur et al. 2011; Souza et al. 2013).
Taken all together, we demonstrated that the hypercholesterolaemia correlated well with the observed intolerance to glucose and reduced insulin secretion in both WT and LDLr−/− mice fed a HF diet. The higher metabolic susceptibility to HF diet seen in LDLr−/− mice, as compared to WT, may be explained by a relatively high deficiency in insulin secretory response to glucose and an impairment of the compensatory beta-cell hyperplasia (involving increase in apoptosis and reduction in neogenesis). The prediabetic state induced by HF diet intake is associated with a decreased Cx36 content at similar level in both WT and LDLr−/− islets that reinforces a role of the GJIC in the pathogenesis of T2DM as much as raises a possible negative influence of the LDLr in the process. So, we propose here that LDLr−/− mice fed a HF diet for 60 days constitute a suitable model for studying the deleterious effect of LDLr deficiency on diet-induced changes in beta-cell GJIC and growth/survival dynamic. Such studies can shed light on how modifications in lipoproteins observed in T2DM could contribute to the pathogenesis and progression of beta-cell failure.
Acknowledgments
The authors thank Marta Beatriz Leonardo for the technical assistance, and Ms. Junia C. R. Santos-Silva and Ms. Daniela A. Maschio for helping in the radioimmunoassay and morphometric analysis respectively. This work was funded by grants from FAPESP (2009/52824-1, 2010/50789-1) and CAPES/PROEX (Brazil). RBO and CPFC were recipients of CAPES fellowships (Brazil).
Conflict of interest
None of the authors have any conflicts of interest related to this work.
References
- Abderrahmani A, Niederhauser G, Favre D, et al. Human high-density lipoprotein particles prevent activation of the JNK pathway induced by human oxidised low-density lipoprotein particles in pancreatic beta cells. Diabetologia. 2007;50:1304–1314. doi: 10.1007/s00125-007-0642-z. [DOI] [PubMed] [Google Scholar]
- Ahrén J, Ahrén B, Wierup N. Increased β-cell volume in mice fed a high-fat diet: a dynamic study over 12 months. Islets. 2010;2:353–356. doi: 10.4161/isl.2.6.13619. [DOI] [PubMed] [Google Scholar]
- Allagnat F, Alonso F, Martin D, Abderrahmani A, Waeber G, Haefliger JA. ICER-1gamma overexpression drives palmitate-mediated connexin36 down-regulation in insulin-secreting cells. J. Biol. Chem. 2008;283:5226–5234. doi: 10.1074/jbc.M708181200. [DOI] [PubMed] [Google Scholar]
- Bie J, Zhao B, Song J, Ghosh S. Improved insulin sensitivity in high fat- and high cholesterol-fed Ldlr-/- mice with macrophage-specific transgenic expression of cholesteryl ester hydrolase: role of macrophage inflammation and infiltration into adipose tissue. J. Biol. Chem. 2010;285:13630–13637. doi: 10.1074/jbc.M109.069781. [DOI] [PMC free article] [PubMed] [Google Scholar]
- Bieghs V, Van Gorp PJ, Wouters K, et al. LDL receptor knock-out mice are a physiological model particularly vulnerable to study the onset of inflammation in non-alcoholic fatty liver disease. PLoS ONE. 2012;7:e30668. doi: 10.1371/journal.pone.0030668. [DOI] [PMC free article] [PubMed] [Google Scholar]
- Bonfleur ML, Vanzela EC, Ribeiro RA, et al. Primary hypercholesterolaemia impairs glucose homeostasis and insulin secretion in low-density lipoprotein receptor knockout mice independently of high-fat diet and obesity. Biochim. Biophys. Acta. 2010;1801:183–190. doi: 10.1016/j.bbalip.2009.10.012. [DOI] [PubMed] [Google Scholar]
- Bonfleur ML, Ribeiro RA, Balbo SL, et al. Lower expression of PKAα impairs insulin secretion in islets isolated from low-density lipoprotein receptor (LDLR(-/-)) knockout mice. Metabolism. 2011;60:1158–1164. doi: 10.1016/j.metabol.2010.12.010. [DOI] [PubMed] [Google Scholar]
- Carvalho CP, Martins JC, da Cunha DA, Boschero AC, Collares-Buzato CB. Histomorphology and ultrastructure of pancreatic islet tissue during in vivo maturation of rat pancreas. Ann. Anat. 2006;188:221–234. doi: 10.1016/j.aanat.2005.10.009. [DOI] [PubMed] [Google Scholar]
- Carvalho CP, Barbosa HC, Britan A, et al. Beta cell coupling and connexin expression change during the functional maturation of rat pancreatic islets. Diabetologia. 2010;53:1428–1437. doi: 10.1007/s00125-010-1726-8. [DOI] [PubMed] [Google Scholar]
- Carvalho CP, Oliveira RB, Britan A, et al. Impaired β-cell-β-cell coupling mediated by Cx36 gap junctions in prediabetic mice. Am. J. Physiol. Endocrinol. Metab. 2012;303:E144–E151. doi: 10.1152/ajpendo.00489.2011. [DOI] [PubMed] [Google Scholar]
- Coenen KR, Hasty AH. Obesity potentiates development of fatty liver and insulin resistance, but not atherosclerosis, in high-fat diet-fed agouti LDLR-deficient mice. Am. J. Physiol. Endocrinol. Metab. 2007;293:E492–E499. doi: 10.1152/ajpendo.00171.2007. [DOI] [PubMed] [Google Scholar]
- Collins AR, Lyon CJ, Xia X, et al. Age-accelerated atherosclerosis correlates with failure to upregulate antioxidant genes. Circ. Res. 2009;104:e42–e54. doi: 10.1161/CIRCRESAHA.108.188771. [DOI] [PubMed] [Google Scholar]
- Collins SC, Hoppa MB, Walker JN, et al. Progression of diet-induced diabetes in C57BL6J mice involves functional dissociation of Ca2(+) channels from secretory vesicles. Diabetes. 2010;59:1192–1201. doi: 10.2337/db09-0791. [DOI] [PMC free article] [PubMed] [Google Scholar]
- Del Prato S. Role of glucotoxicity and lipotoxicity in the pathophysiology of Type 2 diabetes mellitus and emerging treatment strategies. Diabet. Med. 2009;26:1185–1192. doi: 10.1111/j.1464-5491.2009.02847.x. [DOI] [PubMed] [Google Scholar]
- Ding YL, Wang YH, Huang W, et al. Glucose intolerance and decreased early insulin response in mice with severe hypertriglyceridemia. Exp. Biol. Med. (Maywood) 2010;235:40–46. doi: 10.1258/ebm.2009.009100. [DOI] [PubMed] [Google Scholar]
- Fan J, Watanabe T. Cholesterol-fed and transgenic rabbit models for the study of atherosclerosis. J. Atheroscler. Thromb. 2000;7:26–32. doi: 10.5551/jat1994.7.26. [DOI] [PubMed] [Google Scholar]
- Gianani R. Beta cell regeneration in human pancreas. Semin. Immunopathol. 2011;33:23–27. doi: 10.1007/s00281-010-0235-7. [DOI] [PubMed] [Google Scholar]
- Head WS, Orseth ML, Nunemaker CS, Satin LS, Piston DW, Benninger RK. Connexin-36 gap junctions regulate in vivo first- and second-phase insulin secretion dynamics and glucose tolerance in the conscious mouse. Diabetes. 2012;61:1700–1707. doi: 10.2337/db11-1312. [DOI] [PMC free article] [PubMed] [Google Scholar]
- Horiuchi S, Sakamoto Y, Sakai M. Scavenger receptors for oxidized and glycated proteins. Amino Acids. 2003;25:283–292. doi: 10.1007/s00726-003-0029-5. [DOI] [PubMed] [Google Scholar]
- Inuwa IM, El Mardi AS. Correlation between volume fraction and volume-weighted mean volume, and between total number and total mass of islets in post-weaning and young Wistar rats. J. Anat. 2005;206:185–192. doi: 10.1111/j.1469-7580.2005.00367.x. [DOI] [PMC free article] [PubMed] [Google Scholar]
- Ishibashi S, Brown MS, Goldstein JL, Gerard RD, Hammer RE, Herz J. Hypercholesterolemia in low density lipoprotein receptor knockout mice and its reversal by adenovirus-mediated gene delivery. J. Clin. Invest. 1993;92:883–893. doi: 10.1172/JCI116663. [DOI] [PMC free article] [PubMed] [Google Scholar]
- Karagiannides I, Abdou R, Tzortzopoulou A, Voshol PJ, Kypreos KE. Apolipoprotein E predisposes to obesity and related metabolic dysfunctions in mice. FEBS J. 2008;275:4796–4809. doi: 10.1111/j.1742-4658.2008.06619.x. [DOI] [PubMed] [Google Scholar]
- Klee P, Allagnat F, Pontes H, et al. Connexins protect mouse pancreatic β cells against apoptosis. J. Clin. Invest. 2011a;121:4870–4879. doi: 10.1172/JCI40509. [DOI] [PMC free article] [PubMed] [Google Scholar]
- Klee P, Lamprianou S, Charollais A, et al. Connexin implication in the control of the murine beta-cell mass. Pediatr. Res. 2011b;70:142–147. doi: 10.1203/PDR.0b013e318220f106. [DOI] [PubMed] [Google Scholar]
- Leite AR, Carvalho CP, Furtado AG, Barbosa HC, Boschero AC, Collares-Buzato CB. Co-expression and regulation of connexins 36 and 43 in cultured neonatal rat pancreatic islets. Can. J. Physiol. Pharmacol. 2005;83:142–151. doi: 10.1139/y04-133. [DOI] [PubMed] [Google Scholar]
- Merat S, Casanada F, Sutphin M, Palinski W, Reaven PD. Western-type diets induce insulin resistance and hyperinsulinemia in LDL receptor-deficient mice but do not increase aortic atherosclerosis compared with normoinsulinemic mice in which similar plasma cholesterol levels are achieved by a fructose-rich diet. Arterioscler. Thromb. Vasc. Biol. 1999;19:1223–1230. doi: 10.1161/01.atv.19.5.1223. [DOI] [PubMed] [Google Scholar]
- Montanya E, Téllez N. Pancreatic remodeling: beta-cell apoptosis, proliferation and neogenesis, and the measurement of beta-cell mass and of individual beta-cell size. Methods Mol. Biol. 2009;560:137–158. doi: 10.1007/978-1-59745-448-3_11. [DOI] [PubMed] [Google Scholar]
- Noushmehr H, D'Amico E, Farilla L, et al. Fatty acid translocase (FAT/CD36) is localized on insulin-containing granules in human pancreatic beta-cells and mediates fatty acid effects on insulin secretion. Diabetes. 2005;54:472–481. doi: 10.2337/diabetes.54.2.472. [DOI] [PubMed] [Google Scholar]
- Okajima F, Kurihara M, Ono C, et al. Oxidized but not acetylated low-density lipoprotein reduces preproinsulin mRNA expression and secretion of insulin from HIT-T15 cells. Biochim. Biophys. Acta. 2005;1687:173–180. doi: 10.1016/j.bbalip.2004.11.018. [DOI] [PubMed] [Google Scholar]
- Palinski W, Tangirala RK, Miller E, Young SG, Witztum JL. Increased autoantibody titers against epitopes of oxidized LDL in LDL receptor-deficient mice with increased atherosclerosis. Arterioscler. Thromb. Vasc. Biol. 1995;15:1569–1576. doi: 10.1161/01.atv.15.10.1569. [DOI] [PubMed] [Google Scholar]
- Peyot ML, Pepin E, Lamontagne J, et al. Beta-cell failure in diet-induced obese mice stratified according to body weight gain: secretory dysfunction and altered islet lipid metabolism without steatosis or reduced beta-cell mass. Diabetes. 2010;59:2178–2187. doi: 10.2337/db09-1452. [DOI] [PMC free article] [PubMed] [Google Scholar]
- Poitout V, Robertson RP. Glucolipotoxicity: fuel excess and beta-cell dysfunction. Endocr. Rev. 2008;29:351–366. doi: 10.1210/er.2007-0023. [DOI] [PMC free article] [PubMed] [Google Scholar]
- Prentki M, Nolan CJ. Islet beta cell failure in type 2 diabetes. J. Clin. Invest. 2006;116:1802–1812. doi: 10.1172/JCI29103. [DOI] [PMC free article] [PubMed] [Google Scholar]
- Ravier MA, Güldenagel M, Charollais A, et al. Loss of connexin36 channels alters beta-cell coupling, islet synchronization of glucose-induced Ca2 + and insulin oscillations, and basal insulin release. Diabetes. 2005;54:1798–1807. doi: 10.2337/diabetes.54.6.1798. [DOI] [PubMed] [Google Scholar]
- Rhodes CJ. Type 2 diabetes-a matter of beta-cell life and death? Science. 2005;307:380–384. doi: 10.1126/science.1104345. [DOI] [PubMed] [Google Scholar]
- Santos-Silva JC, Carvalho CP, de Oliveira RB, Boschero AC, Collares-Buzato CB. Cell-to-cell contact dependence and junctional protein content are correlated with in vivo maturation of pancreatic beta cells. Can. J. Physiol. Pharmacol. 2012;90:837–850. doi: 10.1139/y2012-064. [DOI] [PubMed] [Google Scholar]
- Scaglia L, Cahill CJ, Finegood DT, Bonner-Weir S. Apoptosis participates in the remodeling of the endocrine pancreas in the neonatal rat. Endocrinology. 1997;138:1736–1741. doi: 10.1210/endo.138.4.5069. [DOI] [PubMed] [Google Scholar]
- Schreyer SA, Vick C, Lystig TC, Mystkowski P, LeBoeuf RC. LDL receptor but not apolipoprotein E deficiency increases diet-induced obesity and diabetes in mice. Am. J. Physiol. Endocrinol. Metab. 2002;282:E207–E214. doi: 10.1152/ajpendo.2002.282.1.E207. [DOI] [PubMed] [Google Scholar]
- Serre-Beinier V, Bosco D, Zulianello L, et al. Cx36 makes channels coupling human pancreatic beta-cells, and correlates with insulin expression. Hum. Mol. Genet. 2009;18:428–439. doi: 10.1093/hmg/ddn370. [DOI] [PMC free article] [PubMed] [Google Scholar]
- Souza JC, Vanzela EC, Ribeiro RA, et al. Cholesterol reduction ameliorates glucose-induced calcium handling and insulin secretion in islets from low-density lipoprotein receptor knockout mice. Biochim. Biophys. Acta. 2013;1831:769–775. doi: 10.1016/j.bbalip.2012.12.013. [DOI] [PubMed] [Google Scholar]
- Subramanian S, Goodspeed L, Wang S, et al. Dietary cholesterol exacerbates hepatic steatosis and inflammation in obese LDL receptor-deficient mice. J. Lipid Res. 2011;52:1626–1635. doi: 10.1194/jlr.M016246. [DOI] [PMC free article] [PubMed] [Google Scholar]
- Suckale J, Solimena M. Pancreas islets in metabolic signaling–focus on the beta-cell. Front. Biosci. 2008;13:7156–7171. doi: 10.2741/3218. [DOI] [PubMed] [Google Scholar]
- Tripathy D, Chavez AO. Defects in insulin secretion and action in the pathogenesis of type 2 diabetes mellitus. Curr. Diab. Rep. 2010;10:184–191. doi: 10.1007/s11892-010-0115-5. [DOI] [PubMed] [Google Scholar]
- Winzell MS, Ahrén B. The high-fat diet-fed mouse: a model for studying mechanisms and treatment of impaired glucose tolerance and type 2 diabetes. Diabetes. 2004;53(Suppl 3):S215–S219. doi: 10.2337/diabetes.53.suppl_3.s215. [DOI] [PubMed] [Google Scholar]