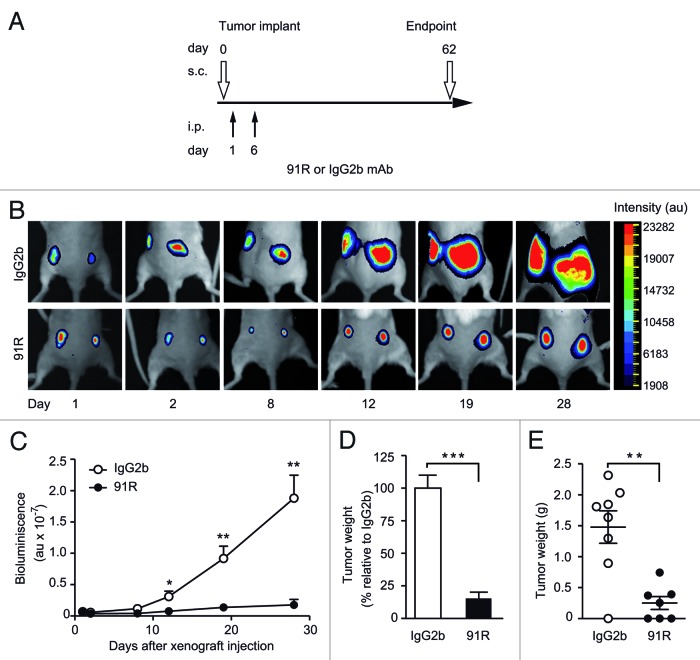
Figure 5. Short-term kinetics of 91R-induced reduction of leukemia xenograft growth. (A) Treatment schedule using luminescent MOLT-4 cells (MOLT-4-luc) inoculated s.c. into each flank of Rag2−/− mice on d0. Experimental groups received i.p. inoculations of 91R or control IgG2b mAb on d1 (4 mg/kg) and d6 (2 mg/kg). Luminescence imaging was analyzed from days 1 to 28; mice were sacrificed on d62 and tumors removed. (B) Images of a representative mouse from each group at indicated times post-cell inoculation. (C) Tumor growth kinetics after tumor implant. Relative bioluminescence units are shown as mean ± SEM (D) Percentage of tumor weight relative to IgG2b treatment at d62. Results show mean ± SEM (E) Tumor weights per mouse; data show mean ± SEM. C-E, n = 7 mice/group. *** P < 0.001, ** P < 0.01, * P < 0.05.

An official website of the United States government
Here's how you know
Official websites use .gov
A
.gov website belongs to an official
government organization in the United States.
Secure .gov websites use HTTPS
A lock (
) or https:// means you've safely
connected to the .gov website. Share sensitive
information only on official, secure websites.
